TOTAL AIRCRAFT LIFT
Throughout the preceding chapters we have considered the lift of the various components of the airplane and how it is predicted. The ultimate object of all this is to determine the lift of the complete airplane system for any condition and configuration. To evaluate the performance of a given airplane the lift is needed as a function of attitude and power. In particular the maximum lift is needed as a function of operating flap settings and center of gravity for the complete airplane as this directly influences overall capability of the airplane. The variation of the lift and its maximum value also is needed to determine the stalling characteristics and stalling speed (25,b, c,d).
Stalling Speed. The stalling speed is of primary concern as it determines the capability of the airplane and is, of course, the minimum speed at which the airplane can be operated. The stall of an airplane may be defined by the unpreventable nose drop or an unmistakable manifestation of stall, such as a sever buffeting or oscillation (25,c). The speed at which stalling takes place is determined by the maximum lift coefficient and is expressed by the equation
Ys = »/2W/Clx f s
where CLx is the maximum lift coefficient for the airplane configuration in the trimmed condition. The actual demonstration of the stalling speed of the airplane is a dynamic maneuver and depends on the rate of approach to the stall angle and the inertia of the airframe. If the dynamic approach angle to stall is large C^x wiH be larger than that based on static tests as noted in Chapter
IV.
* STALLING AT CL = 0.75
Figure 36. Influence of cutouts in the center of a wing on the induced characteristics.
(23) Lift of horizontal tail surfaces:
a) Bates, Horizontal Tails, NACA TN 1291 (1947).
b) Goethert, Aspect Ratio, Control Surfaces Ybk D Lufo 1940, P. I, 542.
c) Silverstein, Horizontal Tail Collection, NACA TR 688, 1940.
(22) Wings with longitudinal gap:
a) Munk, Tech Berichte Flug Meist, Vol. I (1917) p 219.
b) Windsor, Streamwise Gap, Univ. Md. Rpt. 453 (1965).
c) Dugan, Theory of a Gap Between Wing and Body, NACA TN 3224 (1954).
(24) H’tails with disturbance in the center:
a) Jacobs, 0012 With Proturberances, NACA Rpt 446 & 449.
b) Engelhardt
Stalling Characteristics. The stalling speed and characteristics of an airplane are a matter of safety as well as performance. For instance, if the stall is sudden and without warning, severe loss in altitude could be encountered during landing if the landing speed were not sufficiently high to eliminate gust effects. Stalling of certain types of airplanes has been found to be insidious and dangerous. This stalling problem is caused by the loss of rolling stability near maximum lift which causes the airplane to roll or possibly flip into a spiral dive, and incipient spin. Recovery from the spin can only be accomplished after some loss of altitude, which becomes critical when stalling takes place near the ground as during takeoff and landing.
Desired Stall Characteristics. An airplane with good stall characteristics will generally have a gentle stall that starts inboard on the wing. This type of stall will reduce the downwash on the tail which results in a stabilizing moment tending to eliminate the stall. Buffeting will be encountered on the tail from this as a warning. As the stall is approached there should be no loss of lateral control and the airplane should have no tendency to fall off on one wing or the other. Recovery from the stall should be easy to accomplish with a push of the control column.
If stalling can not be made safe (stable) the pilot should be forewarned by an indication of buffeting of the airplane and/or control column as well as its behavior: sagging, swaying, reduction of control response. When the stall is too dangerous it must be completely avoided by such devices as restricting longitudinal control in such a manner that the angle of attack needed for stall can not be obtained, While this appears to be a suitable approach, problems at other flight conditions may make it unsuitable.
In modern airplanes, the wings (airfoil section) are basically designed for high speed (low drag). Thin sections with small camber, and with the maximum thickness at 40% chord have a small nose radius and influence stalling as follows:
a) the angles of attack are lower
b) the stall is more sudden and more pronounced in manner
c) little warnings, such as gentle stick buffeting, occur.
Higher wing loadings, that is increased take-off and landing speeds, also make any stall more dangerous. The pilot may be forewarned of the impending stall as follows:
a) position and force of the elevator control column, also attitude of the airplane nose up.
b) vibration and sound of the airplane as a function of engine, propeller and structure
c) lateral behavior (rolling, swaying aileron response).
d) by instruments: speed, sinking or climbing.
Unfortunately, the angle of attack (against air) cannot easily be measured and indicated.
|
Figure 37. Aircraft configuration (25,a) with part-span double – slotted flaps. |
(25) Lift characteristics of complete aircraft:
a) Sweberg, Summary Maximum Lift Coefficients and Stalling Characteristics of Airplanes, NACA WR L-145.
b) Fink, Full-Scale Wind Tunnel Test Single Engine Airplane, NASA TN D-5700.
c) Wimpenny, Low-Speed Stalling Characteristics, AGARD Report 356.
d) Kier, Minimum Flying Speed for a Large Subsonic Jet Transport, NASA D-5806.
(26) Maximum lift of flapped sections:
a) Sivells, 64/75-210 Wings with Flaps, NACA TR 942.
b) Serby, Review of Full-Scale Landing Flaps, ARC RM 1921 (1937).
c) Sherman, 18 Wing-Fuselage Combinations, NACA TN 640 (1938).
d) Abbott-vonDoenhoff-Stivers, Airfoil Data, NACA TR 824 (1945).
Prediction of Aircraft Maximum Lift. The determination of CLX for the complete airplane with straight wings starts with finding the area of local stalling of the various wing sections employed as described in Chapter IV. If the wing has high lift devices Chapters VI and VII are also used. For moderate or high aspect ratio straight wings the local variation of CLX can be chosen to give the desired stalling pattern. Even with flaps the secondary effects are such that the desired stall can be predicted (25,c). In the case of swept wings the CLX is influenced to a large degree by the boundary layer flow as discussed in Chapters XV and VI. Here CLX ls increased inboard and reduced outboard making the prediction difficult.
The effect of the fuselage, nacelles and the moments needed for trim must also be considered in determining CLX. These are discussed throughout this book. Unfortunately, interference effects, gaps and associated effects make the prediction of C^x for the complete airplane somewat inaccurate. This is true even with complete model wind tunnel test results, as there are many factors that influence the results including:
a) Differences in Reynolds number between test and full scale.
b) Effect of extremely low pressures in the slots of the flaps and leading-edge devices leading to Mach number problems in the wind tunnel tests that change the results compared to full scale.
c) Trim and c. g. changes not properly measured.
d) Poor simulation of full scale airplane by model due to lack of representation of such items as flap tracks, inlets, exits, landing gears, gun openings and gaps.
e) Change in wing stalling pattern, due to Reynolds number.
f) Changes in lift due to simulation of power effects.
It has been found that generally the model test results have a C LX 10 to 15% higher than would be measured on the full scale airplane. These higher values of CLX, determined from model test results, illustrate the difficulty in accurately predicting the maximum lift of full scale airplanes. Generally, the model results are reduced by 15% when making the final prediction for these reasons.
FLAP-SPAN RATIO bf/b
![]() C2 04 00 08 Ю
C2 04 00 08 Ю
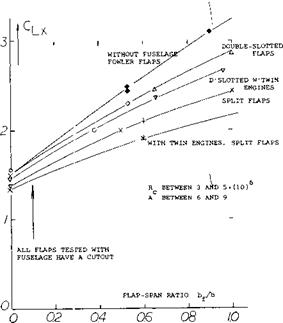
Figure 39. Flight test results of small airplane with various types of wing flaps as a function of span ratio.
Maximum Lift Build Up. In determining the maximum lift of the complete airplane for any given configuration the value of each component is found as a function of angle of attack. Starting with the wing, CL is found for the clean configuration; then the effect of flap deflections, fuselage, tail, engines and their mutual interferences are determined. Equations and data are provided throughout this book to accomplish this. A typical buildup of C j x is given on figure 37 to illustrate the effect of the various components.
 The airplane configuration as in figure 37 was tunnel tested (30,d) among others with double-slotted flaps. The maximum lift coefficient varies as follows:
|
CLX = 2.76 |
wing with full-span flaps |
|
= 2.41 |
wing with 60% span flaps |
|
= 2.09 |
after adding the fuselage |
|
= 1.94 |
after adding a horizontal tail |
|
= 1.35 |
for the plain wing alone |
|
= 1.18 |
airplane with flaps neutral |
While it thus might be claimed (on the basis of two-dimensional wind tunnel tests) that lift is increased 100% through the use of flaps, the realistic increase corresponds to 1.94/1.18 = 1.64 or to 1.94/1.35 = 1.45 only when including the fuselage. As far as gliding and climbing is concerned, the sinking speed is roughly doubled with the part-span flaps down (CUopt = 1.9) as against the condition with flaps neutral (where C opt = 1.1). The illustration also shows the stall pattern. On account of inboard flaps and fuselage, stalling begins in the parts of the wing adjoining the fuselage while the wing tips reserved for the ailerons have a completely undisturbed flow.
Another example of the variation of lift with angle of attack and CLX for an airplane with and without flaps is given on figure 38. The maximum lift coefficient of the complete full scale airplane as tested agrees with flight results, thus showing that when the exact conditions and configuration are duplicated in the wind tunnel reliable results are obtained. The increase in C [_x with power is also shown on figure 38. This would be expected based on the increased velocity in the propeller wake that impinges on the wing. In Chapter XII the procedures for calculating this increase are presented.
Figure 40. Statistical evaluation of the maximum lift on airplane configurations with trailing-edge flaps.
Effect of Flap Design. Wing flaps are presented in detail in Chapter V. The effect of the application of these flaps as a function of flap-span ratio for the complete airplane are given on figure 39. These are data from flight test results of a series of small aircraft. The drag lift ratio D/L presented shows the characteristics for evaluating landing and takeoff. At the higher values of D/L the approach angle is increased, which is usually an advantage when landing. Since Fowler and similar flaps have less drag during takeoff, the best flap system might be this type, providing it cou]d be deflected to a very high angle when landing so that the approach angle would be large due to the high D/L. The effect of flaps on C LX can also be evaluated from the data given on figure 40, an evaluation of wind tunnel test result


