Tip Loss
A characteristic of the actuator disc concept is that the linear theory of lift is maintained to the perimeter of the disc. Physically, as described in Chapter 2, we suppose the induced velocity, in which the pressure is above that of the surrounding air, to be contained entirely below the disc in a well-defined streamtube surrounded by air at rest relative to it. In reality, because the rotor consists of a finite number of separate blades, some air is able to escape outwards between the tips, drawn out by the tip vortices. Thus the total induced flow is less than the actuator disc theory would prescribe, so that for a given pitch setting of the blades the thrust is somewhat lower than that given by Equation 3.27. The deficiency is known as tip loss and is shown by a rapid falling off of lift over the last few per cent of span near the tip, in a typical blade loading distribution such as that of Figure 2.28.
Although several workers have suggested approximations [Bramwell (p. 111) quotes Prandtl, Johnson (p. 60) quotes in addition Sissingh and Wheatley], no exact theory of tip loss is available. A common method of arriving at a formula is to assume that outboard of a station r = BR the blade sections produce drag but no lift. Then the thrust integral in Equation 3.26 is replaced by (which is a change in the upper limit of the thrust integral, effectively ignoring the outer tip region of the blade):
whence is obtained, for uniform inflow and zero twist:
With a typical value B = 0.97 or 0.98 Equation 3.58 yields between 5% and 10% lower thrust than Equation 3.27 for a given value of O.
To obtain the effect on rotor power at a given thrust coefficient, we need to express the increase in induced velocity corresponding to the effective reduction of disc area. Since the latter is affected by a factor B2 and the induced velocity is proportional to the square root of disc loading (Equation 2.8), the increase in induced velocity is by a factor 1/B. The rotor induced
power in hover thus becomes:
![]()

= 1 (Ct)3/2 B ‘ 2
Typically this amounts to 2-3% increase in induced power. The factor can be incorporated in the overall value assumed for the empirical constant к in Equation 3.55.
3.6 Example of Hover Characteristics
Corresponding to CL/a and CD/CL characteristics for fixed wings, we have CT/0 and CP/CT for the helicopter in hover. An example has been evaluated using the following data:
|
Blade radius |
R |
6 m |
|
Blade chord (constant) |
c |
0.5 m |
|
Blade twist |
k |
Linear from 12° at root to 6° at tip |
|
Number of blades |
N |
4 |
|
Empirical constant |
h |
1.13 |
|
Blade profile drag coefficient (constant) |
CD0 |
0.010 |
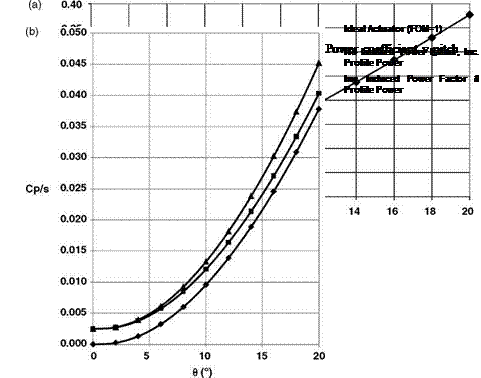
The variation of CT/s with в is shown in Figure 3.8a. The nonlinearity results from the HCT term in Equation 3.32. The variation of CP/s with в is calculated for three cases:
• k = 1.13, Equation 3.55;
• k = 1.0, Equation 3.50, the simple momentum theory result;
• figure of merit M = 1.0, which assumes kj = 1.0 and CD0 = 0.
Over the range shown (Figure 3.8b), using the factor k = 1.13 results in a power coefficient 0-9% higher than that obtained using simple momentum theory. The curve for M = 1 is of course unrealistic but gives an indication of the division of power between induced and profile components.
(Rotor performance characteristics are sometimes plotted as CP/s versus CT/s. This type of plot is known as a hover polar.)
Reference
1. Glauert, H. (1983) The Elements of Aerofoil and Airscrew Theory, Reissued in the Cambridge Science Classics Series, Cambridge University Press.


