Yawed Flow and Unsteady Aerodynamics
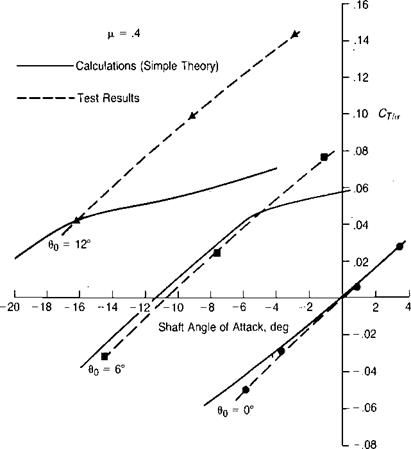
The analysis so far has been based on the assumption that the lift coefficient on the blade element is only a function of the Mach number and of the instantaneous angle of attack corresponding to the component of velocity perpendicular to the leading edge. Correlation of the results of wind tunnel tests with the results of analytical studies based on this assumption give satisfactory agreement at low thrust levels, but at high thrust levels the analysis predicts lower thrust than is measured. One such comparison, taken from reference 3.33, is shown in Figure
![]()
|
|
|
3.54. The discrepancy is explained in reference 3.34 as primarily due to two effects: the beneficial effect of yawed flow on the maximum lift coefficient, and the finite time required for the boundary layer to separate during the stall.
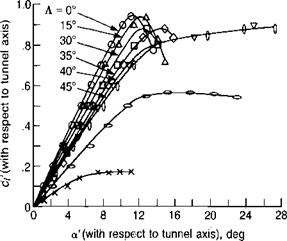
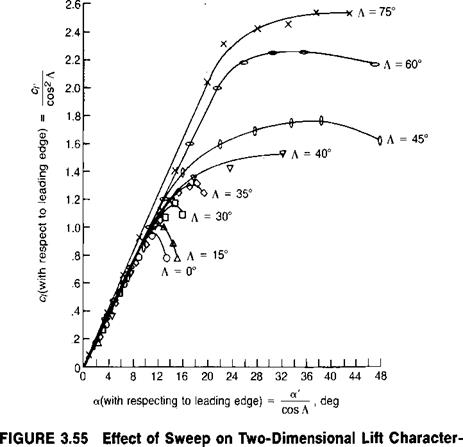
The significance of the yawed flow on maximum lift coefficient was first discussed in reference 3.35. The effect has been measured in wind tunnel tests of yawed wings. Figure 3.55 shows data from reference 3-36—corrected to infinite aspect ratio conditions—first as based on velocities and angles of attack referenced to the tunnel axis system, and then as based on the velocities and angles of attack perpendicular to the leading edge of the wing. In this latter system, which is consistent with that used in the blade element computing method, it may be seen that the measured maximum lift coefficient increases from 0.9 to 2.2 as the sweep is increased. Reference 3.35 suggests that the increase in maximum lift coefficient be represented by the engineering approximation:
|
FIGURE 3.54 Failure off Simple Theory to Correlate with Measured Rotor Thrust |
Source: Arcidiacono, “Aerodynamic Characteristics of a Model Helicopter Rotor Operating under Nominally Stalled Conditions in Forward Flight,” JAHS 9-3, 1964.
|
|
|
|
istics
Source: Purser & Spearman, “Wind-Tunnel Tests at Low Speed of Swept and Yawed Wings Having Various Plan Forms," NACA TN 2445, 1951.
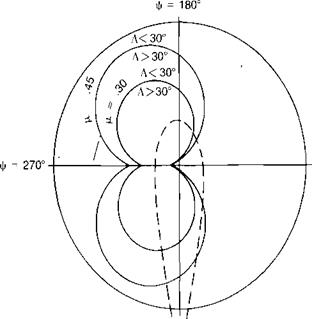
It is evident that there is no effect for the blade at |/ = 270°, where there is no yawed flow; but for other azimuth positions, the delay in stall can be significant. Figure 3.56 shows the regions on the rotor in which A exceeds 30° for tip speed ratios of 0.3 and 0.45. The effect can be considered to be important inside these boundaries. The increase in maximum lift coefficient can be incorporated into the airfoil data in a computer program in several ways.
If airfoil equations such as those in Chapter 6 are being used in the computer program, the value of aL, the angle of attack at which the airfoil first exhibits stall effects, an be modified by:
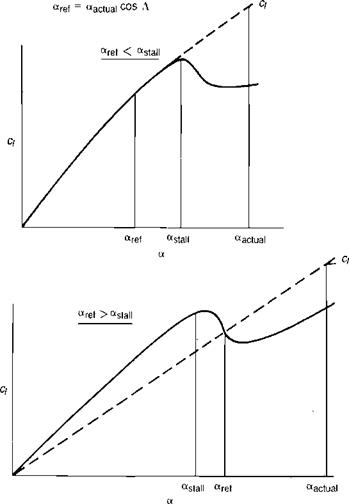
If tabulated airfoil data are being used, the effect can be incorporated by using a reference angle of attack that is less than the actual angle of attack:
a«f. = ttaamd COS A
|
ф = 0° V FIGURE 3.56 Boundaries for 30° of Local Sweep |
NUMERICAL INTEGRATION METHODS 219 This is used to define a fictitious lift curve slope such that:
|
|
If aref is less than the stall angle, the ct will be as if stall did not exist. If arcf is above the static stall angle, the ct will be somewhere above the static ch as shown in Figure 3.57.
The wind tunnel tests of reference 3.36 have also been used to determine the effect of sweep on the drag and pitching moment characteristics. These studies show that in contrast to lift, sweep angles under 60° have little effect on the drag and moment characteristics.
|
FIGURE 3.57 Use of the Reference Angle Concept |
If the angle of attack on a blade element is increasing rapidly, the stall will be delayed until some angle is reached considerably above the normal stall angle. An extensive discussion of this lift overshoot phenomenon is given in Chapter 6. Several ways of handling this effect have been developed for use in computer programs. These vary from the sophisticated analytical approaches of references 3.37 and 3.38 to the simpler empirical approaches of references 3.39, 3.40, and 3.41. The first two use potential flow and boundary layer equations to predict the separation angle and are not suited for programs whose primary objective is to calculate rotor performance. The last three depend on characteristics derived from oscillating airfoil wind tunnel tests, and each has been used in rotor performance programs.
The method of reference 3.39 calculates changes in the effective camber and angle of attack due to the pitching velocity and uses these with an empirical time lag to establish the characteristics of the lift overshoot and subsequent hysteresis loop boundaries.
The method of reference 3.40 makes use of tabulated lift and moment coefficients as a function of the angle of attack and its first two time derivatives. These supplement the usual tables, which are a function of angle of attack and the Mach number.
The final method was originally outlined in reference 3.34 and was later expanded in reference 3.41. It has been used to produce the isolated rotor charts in this chapter. In this method, the dynamic overshoot is expressed as an increase in stall angle due to a pitching velocity:
where у is a function of Mach number. It can be evaluated from wind tunnel tests of oscillating airfoils such as those reported in references 3.42 and 3.43 from those test points in which maximum lift was attained before the maximum angle of attack was reached. Chapter 6 has a discussion of this type of test. For the charts, a simple form of у given in reference 3.44 was used:
(.б
у = 1.76 In —
M
The term within the radical can be written as a function of the change in angle of attack from one azimuth position to another at the same radius station, since:
This angle – increment should be added to the static stall angle in whatever type of airfoil data presentation is used. If the equation form developed in Chapter 6 is used, Aasnll is simply added to aL after it has been modified for sweep effects. If tabulated airfoil data are being used, the stall delay can be incorporated using the technique that was used for the sweep effect—that is, by defining a reference angle of attack, which is now:
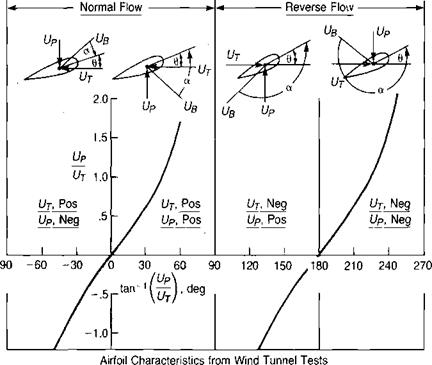
Along the boundary of the reverse-flow region, the calculated angle of attack, the sweep, and the rate of change of angle of attack on the blade element, are very high. This combination can result in the equations predicting unreasonably high—or low—lift coefficients. Even though the dynamic pressure is low along the boundary, significant errors can be introduced when an entire blade element is assigned a lift coefficient of 100 or more! For this reason, it has been found desirable to set bounds on the allowable lift coefficient. Figure 3.58 shows the limits on the minimum and maximum values that have been used for the 0012 airfoil. The maximum boundary is purely arbitrary and is based on a lift curve slope of 2tt and on the assumption that the sweep and stall delay effects will produce no benefits beyond an angle of attack of 45°. The minimum boundary represents the approximate lift characteristics of a sharp-edged flat plate with extreme thin airfoil stall characteristics.
In Chapter 6 it will be shown that the drag coefficient is affected by dynamic overshoot, which delays the drag rise in the same manner that it delays lift stall. The drag, however, is not affected by sweep as maximum lift is.
Another unsteady aerodynamic effect which may be included in the program is the classical unsteady potential flow. The lift of an airfoil is affected by the rate of change of angle of attack and by the rate of plunge, both of which produce shed vorticity lying behind the trailing edge, which induces velocities at the front of the airfoil. The basic theory was developed in reference 3.45. In that reference, potential theory was used to analyze the
In order to eliminate the imaginary terms, Да and 0 will be assumed to be pure oscillations at the rotor frequency, such that:
For use in the computing program, it is convenient to write the equation in terms of a correction due to unsteady effects, which can be simply added to the lift coefficient based on steady conditions. Assume that:
2V 2ClR Щ+Щ /иі+ Ul
The functions F and G shown on Figure 3.59 can be approximated by:
If l/k < 15, then F = .9 – .00178 (15 – 1 Ik)2 If l/k > 15, then F = .864 + .0024 (l/k) and G = -.2 + .0025 (l/k)
These equations can be incorporated directly in the computer program. Figure 3.60 shows the correlation of the theory against the test results of an oscillating airfoil, which were reported in reference 3-42. It may be seen that the measured effect is somewhat greater than predicted. The relative importance of the effect on rotor performance is shown in Figure 3.61, where the calculated lift coefficient at the 75% radius for a typical flight condition is shown with and without the unsteady effect. The overall result is to increase the rotor thrust slightly for a given set of rotor conditions. The drag of the blade is assumed to be unaffected by the shed vorticity and, if required, the effect on aerodynamic pitching moment may be calculated using the methods given in reference 3-41.


