Our heavyweight helicopter equal in the world does not have
In Rostov started production of the most load-lifting rotary-wing car The Russian holding «Helicopt[...]

Everything about aircrafts and helicopters. News and events in aviation worldwide. Civil, transportation, military helicopters and airplanes.

Everything about aircrafts and helicopters. News and events in aviation worldwide. Civil, transportation, military helicopters and airplanes.

Everything about aircrafts and helicopters. News and events in aviation worldwide. Civil, transportation, military helicopters and airplanes.

Everything about aircrafts and helicopters. News and events in aviation worldwide. Civil, transportation, military helicopters and airplanes.


The flow around the fuselage and empennage is characterized by strong nonlinearities and distorted by the influence of the main rotor wake. The associated forces and moments due to the surface pressures and skin friction are therefore complex functions of flight speed and direction. While computer modelling of the integrated flowfield is no longer an impossible task, most of the flight mechanics modelling to date has been based on empirical fitting of wind tunnel test data, gathered at a limited range of dynamic pressure and fuselage angles of incidence, at model (Ref. 3.47) or full scale (Ref. 3.48). Assuming ‘similar’ fluid dynamics at the test and full-scale flight conditions, we note that the forces at a general flight speed, or dynamic pressure, can be estimated from the data at the measured conditions through the relationship
/ pfV2S
F(V, pf) = F(Vtest, Ptest) ———– ‘f 1 (3.240)
ptestVt2estStest)
where the subscript test refers to the tunnel test conditions and S is a reference area. Most of the published test data have been measured on isolated fuselage shapes, although the findings of Ref. 3.47 have shed light on the principal effects of rotor wake/fuselage interaction and the approximate formulation outlined below is based on this work.
The three most significant components in forward flight are the fuselage drag, which dominates the power requirement at high speed, and the pitching and yawing moment changes with incidence and sideslip respectively. The fuselage rolling moment is usually small except for configurations with deep hulls where the fuselage aerodynamic centre can be significantly below the aircraft centre of gravity. At lower speeds, the fuselage aerodynamic loads are correspondingly smaller, although significant effects will be the sideforce in sideways flight and the vertical load and yawing moment due to the main rotor wake. The fuselage moments are generally destabilizing, resulting from the greater planform and side area ahead of the aircraft centre of gravity. These two points will not, in general, be coincident. In addition, wind tunnel test data are relative to a third point, generally referred to as the ‘fuselage aerodynamic reference point’, to be distinguished from our ‘fuselage reference point’ below the main rotor hub on the aircraft x-axis. Fuselage aerodynamic data measured in a wind tunnel are usually presented in wind tunnel axes as lift, drag, sideforce and corresponding moments about the tunnel-fixed reference system. We assume that the transformation from wind tunnel to fuselage axes has been applied so that we work with forces in the moving fuselage axes system. The effect of rotor downwash can be approximately taken into account by assuming the fuselage is immersed in the uniform component, through the assumption of superposition; hence, the fuselage incidence and velocity can be written as
af = tan-1 ^^ , Vf = (u2 + v2 + w2)1/2, k® < 0 (3.241)
af = tan-1 ^ , Vf = (u2 + v2 + wk)1/2, ko > 0 (3.242)
where
wk = w – kkf ЯRko (3.243)
and kkf is a constant taking into account the increase in downwash at the fuselage relative to the rotor disc. The fuselage sideslip angle is defined as
P f = sin-1( V_j (3.244)
The forces and moments may now be written in the generalized form:
12
Xf = 2 P V2 SpCxf (a f, Pf) (3.245)
12
Zf = 2 P Vf SpCzf (a f, Pf) (3.246)
12
Mf = 2PVjSplfCmf (af, Pf) (3.247)
12
Yf = 2 P Vf SsCyf (a f, Pf) (3.248)
12
Lf = 2PVjSslfClf (af, Pf) (3.249)
12
Nf = 2pVfSslfCnf(af, Pf) (3.250)
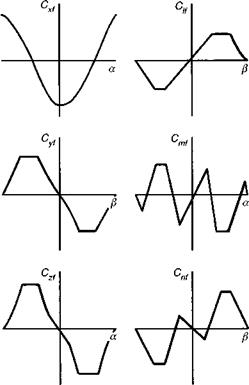
where Sp and Ss are the plan and side areas of the helicopter fuselage, respectively. Typically, the force and moment coefficients will be derived from table look-up functions of incidence and sideslip. Piecewise linear variations illustrating the main characteristics over the incidence and sideslip range, -180° to +180°, are shown in Fig. 3.31. The yaw moment is sometimes defined as two functions corresponding to forward and rearward flight, i. e.,
Cnf — Cnfa, u > 0
Cnf = Cnfb, u < 0 (3.251)
The fuselage X force has a minimum value at small angles of incidence, and is practically zero in vertical flight (a = 90°). The pitching moment increases linearly with incidence up to some moderate value when flow separation at the leeward fuselage hull causes a loss in circulatory lift and moment and a corresponding loading reversal. The Y and Z forces have similar shapes, rising to maximum values at 90° of incidence
|
Fig. 3.31 Typical variation of fuselage aerodynamic force coefficients with incidence angles |
and sideslip respectively. The breakpoints shown in Fig. 3.31 are very much dependent on the particular fuselage configuration. To account for local, more strongly nonlinear effects, smaller incidence and sideslip intervals would certainly be required. Numerical values for Lynx, Bo105 and Puma fuselage aerodynamic coefficients are given in Appendix 4B. Here the data are taken from wind tunnel tests conducted so that X, Z and M varied only with angle of incidence and Y and N varied only with angle of sideslip. Using these data in conjuction with the equations 3.241-3.250, one should be careful to acknowledge the absence of the cross effects, e. g., the variation of X force with sideslip. The simplest expedient is to delete the v2 term in the expression for Vf, eqns 3.241 and 3.242. A more general approach could be to assume a simple cos в shape so that the X force becomes zero at в = 90°.
The above discussion has been restricted to essentially steady effects whereas, in practice, the relatively bulbous shapes of typical helicopter fuselages, with irregular contours (e. g., engine and rotor shaft cowlings), give rise to important unsteady separation effects that are difficult to simulate accurately at model scale; unsteady effects in manoeuvring flight are also difficult to account for. The problem is exacerbated by the immersion in the rotor downwash at low speed. Sophisticated wind-tunnel and computer modelling techniques are available nowadays but are often very expensive, and confidence in such techniques is still reduced by lack of full-scale validation data.