
Our heavyweight helicopter equal in the world does not have
In Rostov started production of the most load-lifting rotary-wing car The Russian holding «Helicopt[...]

Everything about aircrafts and helicopters. News and events in aviation worldwide. Civil, transportation, military helicopters and airplanes.

Everything about aircrafts and helicopters. News and events in aviation worldwide. Civil, transportation, military helicopters and airplanes.

Everything about aircrafts and helicopters. News and events in aviation worldwide. Civil, transportation, military helicopters and airplanes.

Everything about aircrafts and helicopters. News and events in aviation worldwide. Civil, transportation, military helicopters and airplanes.


One of the main difficulties in realizing a functional MAV is its inherent sensitivity to the operating environment because of its size and weight. Wind gusts create intrinsic unsteadiness in the flight environment [318] (see also discussions of the fixed wing in Section 2.2.4) As discussed in Chapter 1, the characteristic flapping time scale of insects and hummingbird – O(10x) to O(102) of Hz – is much shorter than the time scale of a typical wind gust (around O(1) Hz). Hence, from the flapping wing time scale, many wind gust effects can be treated in a quasisteady manner. However, the vehicle control system (as in the case of a biological flyer) operates at lower frequencies, and their time scales are comparable to those of anticipated wind gusts. Therefore, there is a clear multi-scale problem between unsteady aerodynamics, wind gust, and vehicle control dynamics. Since a small bird or insect flaps much faster than commonly experienced wind, the aerodynamics
 |
 |
 70
70
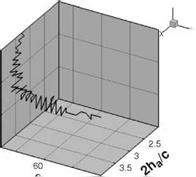
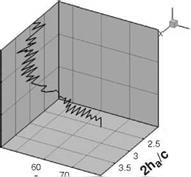
Figure 3.28. Pareto fronts illustrating the competing objectives of time-averaged lift and power requirements in 2D (left) and 3D (right) and the design variable combinations that provide those fronts. The dashed line is for reference.
associated with flapping wings can be pragmatically modeled by a constant free – stream.
Trizila et al. [301] investigated environmental sensitivity in regard to varying kinematic schemes and free-stream strengths and orientations; the same kinematic patterns highlighted in previous sections are adopted again in this discussion. The free-stream strength was fixed at 20 percent of the maximum translational velocity of the wing. Based on parameters associated with fruit flies [Re = O(102) and wing speed is approximately 3.1 m/sec], the free-stream fluctuation would be approximately 0.6 m/s, a relatively light wind gust. The directions of the free-stream varied between heading down, right, or up.
The 2D cases were much more sensitive to the free-stream than their 3D counterparts. Instantaneous lift associated with all three kinematic patterns (synchronized rotation with either low or high AoA and delayed rotation with high AoA) was very sensitive to the horizontal free-stream and much less sensitive to the downward heading free-stream. The downward free-stream generally decreased lift by suppressing vortex generation, while making the forward strokes and backstrokes more symmetric as the vortical activity was washed away from the airfoil more quickly. Overall, the general nature of the force history was kept intact. In contrast, the upwind free – stream had the opposite effect. Namely, the vortex interactions were sustained for a longer period of time, because the free-stream held the wake closer to the airfoil
and the increased AoA also served to accentuate the unsteady aerodynamics. This upward free-stream may or may not have had a significant impact on the force history, which was dependent on the kinematics. The horizontal free-stream had the largest impact over the range of kinematic motions studied, sometimes more than doubling the lift felt for a free-stream strength of 20 percent of the maximum translational velocity, a relatively tame environmental situation leading to a significant change in hovering performance.
Figure 3.29 shows the lift histories and vorticity contours, illustrating the vortex formation and interactions during the LEV-dominated portion of the stroke (Fig. 3.29a-c) and during the wake-capture-dominated portion of the stroke (Fig. 3.29d-f) at their respective maximal lifts for a 20 percent strength headwind hover scenario without free-stream. The 3D LEV-dominated portion of the stroke is highlighted with m3 contours at two spanwise locations with a 20 percent free-stream. Immediately apparent is the large impact on both the instantaneous and time-averaged lift. To clarify, the lift coefficients are still normalized by the velocity related to wing motion (e. g., the mean/maximum translational velocity); that is, the normalization is independent of the free-stream. Flow fields are plotted during the headwind portion of the stroke (backstroke) and show that the headwind case exhibits a more developed and stronger LEV, as well as stronger vorticity shedding from the TE. The increased vortical activity created by the headwind, which then interacts with the airfoil in a favorable manner, qualitatively explains the increase in performance during the backstroke.
However, the significant lift peak in the presence of tailwind is due to a different lift-generation mechanism. This peak occurs after stroke reversal as the airfoil interacts with the previously shed wake, or the wake-capture-dominated portion of the stroke cycle. The hover case temporarily drops off in lift (see Fig. 3.29d), whereas the 20 percent free-stream case, now a tailwind, continues to increase in lift. Vorticity contours at their respective local maximums in lift (see Figs. 3.29e and 3.29f) show a few striking differences, noticeably the strength and position of the previously shed vorticity. The presence of headwind during the backstroke creates stronger vortices. On the return stroke, the strengths of these vortices, in addition to their position relative to the airfoil, significantly help promote vortex growth (see Fig. 3.29f). This interaction, resulting in a temporary enhancement, eventually plays itself out, and a decline in lift ensues in what used to be dominated by the LEV but now amounts to slower relative translational velocity.
Looking at the 2D force histories (Fig. 3.30a) again, one sees that the response of a free-stream depends not only on the kinematics but also on its orientation. Figure 3.31 illustrates the lift response to a free-stream for 2D (Fig. 3.31a-c) and 3D (Fig. 3.31d-f) computations. The free-stream magnitude is 20 percent of the maximum plunging velocity and is headed in three different directions for the three hovering kinematics investigated in the previous two sections (3.4.1.1 and 3.4.1.2). The dotted lines in Figure 3.31a-f are the lift responses of the hovering cases (i. e., no free-stream). For some situations, the qualitative nature of the flow does not change much over the course of the entire cycle, nor are the forces too sensitive; see the vertical free-stream in Figure 3.31a or the downward free-stream in Figure 3.31c. However, the horizontal free-stream has an appreciable impact for all of the kinematic patterns considered in Trizila et al. [301]. Yet the upward and downward
 |
 |
-4 -3.2-2.4-1.6-0.8 0 0.8 1.6 2.4 3.2 4
![]() (j) 2ha = 3.0cm, aa = 45°, and ф = 90°
(j) 2ha = 3.0cm, aa = 45°, and ф = 90°
Figure 3.29. Force history and vorticity contours illustrating the vortex formation and interaction during the LEV dominated portion of the stroke (a-c) or wake capture dominated portion of the stroke (d-f) at their respective maximal lift for a 20% strength headwind free – stream and no free-steam. The 3D LEV-dominated portion of the stroke is highlighted with z-vorticity at two spanwise locations with a 20% free-stream in g, h, and i. Wing motion is shown in j.
 |
|
 |
|
-2.5 -2 -1.5-1 -0.5 0 0.5 1 1.5 2 2.5
x
Figure 3.30. Force history and vorticity contours illustrating the vortex formation between stroke reversal and their respective maximums in lift for (b) 20% downward freestream and (c) 20% upward stream.
free-streams do not necessarily elicit similar responses in opposite directions, as highlighted in Figure 3.30. This brings into question the relevance of using effective AoA in these situations, because the force history may respond more noticeably to the upward free-stream than the downward free-stream; see Figure 3.31a-c, where a 20 percent free-stream imposed from different directions significantly changes the qualitative behavior of the resulting force history.
For all of the synchronized rotation cases (which have positive AoAs at all times), a 20 percent downward free-stream does indeed decrease the lift. The downward free-stream also suppresses the vortical flow strength as the effective AoA is lowered. However, some cases have a much more pronounced sensitivity to the upward free – stream. Figure 3.30a illustrates again the force histories for a 20 percent free-stream at various orientations relative to the hover case, as well as the vorticity flow field (Figs. 3.31a and 3.31c) for the 20 percent upward and downward free-stream cases at a time where the difference in force history between the two is pronounced. What is seen in Figure 3.30b and Figure 3.30c is the increase in LEV and TEV formation, as well as a more pronounced interaction with the wake, as the upward free-stream promotes the growth of the vortex structures and holds the wake in the vicinity for a longer period of time. The non-linear response in lift as the free-stream lowers or raises the effective AoA is a product of these factors.
The 3D cases, in contrast, are much less sensitive to the free-stream (see Fig. 3.29 g-i and Fig. 3.31 d-f. Note, however, that the scale for the force histories was chosen so that they could be directly compared with the 2D case and the free – stream could be quite influential. The impact is non-negligible for a 20 percent strength free-stream, but overall, the nature of the flow is very similar for most cases.
Figure 3.31. 2D (a-c) and 3D (d-f) CL in response to a free-stream with a
The downward free-stream once again degrades lift, and the upwind free-stream enhances it, albeit to a lesser degree than in the 2D cases.
Figure 3.32 highlights the vortex interactions at the beginning, middle, and ending of the strokes for a 20 percent free-stream tailwind. The blue arrow in vorticity contours for 2D and at mid-span and the wingtips for 3D denote free-stream directions. The 3D wing is unable to generate vortices of the same magnitude as the analogous 2D counterpart. This inability directly affects the wing’s benefit from LEV interactions, as well as subsequent interactions with the previously shed wake. The spanwise variation of vorticity exhibited shows a decrease in LEV generation from mid-span to tip, and although the tip vortices are prominent, they do not make up for the weakened LEV formation and wake interaction, as experienced in 2D. Figure 3.29 illustrates the vorticity flow fields during maximal lift during the headwind, resulting in a 2D lift (Fig. 3.29a) that is almost twice as large as its 3D counterpart (Fig. 3.29g).
 |
This discrepancy in sensitivity to free-stream between 2D and 3D shows up across the range of kinematic motions. A limited subset of kinematic motions show very similar force histories in the time-averaged sense, as well as instantaneously (see Section 3.4.1.2) when not under the influence of an external free-stream. The kinematics in this region of the design space shares low AoAs across much of the flapping cycle and synchronized rotation, limiting the high angular velocities. A lower angular velocity, in turn, tends to limit vortex size, strength, formation, and influence. As the free-stream is introduced (see Figs. 3.31c and 3.31f for 2D and 3D force histories, respectively, in the presence of a 20 percent free-stream), the response is not uniform across the span of the finite wing. The downward free-stream (20 percent strength) tends to suppress the vortex dynamics, and as such, the 2D
and 3D force histories remain quite similar. In contrast, the horizontal free-stream, most notably during the headwind and the upward free-stream, shows differences due to the 3D nature of the flow; the reader is referred to Trizila et al. [315] for more details, which include further flow field examinations not described here for the sake of conciseness.


