EPPLER’S RESEARCH
Of particular importance has been the publication of Professor Richard Eppler’s computer programme, in co-operation with Dan Somers. This programme was developed in order to enable a wing profile to be designed exactly to fit any required specification and it has been used with excellent results for full-sized as well as model aeroplane and sailplane aerofoils. It has also been applied to model wing sections, notably by Rolf Girsberger in Switzerland, Helmut Quabeck and Martin Hepperle in Germany, and Michael Selig in the U. S.A. (Note, the HQ profiles designed for models by Quabeck
Seporation bubble worning
д upper surface
![Подпись: Theory Re - 10s E 6V 8Л5І Fig. 9.16 Drag polar of Eppler 64, 8.5% thick aerofoil, as measured in wind tunnel, compared with theoretical prediction at Reynolds number 100 000. Note where theory predicts separation bubbles on both upper and lower surfaces, measured drag is far greater. Note also that the Cd scale does not start at zero. (Chart published first by R. Eppler in his paper read at the R.Ae.Soc. Conference, October 1986].](/img/3131/image150_4.gif) |
t U t 8A5X v l°wer surface
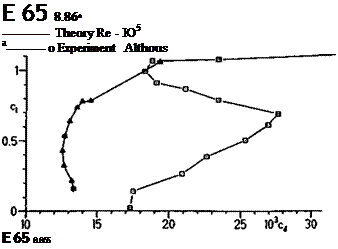
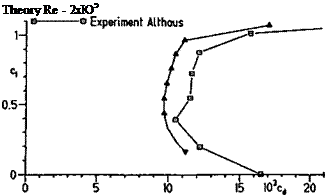
Fig. 9.17 Theory and test of the Eppler 65, 8.86% thick profile, at Re 100 000 and 200 000.
Note the different scales of drag, starting at 0.01 and 0.0 respectively.
 |
Separation bubble warning л upper surface v lower surface
|
E 65 8.86* |
 |
Separation bubble warning д upper surface v lower surface
should not be confused with the Horstmann and Quast HQ series for full-sized aircraft.)
The Eppler programme, when applied to very low Re numbers, gives warning when laminar separation bubbles on the wing are likely to cause significant departures of the actual lift and drag figures achieved in flight, from the theoretical predictions. Drag polar curves similar to those of Figures 9.14 and 9. IS now usually appear with ‘bubble warning’ tags at various points. Practical wind tunnel tests, mostly by Dieter Althaus at Stuttgart, demonstrate that wherever a bubble warning appears on the computed charts, the drag curve will depart quite seriously from the computed figures, almost invariably moving to the high drag side.
Some of the results are illustrated in Figures 9.16—9.18. These have been published by Eppler himself. In Figure 9.16, a drag polar for the Eppler 64 profile is shown for Reynolds number 100,000. The computer predicts bubble separation over most of the operating range of the aerofoil. The two curves diverge markedly, especially where the computer programme predicted the minimum drag coefficient. Near this location on the curve, separation bubble warnings appear on both upper and lower surfaces of the wing (indicated by overlapping triangles making a six pointed star). Agreement of the theoretical curve with the measured one is better at higher Re.
In Figure 9.17 results are shown for the Eppler 65 at two different Re numbers. At the higher Re of200,000, agreement of theory and measurement is not too bad although far from perfect. The computer predicts separation bubbles over most of the usable range of C| values. At the lower Re of 100,000, the two curves match nowhere except over a very narrow range at high cj, very close to the stall. Again this is no surprise in view of the bubble warnings.
Eppler concludes that while the bubble warnings on the computed polars are useful, their true significance is that modellers cannot rely on the computed drag curves of any aerofoil produced by these methods when the warning tags appear. These remarks apply equally to profiles designed by others using the Eppler programme or equivalents to it. Profiles by Helmut Quabeck, Rolf Girsberger and Michael Selig have been well proved in practice, as have those of Eppler himself, but at low Re they do not perform as efficiently as expected. Laminar separation bubbles do occur on all of them and do affect the drag. (Eppler points out that E65 is of theoretical interest only and is not recommended for practical use.)


