Signal characteristics
The LDA can obtain information on the speed of the particles and therefore, if certain conditions are met, on the fluid stream flowing in an extremely small volume and whose position can be controlled with precision.
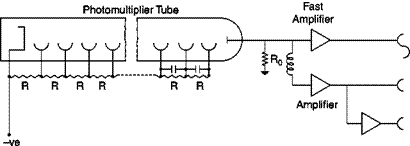
This information is in the form of a sinusoidal variation in the amount of light that reaches the surface of an optical detector that usually is a photomultiplier, since the intensity of the light scattered by the particles is low. Without going into the details of a photomultiplier, it suffices to say that variations in light intensity are converted into a proportional change in the flow of electrons whose number is amplified by a cascade system of electrodes, called dynodes (Figure 4.19), and finally collected by the anode in the form of an electrical signal variable over time.
An electrical signal whose frequency is proportional to a component of the particle velocity is generated:
fD = KUcos у
where fD is the frequency of the signal (Doppler frequency) and the constant K is a function of the wavelength of laser light and the geometry of the optical system. This extremely simple relation is the main attraction of LDA. The signals should be well separated in time: this can be achieved with a proper seeding of the stream which means that there should be only one particle at a time in the control volume.
The characteristics of the signal to be analyzed can be summarized as follows:
■ There is an intermittent signal that contains a number of periods less than or equal to the number of interference fringes, which means typically between 15 and 100, and the signal can be present for a certain percentage of the total time.
■
 |
The frequency of the oscillations can be different for each signal: in the particular case of turbulent motion in which the velocity varies over time, it is necessary to measure these variations in frequency.
■ The frequency range is very wide, typically from a few Hz to 100 MHz.
■ The signals are modulated on a continuous level (the pedestal) that can be lowered with a high-pass filter.
■ A certain amount of noise is superimposed on these signals due to noise in the photomultiplier and other electronic devices, optical noise produced by the higher order modes of the laser light scattered from outside the measuring volume, dirt, scratches on windows, ambient light, multiple particles, reflections from windows, lenses, mirrors. Furthermore, the signal can be very weak because the particle is too small or the distance of the measuring point from the photomultiplier is large; in some extreme cases, the signal to noise ratio can go down to 1.
A measure of the frequency of each signal is relatively easy (Figure 4.13): it is sufficient to count the number of complete oscillations per unit time, the speed is calculated from the measured frequency, so in theory the measure is obtained. If the motion is turbulent, however, it is unfeasible to memorize the signals from thousands of particles to get the histogram of Figure 4.9 for each component and analyze them manually, of course automated systems are needed.


