Our heavyweight helicopter equal in the world does not have
In Rostov started production of the most load-lifting rotary-wing car The Russian holding «Helicopt[...]

Everything about aircrafts and helicopters. News and events in aviation worldwide. Civil, transportation, military helicopters and airplanes.

Everything about aircrafts and helicopters. News and events in aviation worldwide. Civil, transportation, military helicopters and airplanes.

Everything about aircrafts and helicopters. News and events in aviation worldwide. Civil, transportation, military helicopters and airplanes.

Everything about aircrafts and helicopters. News and events in aviation worldwide. Civil, transportation, military helicopters and airplanes.


4.4.1 Principle of operation
In the L2F, also known as a laser transit anemometer (LTA), the fluid stream velocity is obtained, by its definition, by measuring the time taken by a particle driven by the fluid to travel the distance between two light targets generated by two highly focused laser beams. The idea dates back to 1968 when it was introduced by D. H. Thompson. However, a tracer particle fluid velocity meter was only suitable for measuring velocities of the order of 20 m/s in the absence of turbulence. In 1973, Tanner, Schodl and Lading introduced new methods of analysis that allowed the extension of the measurements even at moderately turbulent flows (turbulence intensity up to 30%) and at supersonic speeds.
 |
Figure 4.23 shows a particle traveling a trajectory normal to the axes of both beams. A signal of start from light scattered by a particle crossing the first focus activates a timer and when the particle crosses the second focus a signal of stop is sent to the timer. The flight time is the time interval between two pulses of start and stop for the same particle (correlated pulses).
 |
If in the measurement zone there are two separate particles and/or the direction of velocity is not normal to both axes (Figure 4.24), the start and stop pulses are generated by different particles. The time interval measured has no correlation with particle velocity, i. e. random pulses.
With a single measurement it is not possible to decide whether the measured time interval is random or if it is the flight time of a particle. Making a significant number of measures of time intervals the data with no correlation are averaged as a background noise while the correlated data will tend to be distributed according to a quasi-Gaussian curve like those in Figure 4.9.
To locate the direction of the velocity in the plane perpendicular to the optical axis, it is necessary to accumulate histograms in all directions of the plane; this is done by rotating one beam around the other (Figure 4.25). Histograms taken at different angular positions produce a 2D histogram, speed-direction. If the velocity vector lies in the chosen plane (2D flow), the histogram shows a peak and both the most likely value of the speed and of the direction of the velocity vector can be read from it (Figure 4.26).
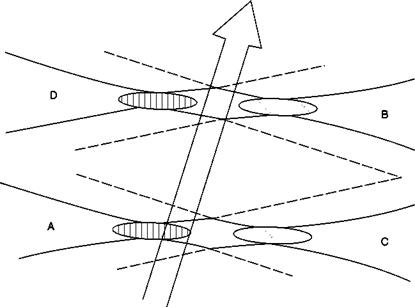
If the flow is not in the plane perpendicular to the optical system, the number of correlated impulses falls. The 3D L2F utilizes this effect to obtain velocity information in three dimensions. Using two colors of a laser, a pair of focal volumes is generated for each beam displaced along the optical axis, as shown in Figure 4.27. The system simultaneously measures the times of flight from A to B and from C to D: the distance of the direction of the velocity is obtained by the ratio between the number of data in these two channels.
![]()
 |
 |
|
|