Our heavyweight helicopter equal in the world does not have
In Rostov started production of the most load-lifting rotary-wing car The Russian holding «Helicopt[...]

Everything about aircrafts and helicopters. News and events in aviation worldwide. Civil, transportation, military helicopters and airplanes.

Everything about aircrafts and helicopters. News and events in aviation worldwide. Civil, transportation, military helicopters and airplanes.

Everything about aircrafts and helicopters. News and events in aviation worldwide. Civil, transportation, military helicopters and airplanes.

Everything about aircrafts and helicopters. News and events in aviation worldwide. Civil, transportation, military helicopters and airplanes.


In this first example, we examine in some detail the apparently straightforward case of a helicopter’s vertical response to collective in hover. In both Chapters 2 and 4 we have already discussed the quasi-steady approximation for helicopter vertical motion given by the first-order equation in vertical velocity
w – Zww = Ze0 00 (5.52)
where the heave damping and control sensitivity derivatives are given from momentum theory in terms of the blade loading Ma /Ab, tip speed Й and hover-induced velocity Xo (or thrust coefficient Ct), by the expressions (see Chapter 4)
|
Z 2a0Ab р(Я R)X0 (16X0 + a0s )Ma |
(5.53) |
|
Z 8 a0Abp(QR)2X0 00 _ 3 (16X0 + a0s)Ma |
(5.54) |
A comparison of the vertical acceleration response to a collective step input derived from eqn 5.52 with flight measurements on the DRA research Puma is shown in Fig. 5.10. It can be seen that the quasi-steady model fails to capture some of the detail in the response shape in the short term, although the longer term decay is reasonably well predicted. For low-frequency collective inputs, the quasi-steady model is expected to give fairly high fidelity for handling qualities evaluations, but at moderate to high frequencies, the fidelity will be degraded. In particular, the transient thrust peaks observed in response to sharp collective inputs will be smoothed over. The significance of this effect was first examined in detail by Carpenter and Fridovitch in the
|
Fig. 5.10 Comparison of quasi-steady theory and flight measurement of vertical acceleration response to a step collective pitch input for Puma in hover (Ref. 5.16) |
early 1950s, in the context of the performance characteristics of rotorcraft during jump take-offs (Ref. 5.17). Measurements were made of rotor thrust following the application of sharp and large collective inputs and compared with results predicted by a dynamic rotor coning/inflow nonlinear simulation model. The thrust changes T were modelled by momentum theory, extended to include the unsteady effects on an apparent mass of air mam, defined by the circumscribed sphere of the rotor.
dv; 2 / 2 de
T = mam — + 2n R2p vAvi – w + 3 R — (5.55)
where
4 3
mam = 0.637p—n R3 (5.56)
In eqn 5.55 we have added the effect of aircraft vertical motion w, not included in the test stand constraints in Ref. 5.17; v; is the induced velocity and в the blade flapping. Thrust overshoots of nearly 100% were measured and fairly well predicted by this relatively simple theory, with the inflow build-up, as simulated by eqn 5.55, accounting for a significant proportion of this effect. A rational basis for this form of inflow modelling and the associated azimuthal non-uniformities first appeared in the literature in the early 1970s, largely in the context of the prediction of hub moments (Ref. 5.18), and later with the seminal work of Pitt and Peters in Ref. 5.19. The research work on dynamic inflow by Pitt and Peters, and the further developments by Peters and his co-workers, has already received attention in Chapters 3 and 4 of this book. Here we observe that Ref. 5.19 simulated the rotor loading with a linear combination of polynomial functions that satisfied the rotor blade tip boundary conditions and also satisfied the underlying unsteady potential flow equation. The Carpenter-Fridovitch apparent mass approximation was validated by Ref. 5.19, but a ‘corrected’ and reduced value was proposed as an alternative that better matched the loading conditions inboard on the rotor.
Based on the work of Refs 5.17 and 5.19, an extensive analysis of the flight dynamics of helicopter vertical motion in hover, including the effects of aircraft motion, rotor flapping and inflow, was conducted by Chen and Hindson and reported in Ref. 5.20. Using a linearized form of eqn 5.55 in the form
ST = mamVi + 2nR2 pj2ko(2vi – w) + 3RgJ (5.57)
Chen and Hindson predicted the behaviour of the integrated 3 DoF system and presented comparisons with flight test data measured on a CH-47 helicopter. The large transient thrust overshoots were confirmed and shown to be strong functions of rotor trim conditions and Lock number. The theory in Ref. 5.20 was developed in the context of evaluating the effects of rotor dynamics on the performance of high-gain digital flight control, where dynamic behaviour over a relatively wide frequency range would potentially affect the performance of the control system. One of the observations in Ref. 5.20 was related to the very short-term effect of blade flapping on the fuselage response. Physically, as the lift develops on a rotor blade, the inertial reaction at the hub depends critically on the mass distribution relative to the aerodynamic centre. For the case where the inertial reaction at the hub is downward for an increased lift, the aircraft
normal acceleration to collective pitch transfer function will exhibit a so-called nonminimum phase characteristic; although the eventual response is in the same direction as the input, the initial response is in the opposite direction. One of the consequences of very-high-gain feedback control with such systems is instability. In practice, the gain level necessary to cause concern from this effect is likely to be well outside the range required for control of helicopter vertical motion.
An extensive comparison of the behaviour of the Chen-Hindson model with flight test data was conducted by Houston on the RAE research Puma in the late 1980s and reported in Refs 5.16, 5.21-5.23, and we continue this case study with an exposition of Houston’s research findings. They demonstrate the utility of applied system identification, and also highlight some of the ever-present pitfalls. The linearized derivative equations of motion for the 3 DoF – vertical
 |
The blade Lock number and hover value of inflow are given by the expressions
The expressions for the Z derivatives indicate that the resultant values are determined by the difference between two inertial effects of similar magnitude. Accurate estimates of the mass moments are therefore required to obtain fidelity in the heave DoF. In Houston’s analysis the rotorspeed was assumed to be constant, a valid approximation for short-term response modelling. In Ref. 5.24, results are reported that include the effects of rotorspeed indicating that this variable can be prescribed in the above 3 DoF model with little loss of accuracy.
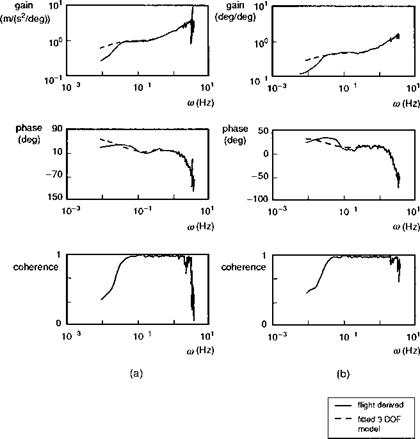
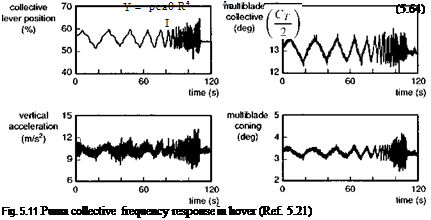
Flight tests were conducted on the Puma to measure the vertical motion and rotor coning in response to a collective frequency sweep. Figure 5.11 shows a sample of the test data with collective lever, rotor coning angle (derived from multi-blade coordinate analysis) andnormal acceleration at the aircraft centre of mass (Ref. 5.21). The test input was applied over a wide frequency range from less than 0.1 Hz out to 3.5 Hz. The test data were converted to the frequency domain using fast Fourier transform techniques for transfer function modelling. Figure 5.12 shows an example of the magnitude, phase and coherence of the acceleration and coning response along with the fitted 3 DoF model, derived from a least-squares fit of magnitude and phase. The coherence function indicates strong linearity up to about 2 Hz with some degradation up to about 3 Hz, above which the coherence collapses. The increasing response magnitude in both heave and coning DoFs is a characteristic of the effects of inflow dynamics. The identified model parameters and modal stability characteristics are shown in Table 5.2, compared with the theoretical predictions for the Puma using the derivative expressions in eqns 5.59-5.62. The percentage spread gives the range of values estimated from six different sets of test data.
Key observations from the comparisons in Table 5.2 are that theory predicts the inflow derivatives reasonably accurately but overestimates the coning derivatives by over 30%; the heave derivatives are typically of opposite sign and the predicted stability
|
Fig. 5.12 Comparison of equivalent system fit and flight measurements of Puma frequency response to collective in hover (Ref. 5.16): (a) vertical acceleration; (b) multiblade coning |
is considerably greater than that estimated from flight. In an attempt to reconcile these differences, Houston examined the effects of a range of gross model ‘corrections’ based on physical reasoning of both aerodynamic and structural effects, but effectively distorting the derivatives in eqns 5.59-5.62. Close examination of Houston’s analysis shows that two of the correction factors effectively compensated for each other, hence resulting in somewhat arbitrary final values. We can proceed along similar lines by noting that each of the derivative groups – inflow, coning and heave – have similar errors in the theoretical predictions, suggesting that improved theoretical predictions may be obtained for each group separately. Considering the inflow derivatives, we can see that the inflow/collective derivative is predicted to within 2% of the flight estimate. This gives confidence in the Carpenter-Fridovitch value of the apparent mass coefficient Co. The other key parameter in eqn 5.59 is the hover value of rotor inflow. An empirical correction factor of 0.7 applied to this value, together with a 2% reduction in Co, leads to the modified theoretical estimates given in Table 5.2, now all within 10% of the flight values. The coning derivatives are a strong function of blade Lock number as shown in eqn 5.60; a 30% reduction in blade Lock number from 9.37 to 6.56, brings
|
Table 5.2 Comparison of theoretical predictions and flight estimates of Puma derivatives and stability characteristics
|
the coning derivatives all within 5% of the flight values, again shown in Table 5.2. The heave derivatives are strongly dependent on the inertia distribution of the rotor blade as already discussed. We can see from eqn 5.61 that the heave due to coning is proportional to the first mass moment M p. Using this simple relation to estimate a corrected value for M p, a 30% reduction from 300 to 200 kg m2 is obtained. The revised values for the heave derivatives are now much closer to the flight estimates as shown in Table 5.2, with the heave damping within 15% and control sensitivity within 4%. The application of model parameter distortion techniques in validation studies gives an indication of the extent of the model deficiencies. The modified rotor parameters can be understood qualitatively in terms of several missing effects – non-uniform inflow, tip and root losses, blade elasticity and unsteady aerodynamics, and also inaccuracies in the estimates of blade structural parameters. For the present example, the correction consistency across the full set of parameters is a good indication that the modifications are physically meaningful.
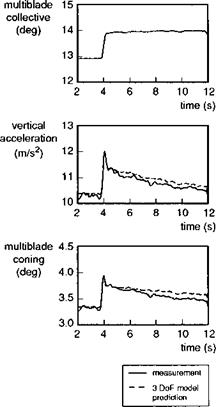
The example does highlight potential problems with parameter identification when measurements are deficient; in the present case, no inflow measurements were available and the coherence of the frequency response functions was seen to decrease sharply above about 3 Hz, which is where the coning mode natural frequency occurs (see Table 5.2). The test data are barely adequate to cover the frequency range of interest in the defined model structure and it is remarkable how well the coning mode characteristics are estimated. In the time domain, the estimated 3 DoF model is now able to reflect much of the detail missed by the quasi-steady model. Figure 5.13 illustrates a comparison of time responses of coning and normal acceleration following a 1° step in collective pitch. The longer term mismatch, appearing after about 5 s, is possibly due to the effects of unmodelled rotorspeed changes. In the short term, the transient flapping and acceleration overshoots are perfectly captured. The significance of these
|
Fig. 5.13 Comparison of 3 DoF estimated model and flight measurements of response to collective for Puma in hover (Ref. 5.16) |
higher order modelling effects has been confirmed more recently in a validation study of the Ames Genhel simulation model with flight test data from a UH-60 helicopter in hovering flight (Ref. 5.25).
The RAE research reported by Houston was motivated by the need for robust criteria for vertical axis handling qualities. At that time, the international effort to develop new handling qualities standards included several contending options. In the event, a simple model structure was adopted for the low-frequency control strategies required in gross bob-up type manoeuvres. This topic is discussed in more detail in Section 6.5. For high-gain feedback control studies however, a 3 DoF model should be used to address the design constraints associated, for example, with very precise height keeping.