Our heavyweight helicopter equal in the world does not have
In Rostov started production of the most load-lifting rotary-wing car The Russian holding «Helicopt[...]

Everything about aircrafts and helicopters. News and events in aviation worldwide. Civil, transportation, military helicopters and airplanes.

Everything about aircrafts and helicopters. News and events in aviation worldwide. Civil, transportation, military helicopters and airplanes.

Everything about aircrafts and helicopters. News and events in aviation worldwide. Civil, transportation, military helicopters and airplanes.

Everything about aircrafts and helicopters. News and events in aviation worldwide. Civil, transportation, military helicopters and airplanes.


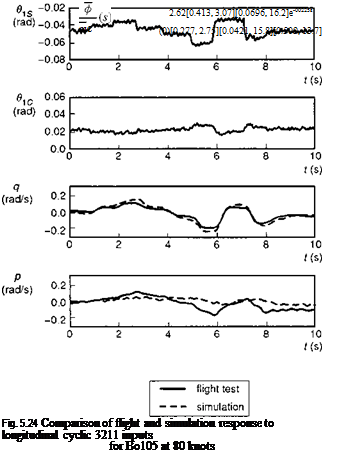
In the preceding subsections, we have seen some of the characteristics of the predicted Helisim behaviour in response to cyclic control. We complete the section with a discussion on correlation with flight test data. Figures 5.23 and 5.24 show a comparison of simulation and flight test for the Bo105 aircraft disturbed from a 80-knot trim condition. The pilot inputs are 3211 multi-steps at the lateral stick (Fig. 5.23) and longitudinal stick (Fig. 5.24); in the figures these control inputs have been transformed to the swash plate cyclics derived from sensors on the blade pitch bearings. The cyclic control signals contain harmonic components characteristic of combining
|
Table 5.3 Variation of longitudinal stability characteristics with tailplane size (Bo105 – 120 knots)
|
|
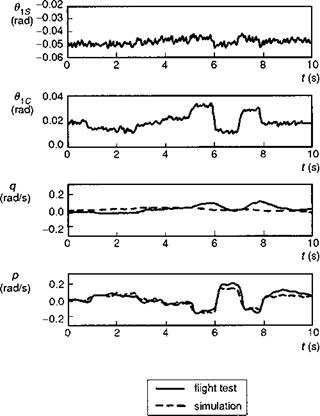
Fig. 5.23 Comparison of flight and simulation response to lateral cyclic 3211 inputs for Bo105 at 80 knots |
together individual blade angles into multi-blade form, when each blade has a slightly different mean position. The magnitude of the control inputs at the rotor is about 1° in the direct axis and about 0.3° in the coupling axis, giving an indication of the swash plate phasing on the Bo105. The comparison of the direct, or on-axis, response is good, with amplitudes somewhat overestimated by simulation. The coupled, or off – axis, response comparisons are much poorer. The swash plate phasing appears to work almost perfectly in cancelling the coupled response in simulation, while the flight data show an appreciable coupling, particularly roll in the longitudinal manoeuvre, a consequence of the low ratio of roll to pitch aircraft moments of inertia. This deficiency of the Level 1 model to capture pitch-roll and roll-pitch cross-coupling appears to be a common feature of current modelling standards and has been attributed to the absence of various rotor modelling sources including a proper representation of dynamic inflow, unsteady aero-dynamics (changing the effective control phasing) and torsional dynamics. Whatever the explanation, and it may well be different in different cases, it does seem that cross-couplings are sensitive to a large number of small effects, e. g., 5° of swash plate phasing can lead to a roll acceleration as much as 40% of the pitch acceleration following a step longitudinal cyclic input.
 |
|
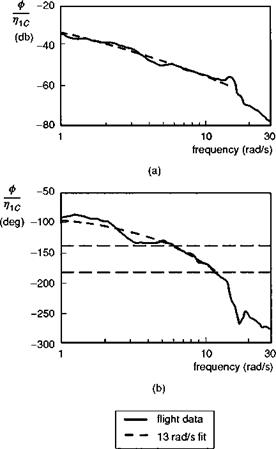
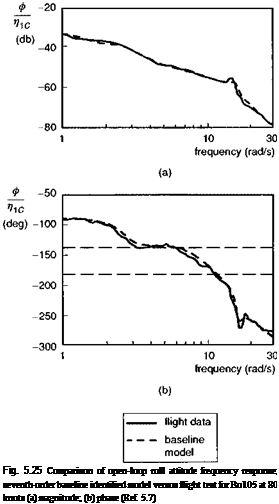
Another topic that has received attention in recent years concerns the adequacy of low-order models in flight dynamics. In Ref. 5.7, Tischler is concerned chiefly with the modelling requirements for designing and analysing the behaviour of automatic flight control systems with high-bandwidth performance. Tischler used the DLR’s AGARD Bo105 test database to explore the fidelity level of different model structures for the roll attitude response (ф) to lateral cyclic stick (mc). Parametric transfer function models were identified from flight data using the frequency sweep test data, covering the range 0.7-30 rad/s. Good fidelity over a modelling frequency range of 2-18 rad/s was judged to be required for performing control law design. The least-squares fits of the baseline seventh-order model and band-limited quasi-steady model are shown in Figs 5.25 and 5.26, respectively. The identified transfer function for the baseline model is given by eqn 5.66, capturing the coupled roll/regressive flap dynamics, the regressive lead-lag dynamics, the Dutch roll mode, roll angle integration (0) and actuator dynamics, the latter modelled as a simple time delay:
 |
where the parentheses signify
[Z, o] ^ s2 + 2fos + o2, (1/T) ^ s + (1/T) (5.67)
The frequencies of the Dutch roll (2.75 rad/s) androll/flap regressing mode (13.7 rad/s) compare well with the corresponding Helisim predictions of 2.64 rad/s and 13.1 rad/s, respectively. A 23-ms actuator lag has also been identified from the flight test data. From Fig. 5.25 we can see that both the amplitude and phase of the frequency response are captured well by the seventh-order baseline model.
The band-limited quasi-steady model shown in Fig. 5.26 is modelled by the much simpler transfer function given in eqn 5.68:
|
Fig. 5.26 Comparison of open-loop roll attitude frequency response; band-limited identified quasi-steady model versus flight test for Bo105 at 80 knots (Ref. 5.7): (a) magnitude; (b) phase |
The response is now modelled by a simple exponential lag, characterized by the damping derivative Lp, supplemented by a pure time delay to account for the unmodelled lags. The frequency range for which this band-limited model is valid was established by Tischler in Ref. 5.7 by identifying the frequency at which the least-squares fit error began to diverge. This occurred at a frequency of about 14 rad/s, above which the estimated parameters became very sensitive to the selected frequency. This sensitivity is usually an indication that the model structure is inappropriate. The estimated roll damping in eqn 5.68 is 14.6/s, compared with the Helisim value of 13.7/s; a total delay of over 80 ms now accounts for both actuation and rotor response. Tischler concludes that the useful frequency range for such quasi-steady (roll and pitch response) models extends almost up to the regressing flap mode. In his work with the AGARD test database, Tischler has demonstrated the power and utility of frequency domain identification and transfer function modelling. Additional work supporting the conclusions of Ref. 5.7 can be found in Refs 5.26 and 5.27.
One of the recurring issues regarding the modelling of roll and pitch response to cyclic pitch concerns the need for inclusion of rotor DoFs. We have addressed this on
many occasions throughout this book, and Tischler’s work shows clearly that the need for rotor modelling depends critically on the application. This topic was the subject of a theoretical review by Hanson in Ref. 5.28, who also discussed the merits of various approximations to the higher order rotor effects and the importance of rotor dynamics in system identification. References 5.29 and 5.30 also report results of frequency domain fitting of flight test data, in this case the pitch response of the DRA Puma to longitudinal cyclic inputs. Once again, the inclusion of an effective time delay was required to obtain sensible estimates of the 6 DoF model parameters – the stability and control derivatives. Without any time delay in the model structure, Ref. 5.29 reports an estimated value of Puma pitch damping (Mq) of -0.353, compared with the Helisim prediction of -0.835. Including an effective time delay in the estimation process results in an identified Mq of -0.823. This result is typical of many reported studies where flight estimates of key physical parameters appear to be unrealistic, simply because the model structure is inappropriate.
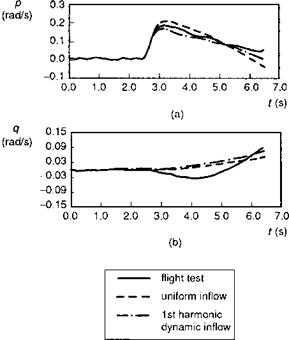
An important modelling element omitted from the forward flight Bo105 and Puma results discussed above is the effect of non-uniform dynamic inflow. We have seen from Chapters 3 and 4 that ‘unsteady’ momentum theory predicts the presence of powerful non-uniform effects in response to the development of aerodynamic hub moments. References 5.25, 5.31 and 5.32 report comparisons of predictions from blade element rotor models with the NASA UH-60 hover test database (Ref. 5.25), where the inflow effects are predicted to be strongest. The results from all three references are in close agreement. Figure 5.27, from Ref. 5.32, illustrates a comparison between flight and the
|
Fig. 5.27 Comparison of flight and simulation response to roll cyclic step, showing contribution of dynamic inflow for UH-60 in hover (Ref. 5.32): (a) roll response; (b) pitch response |
FLIGHTLAB simulation model of the response to a 1-inch step input in lateral cyclic from hover. Dynamic inflow is seen to reduce the peak roll rate response in the first half second by about 25%. The inflow effects do not appear, however, to improve the cross-coupling predictions.