Our heavyweight helicopter equal in the world does not have
In Rostov started production of the most load-lifting rotary-wing car The Russian holding «Helicopt[...]

Everything about aircrafts and helicopters. News and events in aviation worldwide. Civil, transportation, military helicopters and airplanes.

Everything about aircrafts and helicopters. News and events in aviation worldwide. Civil, transportation, military helicopters and airplanes.

Everything about aircrafts and helicopters. News and events in aviation worldwide. Civil, transportation, military helicopters and airplanes.

Everything about aircrafts and helicopters. News and events in aviation worldwide. Civil, transportation, military helicopters and airplanes.


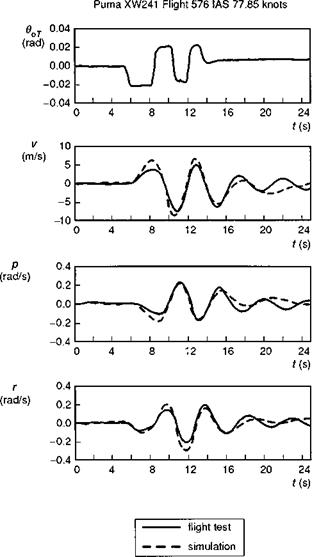
In this section we examine the characteristics of the coupled yaw/roll response to pedal control inputs in forward flight; attention will be focused on comparison with test data from the DRA Puma helicopter. Yaw/roll motions are coupled through a variety of different physical mechanisms. Even at the hover, any vertical offset of the tail rotor from the aircraft centre of gravity will give rise to a rolling moment from tail rotor collective. As forward speed increases, the forces and moments reflected in the various coupled stability derivatives, e. g., dihedral Lv, adverse yaw Np, combine to form the character of the Dutch roll mode discussed in Chapter 4. Figure 5.28, taken from Ref. 5.33, illustrates the comparison of yaw, roll and sideslip responses from flight and Helisim following a 3211 multi-step pedal control input. It can be seen that the simulation overpredicts the initial response in all 3 DoFs and also appears to overpredict the damping and period of the free oscillation in the longer term. In Chapter 4 we examined approximations to this mode, concluding that for both the Puma and Bo105, a 3 DoF yaw/roll/sideslip model was necessary but that, provided the sideways motion was small compared with sideslip, a second-order approximation was adequate; with this approximation, the stability is then characterized by the roots of the
(5.72)
If the ‘true’ values of the stability and control derivatives were known, then this kind of approximation may be able to help to explain where the modelling deficiencies lie. Estimates of the Puma derivatives derived by the DLR using the test data in Fig. 5.28 are shown in Table 5.4, along with Dutch roll eigenvalues for three different cases – the fully coupled 6 DoF motion, lateral subset and the approximation given by eqn 5.69. It can be seen that the latter accounts for about 80% of the damping and more than 90% of the frequency for the flight results (compare Л(1) with Л(3)) and therefore serves as a representative model of Dutch roll motion; note that theory overpredicts the damping by more than 60% and underpredicts the frequency by 20%.
|
Fig. 5.28 Response to pedal 3211 input – comparison of flight and simulation for Puma at 80 knots (Ref. 5.33) |
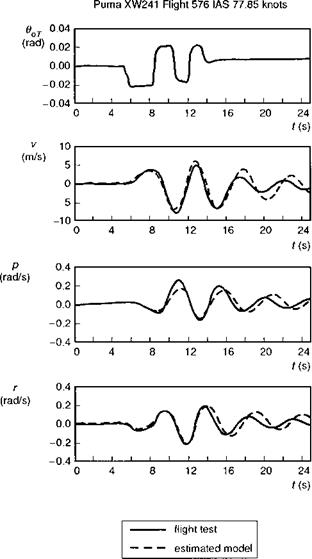
Figure 5.29 shows a comparison between flight measurements and the 3 DoF second-order approximation using the flight-estimated derivatives in Table 5.4. The comparison is noticeably better in the short term, but the damping appears now to be slightly underpredicted, consistent with the comparison already noted between Л(1) with Л(3). Looking more closely at the derivatives in Table 5.4, we see that the most striking mismatch between flight and theory is the overprediction of the yaw damping and control sensitivity by about 70% and the underprediction of the roll damping and dihedral effects by 30 and 20%, respectively. The Helisim prediction of adverse yaw
|
Derivative |
Flight test – DLR |
Helisim |
|
Yv |
-0.135 (0.0019) |
-0.125 |
|
Lv |
-0.066 (0.0012) |
-0.055 |
|
Nv |
0.027 (0.0002) |
0.0216 |
|
Lp |
-2.527 (0.0534) |
-1.677 |
|
Np |
-0.395 (0.0092) |
-0.174 |
|
Lr |
-0.259 (0.0343) |
0.142 |
|
Nr |
-0.362 (0.0065) |
-0.57 |
|
Llat |
-0.051 (0.0012) |
-0.043 |
|
Nlat |
-0.008 (0.0002) |
-0.0047 |
|
Lped |
0.011 (0.0007) |
0.0109 |
|
Nped |
-0.022 (0.0001) |
-0.0436 |
|
Tlat |
0.125 |
0.0 |
|
A(1) |
-0.104 ± 1.37i |
-0.163 ± 1.017i |
|
a(2) |
-0.089 ± 1.27i |
-0.166 ± 1.08i |
|
2£^ |
0.1674 |
0.390 |
|
ОУ2 |
1.842 |
1.417 |
|
A(3) |
-0.081 ± 1.34i |
-0.199 ± 1.199i |
|
Table 5.4 Dutch roll oscillation characteristics |
|
A(1) Dutch roll (fully coupled). A(2) Dutch roll (lateral subset). A(3) Dutch roll (second-order roll/yaw/sideslip) approximation. Numbers in parentheses give the standard deviation of the estimated derivatives. |
Np is less than half the value estimated from the flight data. A simple adjustment to the yaw and roll moments of inertia, albeit by a significant amount, would bring the theoretical predictions of damping and control sensitivity much closer to the flight estimates. Similarly, the product of inertia Ixz has a direct effect on the adverse yaw. Moments of inertia are notoriously difficult to estimate and even more difficult to measure (particularly roll and yaw), and errors in the values used in the simulation model of as much as 30% are possible. However, the larger discrepancies in the yaw axis are unlikely to be due solely to incorrect configuration data. The absence of any interactional aerodynamics between the main rotor wake/fuselage/empennage and tail rotor is likely to be the cause of some of the model deficiency. Typical effects unmodelled in the Level 1 standard described in Chapter 3 include reductions in the dynamic pressure in the rotor/fuselage wake at the empennage/tail rotor and sidewash effects giving rise to effective v acceleration derivatives (akin to Mw from the horizontal tailplane).
The approximation for the Dutch roll damping given by eqn 5.70 can be further reduced to expose effective damping derivatives in yaw and sideslip:
In both cases the additional effect due to rolling motion is destabilizing, with the adverse yaw effect reducing the effective yaw damping by half. The adverse yaw is almost entirely a result of the high value of the product of inertia Ixz, coupling the
|
Fig. 5.29 Response to pedal 3211 input – comparison of flight and identified model – Puma at 80 knots (Ref. 5.33) |
roll damping into the yaw motion. The damping decrements due to rolling manifest themselves as a moment (eqn 5.73) and a force (eqn 5.74) reinforcing the motion at the effective centre of the oscillation. This interpretation is possible because of the closely coupled nature of the motion. The yaw, roll and sideslip motions are locked in a tight phase relationship in the Puma Dutch roll – sideslip leading yaw rate by 90° and roll rate lagging behind yaw rate by 180°. Hence, as the aircraft nose swings to starboard with a positive yaw rate, the aircraft is also rolling to port (induced by the dihedral effect from the positive sideslip) thus generating an adverse yaw Np in the same direction as the yaw rate.
 |
||
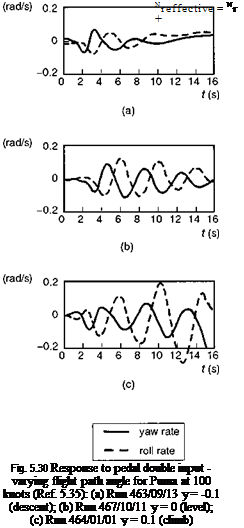
The powerful effect of the damping decrement from adverse yaw can be even more vividly illustrated with an example taken from Refs 5.34 and 5.35. Figure 5.30 presents a selection of Puma flight results comparing the roll and yaw response in the Dutch roll mode at 100 knots in descending, level and climbing flight; the control input is a pedal doublet in all three cases. It can be seen that the stability of the oscillation is affected dramatically by the flight path angle. In descent, the motion has virtually decayed after about 10 s. In the same time frame in climbing flight, the pilot is about to intervene to inhibit an apparently violent departure. A noticeable feature of the response in the three conditions is the changing ratio of roll to yaw. Reference 5.35 discusses this issue and points out that when the roll and yaw motions are approximately 180° out of phase, the effective damping can be written in the form
|
|
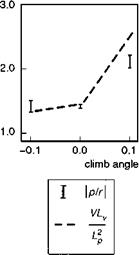
Fig. 5.31 Variation of Dutch roll oscillation roll/yaw ratio with flight path angle (Ref. 5.35)
Figure 5.31 compares the variation of the ratio p/r in the three conditions with the approximation in eqn 5.73 (V Lv/Lp), providing additional validation of this relatively simple approximation for a complex mode. The ratio of roll to yaw motion in the Dutch roll mode was discussed at the end of Chapter 4 in the context of the SA330 Puma. There it was shown how small perturbation linear analysis predicted Dutch roll instability at about 120 knots. When larger sideslip perturbations were used to calculate the derivatives however, the nonlinearity in the yawing moment with sideslip led to a much larger value for the weathercock stability and a stable Dutch roll (see Fig. 4.28). This strong nonlinearity leads to the development of a limit cycle in the Puma at high speed. Figure 5.32 compares the Puma Dutch roll response for the small perturbation linear Helisim with the full nonlinear Helisim, following a 5 m/s initial disturbance in sideslip from a trim condition of 140 knots. The linear model predicts a rapidly growing unstable motion with roll rates of more than 70°/s developing after only three oscillation cycles. The nonlinear response, which is representative of flight behaviour, indicates a limit cycle with the oscillation sustained at roll and yaw rate levels of about 5°/s and 10°/s, respectively; the sideslip excursions are about 10°, a result consistent with the stability change in Fig. 4.28 lying between sideslip perturbations of 5° and 15°.
The Dutch roll is often described as a ‘nuisance’ mode, in that its presence confers nothing useful to the response to pedal or lateral cyclic controls. The Dutch roll mode also tends to become rather easily excited by main rotor collective and longitudinal cyclic control inputs, on account of the rotor/engine torque reactions on the fuselage. In Chapter 6, criteria for the requirements on Dutch roll damping and frequency are presented and it is apparent that most helicopters naturally lie in the unsatisfactory area, largely due to the relatively high value for the ratio of dihedral to weathercock stability. Some form of yaw axis artificial stability is therefore quite a common feature of helicopters required to fly in poor weather or where the pilot is required to fly with divided attention.