Our heavyweight helicopter equal in the world does not have
In Rostov started production of the most load-lifting rotary-wing car The Russian holding «Helicopt[...]

Everything about aircrafts and helicopters. News and events in aviation worldwide. Civil, transportation, military helicopters and airplanes.

Everything about aircrafts and helicopters. News and events in aviation worldwide. Civil, transportation, military helicopters and airplanes.

Everything about aircrafts and helicopters. News and events in aviation worldwide. Civil, transportation, military helicopters and airplanes.

Everything about aircrafts and helicopters. News and events in aviation worldwide. Civil, transportation, military helicopters and airplanes.


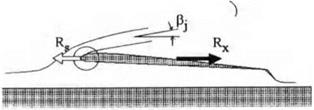
The PAR model based on a reentrant jet scheme does not account for the suction force at the leading edge. At the same time experiments show that the incoming jet has a tendency of enveloping a rounded leading edge. For a relatively thin jet spilling over the edge, this phenomenon can be identified with the Coanda effect. Gallington [155] and Krause et al. [156] remark that PAR theory,[47] on average, underestimates the efficiency of power augmentation predicted by experiments, because it completely neglects the Coanda effect. In this connection, an attempt can be made to develop a PAR flow scheme which would incorporate a manifestation of the Coanda effect. One model of this type is proposed herein for further discussion and evaluation. The main idea of this model is that, whereas the angle /3j of the overspilling jet with respect to the x axis is governed by the momentum law, the detachment of the jet takes place tangentially to a rounded leading edge at a certain point with an abscissa Xsep (see Fig. 8.17). In this case, the suction force is realized only on the “wetted” part of the surface of the leading edge.
To calculate the suction force acting upon the “wetted” part of the rounded leading edge, we consider a local flow in the immediate vicinity of the leading edge with a rounded nose. It can be shown that for a wing with
|
|
|
Fig. 8.17. The definition of a PAR flow model with a partial realization of suction force (the Coanda effect). |
analytical cross sections at 2 = const,[48] the rounded leading edge at distances of the order of its radius of curvature pe is approximated by a semi-infinite parabolic cylinder.
As derived in Rozhdestvensky [44], the pressure coefficient рг on an osculating parabola has the following quasi-steady form:[49]
(8Л64)
where parameters U and U2 characterize the velocities of the local incoming and the circulatory flows around the rounded leading edge, thus determining the position of the stagnation point. These parameters have to be determined by matching with an appropriate outer flow field; X = xe/pe is the stretched local abscissa and xe is the unstretched local abscissa.
It should be noted that for an analytical wing section, pe = 0(6%), where 5t is relative thickness of the wing section. On the other hand, within the assumptions of the theory of the extreme ground effect adopted in this book, the relative thickness of a wing section is of the order of the relative ground clearance 0(h); see (2.1). Therefore, for analytical foils, the radius of curvature is assumed to be of the order of 0(h2).
We calculate first the suction force coefficient when the flow past the osculating parabola is not separated. Representing the pressure coefficient on the surface of the wing section near the rounded leading edge as
![]() XU% 2Ui U2/X Щ
XU% 2Ui U2/X Щ
X + 1/2T X + 1/2 X + 1/2’
we can observe that the two first terms of (8.165) are associated with symmetrical flow around the parabola and therefore make no contribution to the suction force. The third and the fourth terms are due to the circulatory flow around the edge.
Hence these terms have to be taken into account when calculating the suction force. It is easy to see that the third term of (8.165) changes sign, when passing from a point on the upper branch of the parabola to a mirror reflection of this point on the lower branch of the parabola. This means that the sum of the longitudinal pressure forces due to the third term, acting upon parabola, should be equal to zero. In connection with these conclusions, the calculation of the suction force can be reduced to the integration of just the fourth term of (8.165), i. e.,
where ds is an arc element. Taking into account the equation of a parabola У = ±ріел/2Х, we obtain
![]() 4C/|pie arctan v2X — ЪкЩрхе,
4C/|pie arctan v2X — ЪкЩрхе,
where Y = y/pe. To find U2 we match the asymptotic expansions for the velocity on the foil in three characteristic regions: the immediate vicinity
of the leading edge of the order of pie = 0(/i2), the larger vicinity De of the order of 0(h) of the leading edge, and the channel flow D under the wing. In Dh2 expression for the velocity on a parabola, corresponding to (8.165), is
In De by using the formula (2.39) of Section 2, the flow velocity of the relative motion in points on the leading edge can be written as
^ = _[/(i) + /loa1^e-+O(h20), (8.169)
where (pae is determined by formula (2.43). Matching (8.169) with the channel flow velocity v(x, t) and accounting for the asymptotics of (2.47), leads to the following expression for a\
ai = h*(l, t)[U(t)+v(l, t). (8.170)
Now, we can write the final expression for the suction force coefficient, taking into account (8.167) and (8.171), as
![]() h*{l, t)[U(t) +v(l, t) l2
h*{l, t)[U(t) +v(l, t) l2
2tt
where hi = hi(0,z, t)/h. It can be seen that the expression for the suction force coefficient, obtained by direct integration of pressure forces, acting on a parabolic leading edge, coincides with that determined by using the strength of the square root singularity of the perturbed velocity at the leading edge of an infinitely thin wing section.
Later on, it is assumed that the suction force is realized only on the “wetted” part of the osculating parabola. Then the suction force fraction ks (that is, the degree of realization of the suction force) can be calculated by direct integration of the local pressure coefficient p given by formula (8.165), along the corresponding “wetted” part of the parabolic edge. This integration leads to the following result:
ks = -(1 + – arctan ^2XsepJ, (8.173)
where ks = CsPartial/Cs is the suction force fraction, ranging from zero to unity. At the same time, the angle /3*ep is calculated with use of the equation of a parabola, i. e, Y = y/2Xsep as
Asep = arctan. ^ . (8.174)
J y/2Xsep V ‘
Comparing the last two equations, we can see that the angle of detachment of the jet from the contour of the parabola can be expressed by the suction force fraction by using the following expression:
![]() /5fep = 7Г(1 – Ks)-
/5fep = 7Г(1 – Ks)-
Thus, a PAR flow scheme can be composed of one model parameter (the suction force fraction fts)[50] and accounting for Coanda effect. To determine the PAR efficiency diagrams for this case, we can write the corresponding momentum equation as
 – Ct – – Cx – C? artial
Ct = x = 25j = 2* + – p————— ^
h 1 — cos p.
Employing the suction force fraction k8, we can rewrite the previous equation in the following way:
|
|
Supplementing this equation with expressions for the PAR efficiency if par h and the thrust recovery fraction Tr, in the simplest case of zero gap under the endplates, we obtain
![]() ^ Су, і-Щ
^ Су, і-Щ
Kpar h = —h = —=—,
m , Cx-Cs л (1 – KS)CX л (1-KS){1-Si)2
Tr = 1————- cr-1-—^— = 1————————————– 7T.———
where Ct can be calculated with help of (8.169).
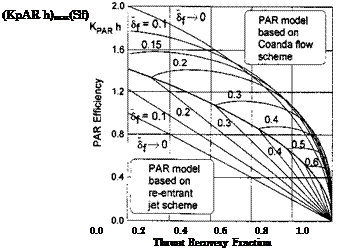
We can use the relationships (8.169-8.171) that feature the parameter 1 > ks > 0 to plot PAR efficiency diagrams accounting for the Coanda effect; see Fig. 8.18.
As seen from this figure where both (reentrant jet flow and Coanda flow) types of PAR efficiency envelopes are shown simultaneously, the overall prediction accounting for the Coanda effect gives higher magnitudes of if par and somewhat higher magnitudes of the thrust recovery fraction for the same combination of and Sf. We can also see from the observation of Fig. 8.18 that for certain combinations of the thrust coefficient and the rear flap setting, the efficiency of power augmentation with the Coanda effect reaches its maximum value. As follows from (8.179), at a fixed flap setting 5f, the minimal magnitude of the thrust coefficient is attained at fcs = 0.258 and can be found from the expression
CtmIn №) = 2S{ + 0.439 (1 – Sf)2. (8.180)
 |
The corresponding thrust recovery fraction and the (maximal) PAR efficiency depend on and can be calculated by the formulas
Ct
Fig. 8.18. Comparison of PAR efficiency envelopes based on two flow models : a reentrant jet model and the Coanda flow model with partial realization of the suction force.
|
Table 8.1 PAR efficiency and thrust recovery for optimal settings of a rear flap
|
Table 8.1 presents the adjustment magnitudes of the rear flap settings and the (minimal) thrust coefficents, as well as the corresponding magnitudes of the PAR efficiency and the thrust recovery fraction.