
Our heavyweight helicopter equal in the world does not have
In Rostov started production of the most load-lifting rotary-wing car The Russian holding «Helicopt[...]

Everything about aircrafts and helicopters. News and events in aviation worldwide. Civil, transportation, military helicopters and airplanes.

Everything about aircrafts and helicopters. News and events in aviation worldwide. Civil, transportation, military helicopters and airplanes.

Everything about aircrafts and helicopters. News and events in aviation worldwide. Civil, transportation, military helicopters and airplanes.

Everything about aircrafts and helicopters. News and events in aviation worldwide. Civil, transportation, military helicopters and airplanes.


 |
|
Figure 15.6 shows the mean velocity profile of a low-speed two-dimensional turbulent jet. According to White (1991),agood analytical representation of the velocity profile is
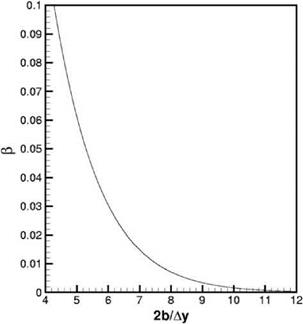
Figure 15.7. Spatial resolution curve for two-dimensional turbulent jets.
where b is the half-width of the jet. It is easy to show that the Fourier transform of the function on the right side of Eq. (15.3) is
 |
|
and that
where a = 0.95 /Ay. Figure 15.7 is a plot of в as a function of 2b/Ay. It is the numerical solution of Eq. (15.9). Here again, the 7-point stencil DRP scheme is assumed to be the computational method.


