Our heavyweight helicopter equal in the world does not have
In Rostov started production of the most load-lifting rotary-wing car The Russian holding «Helicopt[...]

Everything about aircrafts and helicopters. News and events in aviation worldwide. Civil, transportation, military helicopters and airplanes.

Everything about aircrafts and helicopters. News and events in aviation worldwide. Civil, transportation, military helicopters and airplanes.

Everything about aircrafts and helicopters. News and events in aviation worldwide. Civil, transportation, military helicopters and airplanes.

Everything about aircrafts and helicopters. News and events in aviation worldwide. Civil, transportation, military helicopters and airplanes.


The two overriding considerations for both civil and military rotorcraft operations are to achieve good performance at low workload. Like stability and agility, these dual aims can often conflict. Typically, military operations are characterized by achieving performance goals as a priority, while civil operations are biased towards safety. In any mission or operational situation, the pilot will make the tactical decision of which to favour but the tension between performance and safety is ever present. In considering the contribution of flying qualities to effectiveness and safety, this tension forms a centrepoint of the discussion. The HQR scale measures pilot workload required to achieve a defined performance, hence giving an indication of the safety margins available. HQRs are explicit measures of pilot workload and implicit measures of aircraft stability and control characteristics. However, there appears to have been very little work done on the operational benefits using the HQR approach. For example, how much more mission effective is a Level 1 than a Level 2 aircraft when, for example, the pilot is stressed due to poor weather or the need for rapid action? Generally, and in objective terms, the value of good flying qualities should be reflected in three principal areas:
(1) productivity – how many missions or sorties can be accomplished;
(2) performance – how well can each sortie be accomplished;
(3) attrition – how many losses can be expected.
We will examine these issues within the framework of a probabilistic approach along the lines first put forward in Refs 7.44 and 7.45 and later developed in Ref. 7.25. The basic notion is that flying qualities deficiencies increase the chance of pilot error, hence can lead to accidents, incidents or MTE failures. This is a controversial concept. A significant proportion of accidents and incidents are attributed to human error, but there is often a counter-argument put forward that suggests some deficiency in the aircraft’s handling qualities. In this context, Refs 7.44 and 7.45 considered the benefits to flight safety using the Cooper-Harper pilot rating scale as a metric (Fig. 7.2). These references considered the pilot as a vital system component who can fail (i. e., be stressed to failure) in an operational context, just like any mechanical or electrical component. Pilot failure can be manifested in MTE failure, corresponding to HQRs > 6.5 or, in the extreme, a loss of control, corresponding to a HQR > 9.5. We have already discussed on several occasions the variability of flying qualities with both internal attributes and external factors. In the life of an aircraft, there is a finite probability that ‘virtual’ ratings across the whole range will be experienced. We refer to these as virtual ratings because in reality they are not awarded; one can imagine, however, an HQR meter, sampling workload and pilot-set performance targets. For every distinguishable MTE that is flown, the HQR meter takes a recording. Examples might be as given in Table 7.6.
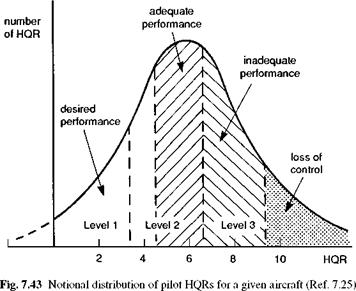
The next assumption we make is that over a long period of time the distribution of the virtual ratings takes a normal form as shown conceptually in Fig. 7.43. The regions of desired, adequate and inadequate performance are clearly identified. The desired and adequate regions can be considered as reflecting varying degrees of MTE success, while the inadequate level corresponds to MTE failure. Effectively, each mission is composed of a number of contiguous MTEs, each having its own virtual HQR. If a particular MTE
|
Table 7.6 Possible HQRs for same aircraft in different MTEs
|
|
|
was assigned a Level 3 rating, then the pilot would have to either try again or give up on that particular MTE. Loss of control has obvious ramifications on mission success. For certain types of operation, loss of control will almost certainly result in a crash. The probability of obtaining a rating in one of the regions is proportional to the area under the distribution in that region. Note that, as discussed in Ref. 7.25, we include ratings greater than 10 and less than 1 in the analysis. The rationale is that there are especially bad and good aircraft or situations, whose qualities correspond to ratings like 13 or -2. However, the scale enforces recording them as 10 or 1.
Note too that the scatter produces, even with a good mean rating, a large probability of merely adequate performance and even a finite probability of total loss of control and, in some cases, a crash. We have said elsewhere in this book that flying qualities are determined by the synergy between internal attributes and external influences. It follows then that sources of scatter originate both internally and externally. Internals include divided attention, stress and fatigue, pilot skill and experience. Externals include atmospheric disturbances, changing operational requirements and timelines, threats, etc. The flying qualities community has done much to minimize scatter by careful
|
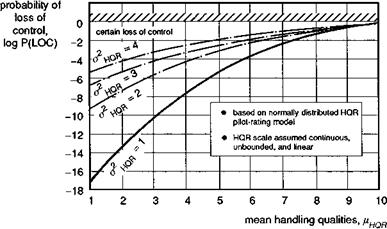
Fig. 7.44 Relationship between mean HQR and P(LOC) (Ref. 7.44) |
attention to experimental protocol (Ref. 7.6), but here we emphasize that in operational environments, the effective pilot rating scatter is omnipresent.
With the assumed normal distribution of ratings, the probability of control loss, Ploc, can be calculated for various mean ratings and dispersions; these are plotted in Fig. 7.44. Ploc is the probability of obtaining a rating greater or worse than 9.5, which in turn is simply proportional to the area under the distribution to the right of the 9.5 rating. Thus, the probability of loss of control (i. e., flight failure) due to flying qualities deficiencies can be estimated. For the cases studied in Refs 7.44 and 7.45 and depicted in Fig. 7.44, operating a Level 1 aircraft can be seen to reduce the probability of a loss of control by an order of magnitude relative to a Level 2 aircraft. Interestingly, the Ploc of an aircraft with a mean HQR of 3.5, on the Level 1/2 boundary, is 1 in 109, the value quoted for flight critical component reliability in civil transports.
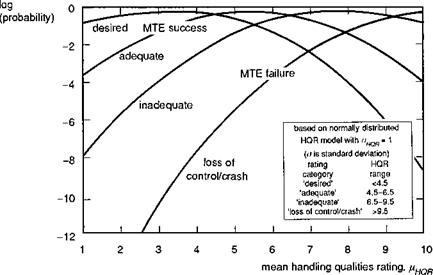
If we now consider the same approach applied to the full extent of the rating scale, the effectiveness in terms of MTE success or failure can be estimated. Figure 7.45 shows the probability of obtaining ratings in the various regions when the standard deviation of the ratings is unity. This curve has some interesting characteristics. First, the intersections of the lines fall on the ratings 4.5, 6.5 and 9.5, as expected. Also it turns out that for a mean rating of 7, the probability of achieving inadequate performance is, of course, high, and we can also see that the probability of achieving desired performance is about the same as that for loss of control – about one in a hundred. Improving the mean HQR to 2 lowers the probability of loss to 10-13 (for our purposes zero) and ensures that performance is mostly at desired levels. Degrading the mean rating from 2 to 5 will increase the chances of mission failure by three orders of magnitude.
If we consider the above results applying to a fleet of 100 of the same aircraft type, some interesting statistics begin to emerge. We assume that each aircraft in the fleet flies one mission per day, and each mission comprises 20 MTEs. Over a 20-year period the fleet will fly about 15 x 106 MTEs. If we assume that loss of control equates to loss of an aircraft, then Fig. 7.45 provides information on the expected losses due to flying qualities deficiencies over the life of the fleet. For an aircraft with a mean
|
Fig. 7.45 Relationship between mean HQR and probability of mission success, failure and loss of control (Ref. 7.25) |
HQR of 5, the fleet can expect to lose one aircraft per year (i. e., 20% of the fleet over the fleet life). With a mean HQR of 3, no aircraft will be lost from poor handling qualities during the life of the fleet. It is likely that most operational aircraft in service today do not have mean HQRs in the Level 1 region, because of limited stability and control augmentation, the poor cueing of flight envelope limits and the degraded flying qualities associated with failures and in emergency situations. It would be inappropriate to discuss data on particular types in this book, but these preliminary results give some cause for concern; on the other hand, they also offer a methodology for quantifying the value of good flying qualities.
We describe these results as preliminary because we assume that there is a rational continuum between desired performance, adequate performance and control loss. For example, desired and adequate performance may be represented by discrete touchdown zones/velocities on the back of a ship, and loss of control might be represented by, say, landing on the edge of the ship or hanger door. On a smaller ship (or bigger helicopter, for example), the desired and adequate zones may be the same size, which puts the deck-edge closer to the adequate boundary, or represent a similar fraction of the deck size, hence tightening up the whole continuum. This raises some fundamental questions about the underlying linearity of the scale. Assuming these issues can be resolved satisfactorily, there is also the question of how to establish the mean rating for a particular aircraft type. This could, in principle, be estimated from a series of tests as outlined in Chapters 6 and 7 of this book, but data in the most degraded conditions in which the aircraft is expected to operate will need to be captured.
Though these questions remain, pilot rating and mission success or failure are powerfully related through the preliminary data in Fig. 7.45. Put simply, flying qualities alone can determine whether operational agility and flight safety are flawless or whether control is lost. Flying qualities are at the heart of the subject of Flight Dynamics and, through a holistic approach, this book has attempted to establish the intimate connection between the theoretical foundations of modelling and handling criteria and the operational world of flight safety and performance.
Nowhere is safety more prominent an issue as when handling qualities degrade, as a result of loss of visual cues, loss of some flight control function or when the aircraft is exposed to the effect of severe atmospheric disturbances; this is the subject of the last chapter of this book.
|