Our heavyweight helicopter equal in the world does not have
In Rostov started production of the most load-lifting rotary-wing car The Russian holding «Helicopt[...]

Everything about aircrafts and helicopters. News and events in aviation worldwide. Civil, transportation, military helicopters and airplanes.

Everything about aircrafts and helicopters. News and events in aviation worldwide. Civil, transportation, military helicopters and airplanes.

Everything about aircrafts and helicopters. News and events in aviation worldwide. Civil, transportation, military helicopters and airplanes.

Everything about aircrafts and helicopters. News and events in aviation worldwide. Civil, transportation, military helicopters and airplanes.


In Section 15.4.3, it was demonstrated that the energy source responsible for the generation of airfoil tones is near-wake instability. These are antisymmetric instabilities. However, the flow is at a low subsonic Mach number. It is known that low subsonic flow instabilities are, by themselves, not strong or efficient noise radiators. In this section, the results of a study of the space-time data of the numerical simulations are reported. The objective of the study is to identify the tone generation processes. To facilitate this effort, the fluctuating pressure field p’, defined by,
p’ = p – p, (15.65)
where p is the time-averaged pressure is first computed. Positive p’ indicates compression. Negative p corresponds to rarefactions of the acoustic disturbances. Of special interest is the contour p’ = 0. Following Tam and Ju (2012) this contour will be used as an indicator of the acoustic wave front. The propagation of this contour from the airfoil wake to the far field is tracked. The creation and spreading of the wave front provides the clues needed for identifying the tone generation processes.
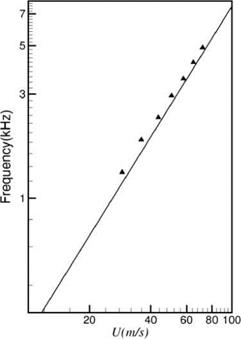
Figure 15.44. Comparison between DNS tone frequencies (A) and most amplified instability wave frequencies (straight line). Airfoil #1.
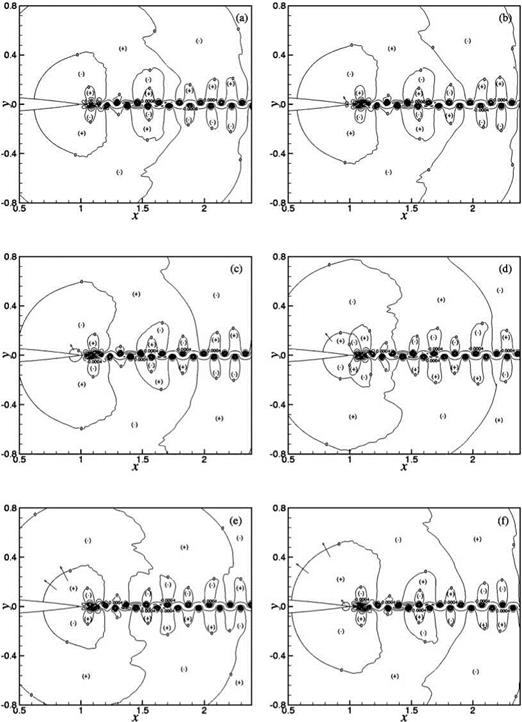
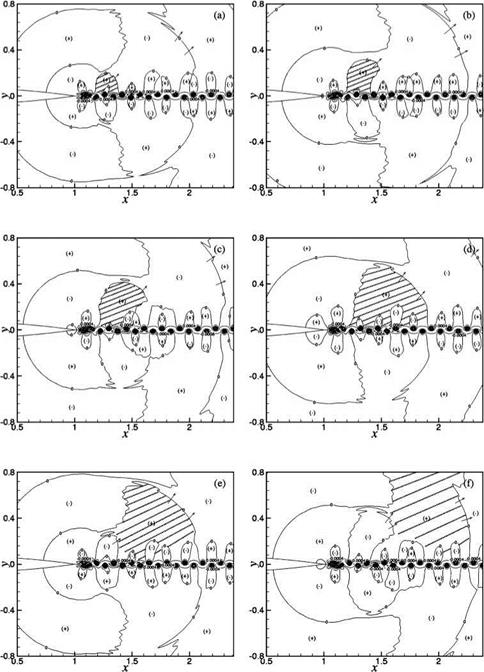
 A study of the space-time data reveals that the tone generation processes are rather complex. There is a dominant mechanism involving the interaction between the near-wake oscillations driven by wake instability and the airfoil trailing edge. However, there are also secondary mechanisms arising from flow and vortex adjustments in the near wake. Details of these tone generation processes can be understood by following the evolution of the wave front contour p = 0 in time. Figure 15.45 illustrates the dominant tone generation process in space and time. Airfoil #2 (2 percent truncation) at Re = 4 x 10⁵ is used in this simulation. Figure 15.45a may be regarded as the beginning of a tone generation cycle. The trailing edge of the airfoil is shown on the left center of the figure. The flow is from left to right. Thus, the wake, defined by two p’ = 0 contours, lies to the right of the airfoil. The near wake is highly unstable. The instability causes the wake to oscillate as can easily be seen in this figure. The wake is flanked by two rows of vortices in a staggered pattern. The spinning motion of the vortices creates a low-pressure region inside the vortices. Hence, all the vortices are located in the p < 0 regions. These regions are labeled by a (-) symbol. Regions with p > 0 are labeled by a (+) symbol. Shown in Figure 15.45a are wave front contours of p = 0. The near-wake instability is antisymmetric with respect to the x-axis. This leads to an antisymmetric pressure field as shown in Figures 15.45a-15.45h. The pressure field shown in Figure 15.45a corresponds to the beginning of the downward motion of the wake in the region just downstream of the airfoil trailing edge. Since the airfoil is stationary, the downward movement of the near wake leads to the creation of a high-pressure region on the top side of the airfoil trailing edge and a corresponding low-pressure region on the mirror image bottom side. This is shown as two small circular regions right at the trailing edge of the airfoil in Figure 15.45b. A small arrow is inserted there to indicate the direction
|
Figure 15.45A. Instantaneous positions of contour p’ = 0 in the proximity of the near wake for Airfoil #2 at Re = 4 x 10⁵. (a) t = 36.367T, (b) t = 36.402T, (c) t = 36.526T, (d) t = 36.69T, (e) t = 36.789T, (f) t = 36.974T; T = period. |
|
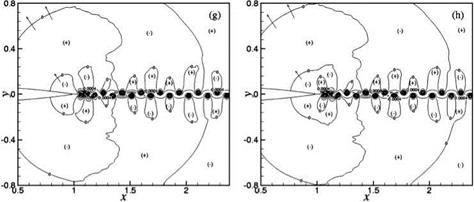
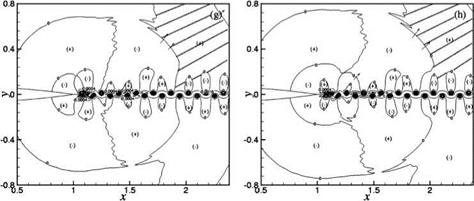
Figure 15.45B. Instantaneous positions of contour p’ = 0 in the proximity of the near wake for Airfoil #2 at Re= 4 x 10⁵. (g) t = 37.183T, (h) t = 37.209T; T = period. |
of motion of the wave front. The high – and low-pressure regions grow rapidly in time as shown in Figures 15.45c-15.45e. The time difference between Figure 15.45a and Figure 15.45e is nearly half a cycle. Hence, Figure 15.45e to Figure 15.45h repeats a similar sequence of wave front motion, but with positive and negative fluctuating pressure fields interchanged. Each wave front contour in each half-cycle shows its creation at the trailing edge of the airfoil, its expansion in space and time, and its propagation to the far field in all directions.
The dominant tone generation process is observed in all the simulations that have been carried out. In some cases, other less dominant tone generation processes have been observed. These secondary processes may reinforce the primary process or may be important only in certain directions of radiation. By and large, the secondary mechanisms are related to the adjustment of the flow from boundary layer type to free shear wake flow and also the alignment of the wake vortices from their creation to that of a vortex street.
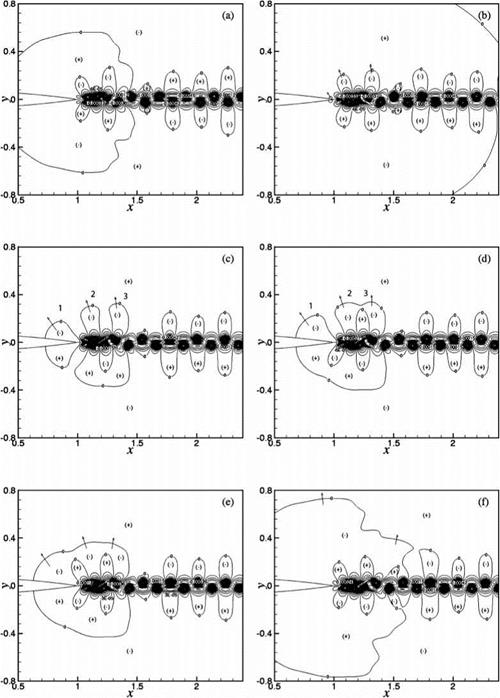
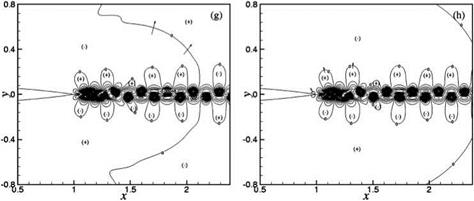
Figure 15.46 illustrates a secondary tone generation process. Figure 15.46a may be taken as the distribution of the wave front contours at the beginning of a cycle for Airfoil #2 at Reynolds number = 2 x 10⁵. At the instant corresponding to Figure 15.46a, the near wake begins to move upward. This creates a high-pressure region on the bottom side of the airfoil trailing edge and, at the same time, a low-pressure region on the mirror image location on the top side. This is shown in Figure 15.46b. Figure 15.46c shows the expansion of the high (bottom)- and low (top)-pressure regions near the trailing edge. At the same time, this figure also shows the expansion of the next two loops; negative-pressure regions on the top half of the figure and positive-pressure regions in the lower half. The three negative-pressure regions that have expanded are labeled as 1, 2, and 3 in this figure. The locations of loops 2 and 3 coincide with the region where the wake oscillations are strongest with largest lateral displacements (see Figure 15.31). However, the wake has not rolled up to form vortices yet. Thus, this secondary tone generation process does not involve the formation of discrete vortices. Figures 15.46d-15.46g show the merging of the loops and the propagation of the wave front to the far field. Therefore, for this case, the adjustment of the near-wake flow assists and contributes to the generation of the observed airfoil tone.
|
Figure 15.46A. Motion of wave fronts for Airfoil #2 at 2 x 10⁵ Reynolds number illustrating a secondary tone generation process. (a) t = 23.80T, (b) t = 24.02T, (c) t = 24.18T, (d) t = 24.201T, (e) t = 24.218T, (f) t = 24.35T; T = period. |
|
Figure 15.46B. Motion of wave fronts for Airfoil #2 at 2 x 10⁵ Reynolds number illustrating a secondary tone generation process. (g) t = 24.424T, (h) t = 24.53T; T = period. |
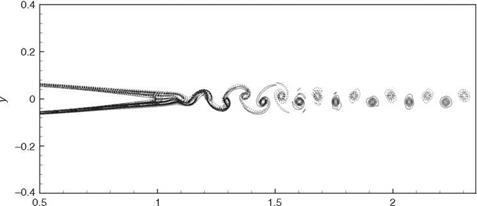
For airfoils with a sharp trailing edge, especially when operating at the high end of the moderate Reynolds number range, the wake rolls up into discrete vortices very close to the trailing edge (see Figure 15.47). In these cases, the formation of discrete vortices does contribute to the generation of airfoil tones. This secondary tone generation process is illustrated in the motion of the wave fronts in Figure 15.48. Figure 15.48a may be considered as the beginning of a tone generation cycle. To observe the secondary tone generation process, attention is directed to the shaded area of this figure. Figure 15.48b (at a later time) shows the expansion of the shaded region. In comparison with Figure 15.47, it is seen that the location of the expanded shaded region coincides with the beginning of the wake rolling up into isolated vortices. It is believed, therefore, that the formation of the vortices is what drives the expansion of the shaded region. Figures 15.48c-15.48h track the continued spreading of the sound pulse after it is generated. It appears that the dominant tone generation mechanism due to the interaction of near-wake instability and the airfoil trailing edge is responsible for the radiating sound to the upstream and sideline directions.
|
x Figure 15.47. Vorticity contours showing the rolling up of the wake into discrete vortices near the sharp trailing edge of an airfoil. Airfoil #1 at Re = 4 x 10⁵. |
|
Figure 15.48A. A secondary tone generation mechanism due to the formation of discrete vortices in the wake illustrated by the motion of wave front contours. Airfoil #1 at Re = 4 x 10⁵. (a) t = 50.264T, (b) t = 50.41T, (c) t = 50.51T, (d) t = 50.643T, (e) t = 50.795T, (f) t = 51.002T. |
|
Figure 15.48B. A secondary tone generation mechanism due to the formation of discrete vortices in the wake illustrated by the motion of wave front contours. Airfoil #1 at Re = 4 x 10⁵. (g) t = 51.188T, (h) t = 51.254T. |
The secondary tone generation mechanism due to the formation of discrete vortices is responsible for radiating sound to the downstream direction. The two mechanisms are perfectly coordinated and synchronized.