
Our heavyweight helicopter equal in the world does not have
In Rostov started production of the most load-lifting rotary-wing car The Russian holding «Helicopt[...]

Everything about aircrafts and helicopters. News and events in aviation worldwide. Civil, transportation, military helicopters and airplanes.

Everything about aircrafts and helicopters. News and events in aviation worldwide. Civil, transportation, military helicopters and airplanes.

Everything about aircrafts and helicopters. News and events in aviation worldwide. Civil, transportation, military helicopters and airplanes.

Everything about aircrafts and helicopters. News and events in aviation worldwide. Civil, transportation, military helicopters and airplanes.


If the Pitot tube is not aligned with the stream, the measured pressure is lower than the stagnation pressure since only the velocity component normal to the entrance section is stopped. The effect of the angle of incidence is negligible for angles less than, approximately, ±10° in the subsonic regime (Figure 2.4). This insensitivity is particularly beneficial in the Pitot tubes mounted on the nose of airplanes flying at non-zero angles of attack.
Figure 2.4 shows that the influence of the angle of attack also depends on the ratio of the hole diameter, d, and the outer diameter of the probe, D: in particular, the error for a given angle of incidence, decreases with the increase of the ratio d/D.
To increase the insensitivity to the alignment of the probe, a Kiel tube can be used (Figure 2.5), which is a Pitot tube immersed in a Venturi tube, which shows an insensitivity to angles of attack up to ±40° (Figure 2.6), or even ±60° with a modified version (on the right in Figure 2.5), obtained by changing the mouth of the Venturi: these features are achieved in the Kiel tube because the stream separation takes place only at very high angles of attack.
 |
Effects of the angle of incidence on the reading of a Pitot tube with different ratios between internal and external diameters
Best modification
Recalling the definition of stagnation pressure as the maximum pressure that can be obtained by stopping the fluid isoentropically and adiabati – cally, it can be measured in an orifice drilled in the stagnation point of a body. The simplest body is a tube aligned with the direction of the stream with the open end facing the stream (Figure 2.3) called a Pitot tube after its inventor, Henri Pitot (1732). The other end of the tube is connected to a pressure-indicating instrument so that in equilibrium there is no motion in the tube (U = 0, stagnation).
 |
|
If the opening is also normal to the tube axis and with circular crosssection, free of obstacles, the reading of the instrument is, in the subsonic regime, virtually independent from the shape of the front and the length of the tube.
The speed, U, in a gas can be calculated from the ratio between stagnation pressure, p0, and static pressure, p, using the relationship valid for a thermally and calorically perfect gas:
where M is the Mach number, у is the ratio of specific heats at constant pressure and constant volume, T the static temperature and R the gas constant, ratio between the universal gas constant and the molecular weight of the gas.
From Equation (2.1), the speed U is obtained:
The calculation of speed hence requires the measure of two pressures, p0 and p, and the measure of the static temperature of the stream, which is impossible to obtain, as we shall see, when the Mach number is high; it is easier in this case to calculate the Mach number, which is a function of pressures only:
In the case of flow at low Mach numbers (M << 1), Equation (2.1) can be expressed in a power series of M2 (U2) as follows:
This yields, by truncating the series at the second term:
![]() p0 = p +
p0 = p +
which is the Bernoulli equation for an incompressible flow. This equation underestimates the stagnation pressure compared to Equation (2.1) (the next terms in the series, all positive, are ignored) and hence for the same p0 and p, provides a higher speed.
In this scheme, the speed can be calculated, once the density (constant) is known, from the difference between the stagnation pressure and the static pressure (dynamic pressure, q) according to the equation:
From Figure 2.1, which shows the ratio, Equation (2.4), between the speed calculated with Equation (2.3) and the speed calculated with Equation (2.2), we see that Equation (2.3), strictly valid only for M = 0, can be used, accepting an error of less than 1% up to M = 0.3, or up to M = 0.4, if an error of 2% can be accepted.
 |
Ratio of speed calculated by the Bernoulli theorem and true speed for у = 1.4
In compressible flows, as can easily be seen from Equation (2.1), the dynamic pressure is no longer equal to q = pV2/2 but the latter term is still used to define pressure coefficient and aerodynamic forces coefficients.
Speed of a stream can then be measured on whatever body is immersed in the stream because on it both the stagnation pressure, in the stagnation point, and the pressure of the undisturbed stream can be found. For example, on an infinite cylinder of circular cross-section immersed in a non-viscous and incompressible flow with velocity Vx perpendicular to axis of the cylinder (Figure 2.2): defining as pressure coefficient the ratio
C = p-p, p pU1 ± 2
■ Cp = 1 (p = p0 at the stagnation points) at a = 0° and 180°
■ Cp = 0 (p = px) at a = ±30° and ±150°
On a sphere:
■ Cp = 1 (p = p0 at the stagnation points) at a = 0° and 180°
■ Cp = 0 (p = px) at a = ±40° and a = ±140°

 |
Diagrams of pressure coefficient, Cp, on a cylinder and a sphere in a theoretical potential flow, and in real laminar and turbulent regimes
 Sphere
In practice, a flow is never potential: if the Reynolds number is large but not infinite, a boundary layer will exist all around the body; nevertheless, the pressure on the body will be the same as that outside the
boundary layer because of the relationship — = 0. Therefore the
dy
distribution of pressure in the field outside the boundary layer can be detected through orifices made on the surface of the body. It must be noted, however, that the distribution of pressure on the body is different from that of potential flow; in fact, in the wake, the recovered pressure is lower than the stagnation pressure. Furthermore, the position of the points where the pressure is equal to pm is moved downstream about 5°; pressure on the afterbody is strongly influenced by the nature of the boundary layer and hence by the location of the boundary layer separation.
However, there are special cases, such as measuring the speed profile within the boundary layer itself with very small probes and in the presence of very low speed: in these cases the Reynolds number referred to the size of the probe is very small and the flow in the proximity of the probe must be considered viscous and corrections to measured pressures will be made (cf. Section 2.3.5).
It can be noted that measuring p0 and pm on blunt bodies, such as circular cylinders and spheres, is impractical both because of the large dimensions, leading to a poor resolution, and because of the great variability of the pressure on the body with flow direction. Tubular probes of smaller size and lower sensitivity to direction are therefore preferred.
In some cases, the measurement of speed can be simplified:
■ In a wind tunnel, the stagnation pressure of the undisturbed stream can be known by measuring the static pressure in the settling chamber of the wind tunnel, where the speed is low enough. Similarly, the static pressure of the undisturbed stream can be measured in an orifice drilled in the wall in the entrance station of the test chamber. From the two measures the Mach number of the tunnel can be determined by Equations (2.2) or (2.3), without introducing probes into the stream.
The measure will, however, be slightly wrong because the stagnation pressure is not exactly the same in the settling chamber and in the test chamber.
■ In a subsonic free jet, static pressure must be equal to ambient pressure and can be measured with a barometer; to measure the speed profile in the jet, it is then sufficient to measure the profile of the stagnation pressure.
■ Similarly, as the static pressure in each section of a straight tube is constant and can be measured in an orifice drilled in the wall, the speed profile in a section can be obtained by taking only the measurements of the stagnation pressure.
Abstract: This chapter will address the measurement of velocity in a steady flow, in magnitude and direction, and of mass flow in pipes, obtained from pressure measurements.
Key words: direction probes, Pitot tube, Prandtl tube, Venturi tube.
2.1 Introduction
Speed at a point in a fluid flow can be measured in the following ways:
■ By measuring the distance, ds, travelled by fluid particles in a known time interval, dt (particle image velocimetry, PIV), or by measuring the time taken by particles to travel a fixed distance (laser two focus anemometer, L2F). Because air is transparent to light, it must be seeded with visible solid or liquid particles assumed to have the same speed as the air stream. These methods require fairly sophisticated equipment and data processing.
■ More frequently by a measure of other parameters (pressures, Doppler effect produced by particles carried by the stream, heat exchange between the stream and a metal wire heated by the Joule effect, speed of rotation of a windmill, etc.) from which the speed can be calculated from theoretical considerations and/or a preliminary calibration. The most commonly used method, when speed is constant in time, is based on pressure measurements; other methods such as hot-wire or laser – Doppler anemometers, are particularly effective when the flow is turbulent. In supersonic flows another method is used based on the measurement of the inclination of Mach waves or of shock waves on wedges and cones.
Pressure-sensitive paints (PSP) have been used since 1980 to display and measure the distribution of pressures throughout the model. The advantages of the method are:
■ continuous pressure measurements on the whole surface;
■ non-intrusiveness, since there are no probes to be introduced in the fluid flow;
■ reduced time and cost of preparing the model (there are no orifices to be made, transducers or pressure tubes or scanning valves to be inserted in the model);
■ high resolution, limited only by the size of the pixels of the camera system.
Disadvantages are:
■ sensitivity to temperature;
■ the need for prior calibration;
■ filming techniques and sophisticated data processing.
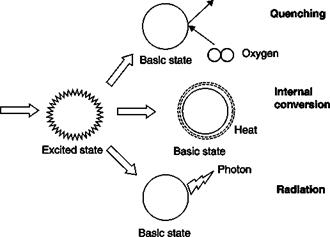
The paints are made of luminescent substances, embedded in a binder, that, when excited by light radiation (UV or visible light), re-emit (Figure 1.13) part of it as light with a different wavelength (fluorescence), transforms a part of it in internal energy (internal conversion), and a part of the energy goes to excite oxygen molecules (oxygen quenching).
Re-emission of a luminescent molecule
 Activated oxygen
oo
![]()
 Photon
Since the luminescence is reduced by the presence of oxygen molecules, increasing pressure, and thus the partial pressure of oxygen, tends to mitigate the intensity of the light emitted: a measure of the distribution of the latter on the surface of the model therefore allows the distribution of pressure to be traced.
Before the production of cheap piezoresistive transducers, the use of a transducer for each of many pressure taps was considered too expensive; thus, pneumatic scanning valves, Scanivalve, were produced, from 1960 to 2000, connecting a single transducer of excellent quality with each of the pressure taps sequentially (Figure 1.10): the transducer is sequentially connected to the various Px ports by a single hole in the rotor which
Inside view of a Scanivalve and how it works

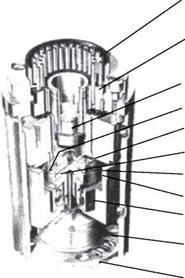 Pressure transducer Typical port Elastic duct Collector hole Stator Rotor
Thrust Bearing
 |
Position transmitter (Encoder) electrically indicates port being measured Scanivalve drive (not shown)
terminates at the collector hole. As the rotor rotates, this collector passes under the Px input pressure ports in the stator. Because of the extremely small traveling volume, scanning rates of 20 ports per second are possible. The stator is elastically connected to the block in a manner which allows the stator to follow the surface of the rotor. Thus the pneumatic forces at each port, which tend to blow the rotor away from the stator, are withstood by the thrust ball bearing. Each Px pressure is elastically ducted from the block to its port in the stator.
Each valve can scan up to 48 pressure tubes and a single stepper motor can operate up to 5 valves. When one of the 48 ports is used for span and one for zero calibrating pressures, the pressure transducer can be automatically calibrated on every scan.
The Scanivalve is not suitable for a field survey of many rapidly varying pressures, in fact, the reading of each tap can only be done at each complete revolution, but even if the engine is stopped, reading of a variable pressure is affected by delays introduced by the pipe connecting the pressure tap and the Scanivalve, which has small diameter and considerable length. The size of the Scanivalve in fact prevents its accommodation within the model being tested.
The advent of cheap piezoresistive transducers, with their qualities of high natural frequency and very small dimensions (in the order of mm) led to the creation of packages of transducers that can be accommodated within the models, e. g. a package of 64 transducers 105 mm x 36 mm x 14 mm in size (Figure 1.11). The scanning is done electronically and allows a sampling rate of up to 10 kHz per channel.
The reference pressure is sent simultaneously to all transducers. At each scan cycle it can be sent to a pressure transducer to control the calibration (Figure 1.12). At the same time cleaning of the pipe can be made to prevent clogging of the various tubes.

![]() Electronic pressure scanner with 64 transducers
Electronic pressure scanner with 64 transducers
 |
CAL 042 O. D.
 |
Source: [4]
Piezoelectricity is the other transduction technology used in transducers intended to measure time-varying forces, pressures and accelerations. As the technology of piezoresistive materials has developed since the 1960s, a similar effort in the years 1920 to 1950 was accomplished in piezoelectric technology. The crystals belonging to those classes that do not have a center of symmetry of the structure of the lattice are piezoactive, i. e. the material develops a varying electric potential difference when subjected to a change in stress (pressure) and, conversely, undergoes a variable deformation if subjected to the action of a variable voltage (oscillator). Twenty of the 32 crystal classes lack this symmetry, and all crystals belonging to these classes, except one, exhibit piezoelectric characteristics.
The resulting charge is distributed on certain crystal faces in a manner determined by the symmetry of the crystal and the nature of the efforts applied. Some materials, such as tourmaline, lithium sulfate and barium titanate, are sensitive to hydrostatic pressure; other materials, such as quartz and Rochelle salt, develop a charge only under the unilateral application of force, the charge is spread through the influence of a normal component of the stress, such as quartz, or tangential stress, such as Rochelle salt. Some ferroelectric ceramic materials can be made artificially piezoelectric.
The piezoelectric constant of a material expresses the charge generated per unit of applied force or the deflection per unit of electrical voltage applied. The constant is typically given in tensor notation, such as d33, with the first subscript identifying electrical direction and the second subscript identifying mechanical direction. Typical units are Coulombs/ Newton or meters/volt.
A piezoelectric transducer is effectively a capacitor that produces a charge proportional to the force applied to it, the load can be applied in a unilateral direction by a piston or a diaphragm or the material may be subject to a hydrostatic load. Unlike piezoresistive transducers, piezoelectric probes do not have response to zero frequency: they are therefore not suitable for measuring stationary or slowly varying pressures and can only be used for the measurement of fast transient ones. This shortcoming can be avoided by making transducers in which the pressure, even when constant, can be measured indirectly by measuring the frequency of the oscillation of the crystal, which is a function of the pressure.
As the crystals grow polarization due to the movement of the “center of gravity” of positive and negative charges under the influence of elastic deformations, we expect that the expansion and contraction under the influence of temperature changes will produce similar effects. This type of pyroelectric effect is frequently a source of interference, especially when the measured pressure transients are accompanied by violent fluctuations in temperature. Hydrostatically sensitive materials such as tourmaline are especially susceptible to this interference and are much more sensitive than non-hydrostatic crystals, such as quartz. In the latter case, the pyroelectric charge will not grow at all if the temperature changes uniformly through the crystal.
Of course, it is impossible to precisely define the limits of application of piezoelectric pressure transducers but to give a rough idea of the magnitude of the practical limits of pressure and frequency, it can be said that these sensors have been used to measure transient changes in pressure from 10-2 to 103 atm. It is relatively easy to measure transients lasting up to one-fifth of a second, but it becomes difficult to measure slower phenomena because of pyroelectric interference. The high frequency response is limited, in most applications, by the time taken by the pressure impulse to propagate in the transducer rather than by the natural frequency of the crystal. So the upper limit is determined by the size of the transducers (the smallest transducers are 1 mm in diameter). Their usable frequency response can extend to 300 kHz with an accuracy of 0.01% FS.
Semiconductors, such as silicon crystals, show a strong change of resistivity following a deflection (piezoresistivity), so for them the term dp/ep of Equation (1.12) is much greater than for metals: a strain gage made of a semiconductor has a gage factor that can vary from 50 to 200. This high gage factor makes semiconductor strain gages very attractive, as with them the problem of obtaining a useful signal from a very rigid transducer with a high natural frequency can be solved.
The dizzying development of semiconductor technology and the realization of integrated circuits in the 1970s strongly influenced the market for transducers. The rationale for this influence is significant even in the mechanical properties of silicon crystals: the elastic modulus is of the same order of magnitude as that of steel, the tensile strength is greater, and the relationship between the modulus of elasticity and the density is three times that of steel.
It must be emphasized that crystal silicon is both the flexural element which deforms and the transducer. Transducers are commercially
available in which the four arms of the Wheatstone bridge are diffused into a silicon diaphragm. The diameter of the transducers ranges from 1 to 30 mm, the resonance frequency varies from 55 kHz to 1 MHz, and the accuracy is 0.1 – r- 0.25% of the full scale.
One class of pressure transducers is based on the detection, with a strain gage, of the deformation of a plate (diaphragm) or the deflection of a cantilever beam, subjected to the pressure to be measured.
The strain gage consists of a wire or a ribbon glued, or sometimes deposited under vacuum, to an insulating support. The electrical resistance, R, of a conductive wire is given by
R = pS (1.10)
where p is the resistivity of the conductor, l its length and S its crosssectional area.
Differentiating Equation (1.10), is obtained:
where e and et are the longitudinal and transverse strains, respectively.
The gage factor is the ratio of unit change of resistance and longitudinal strain
gage factor —dR = 1 + 2v + (1.12)
є R ep
where v is the Poisson’s ratio (v = etfє|).
The gage factor for metallic wires ranges between 2 and 5. Since usually the strain gage is one of the resistances of a Wheatstone bridge, the bridge output signal, for a given strain, is proportional to the gage factor.
The sensitivity of a transducer is proportional to the inverse stiffness (compliance) of its flexural element. The compliance, defined as the deflection (Dx) per applied load, of a cantilever beam subjected to an end load, F, is:
— = —mN-1 (1.13)
F 3EI
where E is the Young’s modulus and I is the moment of inertia of the beam’s cross-sectional area.
The compliance of the center of an edge-fixed circular plate to a uniform load p is:
A = 3 (1 – v) r2mN_1 (1.14)
pnr 16л Et
where t is the thickness and r is the radius of the plate.
The natural frequency for the fundamental mode of vibration of a cantilever beam is:
where m is the mass per unit length.
The natural frequency for the first circular mode of vibration of a fixed edge circular plate is:
![]() = 1.6183 I Et3
= 1.6183 I Et3
= r1 ]j12p(1 – v2) Hz
where p is the mass per unit area.
The relationships between flexibility and natural frequencies of vibration are therefore:
If high flexibility is needed to get a strong enough signal, the natural frequency of the element is limited and hence the maximum frequency detectable by the transducer.
Pressure transducers with strain gages of the smallest size (6 mm in diameter) are commercially available with a frequency response of 10 kHz, which are particularly useful in applications where the sensing element can be flush-mounted on a wall so to avoid interference with the stream. They are fairly cheap and easy to manufacture and are robust.
The diaphragm deflection is transmitted to a displacement transducer element which consists of four sets of unbounded wire strain gages
![]()
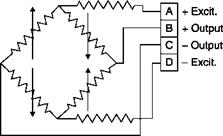 |
Circuit diagram of a strain gage transducer
forming the four arms of a resistance bridge (see Figure 1.9). A galvanometer, oscilloscope or recording instrument indicates the bridge imbalance arising from changes in the bridge resistances after a strain is imposed on the wire. The galvanometer output is calibrated to yield the pressure indication. The use of four strain elements, two of which are shortened and two of which are lengthened by the diaphragm displacement, increases the instrument sensitivity. These instruments are also supplied with a temperature compensator to eliminate thermal resistance changes and consequent error in the pressure indication.
Pressure transducers derived directly from the diaphragm gage can be used for moderate frequencies. The displacement of the diaphragm due to the pressure difference can be converted into an electrical output in different ways:
■ Potentiometric: the motion of a wiper along a resistive mechanism modifies the electrical resistance of a circuit powered by direct current; the presence of a sliding contact, which is subject to wear, limits the life of the instrument.
■ Electromagnetic: a block of magnetic material is moved in a coil so as to affect the inductance (Figure 1.8) of the circuit. It is necessary to feed the coil with a high frequency alternate current which must then be filtered out in the output signal in order to show only the changes induced by pressure oscillations; power supply and signal processing are expensive.
■ Capacitive: the diaphragm and the pressure cavity powered by direct current create a variable capacitor; the advantage in terms of natural frequency is the lack of moving masses, apart from the vibrating plate.
The output signal is the voltage if the measure is made on site; if the signal has to be sent at a distance, without taking into account the voltage drop in the transmitting wires, it is appropriate that the signal is the current flowing in the circuit: in this case, one talks about a pressure transmitter instead of a pressure transducer.
Capsule transducers of moderate size are commercially available, typically with a diameter of 4-6 cm, an accuracy approaching 0.1% FS (full scale) and a response time of the order of 5 ms. They are made entirely of steel and are particularly suitable for industrial applications in the presence of shock, vibration, or temperature changes. The measuring range extends up to 700 bars.
![]() Electromagnetic transducer
Electromagnetic transducer
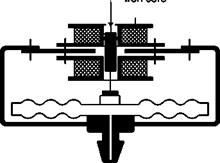 — Iron core
Coil
fp