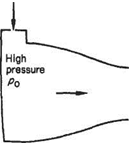
Consider a converging tube (Fig. 6.3) exhausting a source of air at high stagnation pressure po into a large receiver at some lower pressure. The mass flow induced in the nozzle is given directly by the equation of continuity (Eqn (6.22)) in terms of pressure ratio p/po and the area of exit of the tube A, i. e.
Fig. 6.3
A slight rearrangement allows the mass flow, in a non-dimensional form, to be expressed solely in terms of the pressure ratio, i. e.

 (6.29)
Inspection of Eqn (6.29), or Eqn (6.22), reveals the obvious fact that m = 0 when РІРо = 1, i. e. no flow takes place for zero pressure difference along the duct. Further inspection shows that m is also apparently zero when p/po = 0, i. e. under maximum pressure drop conditions. This apparent paradox may be resolved by considering the behaviour of the flow as p is gradually decreased from the value po. As p is lowered the mass flow increases in magnitude until a condition of maximum mass flow occurs.
The maximum condition may be found by the usual differentiation process, i. e. from Eqn (6.29):
i. e.
2 /p(2/7)~‘ 7+I /p [(7+1)/7bl
7 7 Po)
which gives
It will be recalled that this is the value of the pressure ratio for the condition M = 1 and thus the maximum mass flow occurs when the pressure drop is sufficient to produce sonic flow at the exit.
Decreasing the pressure further will not result in a further increase of mass flow, which retains its maximum value. When these conditions occur the nozzle is said to be choked. The pressure at the exit section remains that given by Eqn (6.30) and as the pressure is further lowered the gas expands from the exit in a supersonic jet.
From previous considerations the condition for sonic flow, which is the condition for maximum mass flow, implies a throat, or section of minimum area, in the stream. Further expansion to a lower pressure and acceleration to supersonic flow will be accompanied by an increase in section area of the jet. It is impossible for the pressure ratio in the exit section to fall below that given by Eqn (6.30), and solutions of Eqn (6.29) have no physical meaning for values of
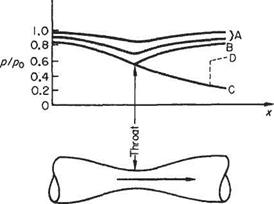
Fig. 6.4
Equally it is necessary for the convergent-divergent tube of Fig. 6.1 to be choked before the divergent portion will maintain supersonic conditions. If this condition is not realized, the flow will accelerate to a maximum value in the throat that is less than the local sonic speed, and then decelerate again in the divergent portion, accompanied by a pressure recovery. This condition can be schematically shown by the curves A in Fig. 6.4 that are plots of p/p0 against tube length for increasing mass flow magnitudes. Curves В and C result when the tube is carrying its maximum flow. Branch В indicates the pressure recovery resulting from the flow that has just reached sonic conditions in the throat and then has been retarded to subsonic flow again in the divergent portion. Branch В is the limiting curve for subsonic flow in the duct and for mass flows less than the maximum or choked value. The curve C represents the case when the choked flow is accelerated to supersonic velocities downstream of the throat.
Considerations dealt with so far would suggest from the sketch that pressure ratios of a value between those of curves В and C are unattainable at a given station downstream of the throat. This is in fact the case if isentropic flow conditions are to be maintained. To arrive at some intermediate value D between В and C implies that a recompression from some point on the supersonic branch C is required. This is not compatible with isentropic flow and the equations dealt with above no longer apply. The mechanism required is called shock recompression.
Example 6.4 A wind-tunnel has a smallest section measuring 1.25 m x 1 m, and a largest section of 4 m square. The smallest is vented, so that it is at atmospheric pressure. A pressure tapping at the largest section is connected to an inclined tube manometer, sloped at 30° to the horizontal. The manometer reservoir is vented to the atmosphere, and the manometer liquid has a relative density of 0.85. What will be the manometer reading when the speed at the smallest section is (i) 80ms-1 and (ii) 240ms-1? In the latter case, assume that the static temperature in the smallest section is 0 °С, (273 K).
Denote conditions at the smallest section by suffix 2, and the largest section by suffix 1. Since both the smallest section and the reservoir are vented to the same pressure, the reservoir may be regarded as being connected directly to the smallest section.
Area of smallest section Аг = 1.25 m2
Area of largest section A = 16 m2
(і) Since the maximum speed is 80 m s 1 the flow may be regarded as incompressible. Then
viAi= v2A2
V! x 16 = 80 x 1.25
giving
vi = 6.25 ms-1
By Bernoulli’s equation, and assuming standard temperature and pressure:
 1
1
Then
Pi~Pi= ^p(vi – »?) = 0.613(802 – 6.252)
= 0.613 x 86.25 x 73.25 = 3900 NnT2
This is the pressure across the manometer and therefore
AP = PmgM
where ДА is the head of liquid and pm the manometric fluid density, i. e.
3900 = (1000 x 0.85) x 9.807 x ДА
This gives
ДА = 0.468 m But
ДА = r sin в
where r is the manometer reading and в is the manometer slope. Then
0.468 = r sin 30° =^r
and therefore
r = 0.936 m
(ii) In this case the speed is well into the range where compressibility becomes important, and it will be seen how much more complicated the solution becomes. At the smallest section, T2 = 0°C = 273K
a2 = (1.4 x 287.1 x 273)* = 334ms-1 From the equation for conservation of mass
PAV = p2A2v2 i. e.
Pi _ A2v2 P2 Aivi
vi = 14.7ms 1
which value makes the ignored term even smaller. Further
Pi/p2 = 18.75/vi = 1.278
and therefore
 = ‘= (1.278)14 = 1.410
= 101 325 x 0.410 = 41 500 Nm-2
Then the reading of the manometer is given by
Ap 41 500 x 2
Pmgsinfl 1000 x 0.85 x 9.807 = 9.95 m
This result for the manometer reading shows that for speeds of this order a manometer using a low-density liquid is unsuitable. In practice it is probable that mercury would be used, when the reading would be reduced to 9.95 x 0.85/13.6 = 0.62m, a far more manageable figure. The use of a suitable transducer that converts the pressure into an electrical signal is even more probable in a modern laboratory.
710 mm. Another manometer tube is connected at its free end to a point on an aerofoil model in the smallest section of the tunnel, while a third tube is connected to the total pressure tube of a Pitot-static tube. If the liquid in the second tube is 76 mm above the zero level, calculate the pressure coefficient and the speed of flow at the point on the model. Calculate also the reading, including sense, of the third tube.
 (i) To find speed of flow at smallest section:
Manometer reading = 0.710 m
Therefore
pressure difference = 1000 x 0.85 x 9.807 x 0.71 x j
= 2960 N m-2
But
PI-P2=P0{V2-V2i)
and
vi = 1.25v2/16 = 5v2/64
Therefore

Therefore
Hence, dynamic pressure at smallest section
= lPovi = 0.613 V2 = 2980 N m-2
(ii) Pressure coefficient:
Since static pressure at smallest section = atmospheric pressure, then pressure difference between aerofoil and tunnel stream = pressure difference between aerofoil and atmosphere. This pressure difference is 76 mm on the manometer, or
Ap = 1000 x 0.85 x 9.807 x 0.076 x = 317.5Nnr2
Now the manometer liquid has been drawn upwards from the zero level, showing that the pressure on the aerofoil is less than that of the undisturbed tunnel stream, and therefore the pressure coefficient will be negative, i. e.
q = v2(l – CP)U2 = 69.7(1.1068)1/2 = 73.2 ms-1
(Ш) The total pressure is equal to stream static pressure plus the dynamic pressure and, therefore, pressure difference corresponding to the reading of the third tube is (po + jpvf) — Po, i. e. is equal to jpvj. Therefore, if the reading is гз
py{ = Pmgri sin в
2980 = 1000 x 0.85 x 9.807 x r3 x ±
whence
гз 0.712m
Since the total head is greater than the stream static pressure and, therefore, greater than atmospheric pressure, the liquid in the third tube will be depressed below the zero level, i. e. the reading will be —0.712 m.
Example 6.6 An aircraft is flying at 6100 m, where the pressure, temperature and relative density are 46500Nm-2, —24.6 °С, and 0.533 respectively. The wing is vented so that its internal pressure is uniform and equal to the ambient pressure. On the upper surface of the wing is an inspection panel 150 mm square. Calculate the load tending to lift the inspection panel and the air speed over the panel under the following conditions:
(i) Mach number = 0.2, mean Cp over panel —0.8
(ii) Mach number = 0.85, mean Cp over panel = -0.5.
(i) Since the Mach number of 0.2 is small, it is a fair assumption that, although the speed over the panel will be higher than the flight speed, it will still be small enough for compressibility to be ignored. Then, using the definition of coefficient of pressure (see Section 1.5.3)
r. P і – P Pl O. lpftf2-
p – p = Q. lpM2 Cpx = 0.7 x 46500 x (0.2)2 x (-0.8) = -1041 Nm“2
The load on the panel = pressure difference x area
= 1041 x (0.15)2 = 23.4 N
Also
whence
= 1.8 giving ^ = 1.34
Now speed of sound = 20.05 (273 — 24.6)1’2 = 318 m s-1 Therefore, true flight speed = 0.2 x 318 = 63.6m s-1 Therefore, air speed over panel, q = 63.6 x 1.34 = 85.4m s-1 (ii) Here the flow is definitely compressible. As before,
r _ Pi-P p’ 0.1 pM2
and therefore
pi – p = 0.7 x 46 500 x (0.85)2 x (-0.5)
= — 11 740 N m-2
Therefore, load on panel = 11 740 x (0.15)2 = 264 N
There are two ways of calculating the speed of flow over the panel from Eqn (6.18):
(a)
where a is the speed of sound in the free stream, i. e.
Now
 pi — p = —11 740N m
and therefore
pi =46500- 11 740 = 34 760 NmT2
Thus substituting in the above equation the known values p = 46 500Nm 2, Pi = 34760Nm’2 and M = 0.85 leads to
= 1.124 giving ^ = 1.06
Therefore
q = 1.06a = 1.06 x 318 = 338ms-1
It is also possible to calculate the Mach number of the flow over the panel, as follows. The local temperature T is found from
аг = a(0.920)1/2 = 318(0.920)1/2 = 306ms-1
Therefore, Mach nmnber over panel = 338/306 = 1.103.
(b)
The alternative method of solution is as follows, with the total pressure of the flow denoted bypo:
Therefore
po = 46500 x 1.605 = 74 500 N m-2
As found in method (a)
pi — p = —11740Nm 2
and
Pi = 34760Nm 2
Then
giving
Mi = 1.22, Mi = 1.103
which agrees with the result found in method (a). The total temperature Tq is given by
Therefore
7o = 1.1445×248.6 = 284 К
Then
^ = (2.15)1/35 = 1.244 7i
giving
and the local speed of sound over the panel, ai, is
щ = 20.05(228)1/2 = 305 ms-1 Therefore, flow speed over the panel
q = 305 x 1.103 = 338ms-1
which agrees with the answer obtained by method (a).
An interesting feature of this example is that, although the flight speed is subsonic (M = 0.85), the flow over the panel is supersonic. This fact was used in the ‘wing-flow’ method of transonic research. The method dates from about 1940, when transonic wind-tunnels were unsatisfactory. A small model was mounted on the upper surface of the wing of an aeroplane, which then dived at near maximum speed. As a result the model experienced a flow that was supersonic locally. The method, though not very satisfactory, was an improvement on other methods available at that time.
Example 6.7 A high-speed wind-tunnel consists of a reservoir of compressed air that discharges through a convergent-divergent nozzle. The temperature and pressure in the reservoir are 200 °С and 2 MNm-2 gauge respectively. In the test section the Mach number is to be 2.5. If the test section is to be 125 mm square, what should be the throat area? Calculate also the mass flow, and the pressure, temperature, speed, dynamic and kinematic viscosity in the test section.
C12512
Therefore, throat area = = 5920 (mm)2
Since the throat is choked, the mass flow may be calculated from Eqn (6.24), is
Now the reservoir pressure is 2MNm 2 gauge, or 2.101 MNm 2 absolute, while the reservoir temperature is 200 °С = 473K. Therefore
mass flow = 0.0404 x 2.101 x 106 x 5920 x 10 6/(473)I/2 = 23.4 kgs-1
In the test section
2
= 1 + – y – = 2.25
Therefore
Po/Pi = (2-25)3’5 = 17.1
Therefore

Temperature in test section = ——- = 210 К = -63 °С
2.25
Speed of sound in test section = (1.4 x 287.1 x 210)5 = 293 ms 1
Air speed in lest section = 2.5 x 293 = 732 ms
As a check, the mass flow may be calculated from the above results. This gives
Mass flow = pvA = 2.042 x 732 x 15 625 x 10-6
= 23.4 kgs-1


 (6.29)


