Category Aerodynamics for Engineering Students

The bound vortex system

Both the starting vortex and the trailing system of vortices are physical entities that can be explored and seen if conditions are right. The bound vortex system, on the other hand, is a hypothetical arrangement of vortices that replace the real physical wing in every way except that of thickness, in the theoretical treatments given in this chapter. This is the essence of finite wing theory. It is largely concerned with developing the equivalent bound vortex system that simulates accurately, at least a little distance away, all the properties, effects, disturbances, force systems, etc., due to the real wing.

Consider a wing in steady flight. What effect has it on the surrounding air, and how will changes in basic wing parameters such as span, planform, aerodynamic or geometric twist, etc., alter these disturbances? The replacement bound vortex system must create the same disturbances, and this mathematical model must be sufficiently flexible to allow for the effects of the changed parameters. A real wing produces a trailing vortex system. The hypothetical bound vortex must do the same. A conse­quence of the tendency to equalize the pressures acting on the top and bottom surfaces of an aerofoil is for the lift force per unit span to fall off towards the tips. The bound vortex system must produce the same grading of lift along the span.

For complete equivalence, the bound vortex system should consist of a large number of spanwise vortex elements of differing spanwise lengths all turned back­wards at each end to form a pair of the vortex elements in the trailing system. The varying spanwise lengths accommodate the grading of the lift towards the wing-tips, the ends turned back produce the trailing system and the two physical attributes of a real wing are thus simulated.

For partial equivalence the wing can be considered to be replaced by a single bound vortex of strength equal to the mid-span circulation. This, bent back at each end, forms the trailing vortex pair. This concept is adequate for providing good estimations of wing effects at distances greater than about two chord lengths from the centre of pressure.

The trailing vortex system

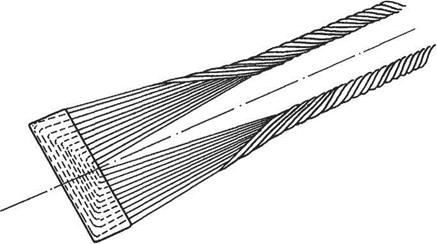
The pressure on the upper surface of a lifting wing is lower than that of the surrounding atmosphere, while the pressure on the lower surface is greater than that on the upper surface, and may be greater than that of the surrounding atmosphere. Thus, over the upper surface, air will tend to flow inwards towards the root from the tips, being replaced by air that was originally outboard of the tips. Similarly, on the undersurface air will either tend to flow inwards to a lesser extent, or may tend to flow outwards. Where these two streams combine at the trailing edge, the difference in spanwise velocity will cause the air to roll up into a number of small streamwise vortices, distributed along the whole span. These small vortices roll up into two large vortices just inboard of the wing-tips. This is illustrated in Fig. 5.3. The strength of

The trailing vortex system

Fig. 5.3 The horseshoe vortex

each of these two vortices will equal the strength of the vortex replacing the wing itself.

The existence of the trailing and starting vortices may easily be verified visually. When a fast aeroplane pulls out of a dive in humid air the reduction of pressure and temperature at the centres of the trailing vortices is often sufficient to cause some of the water vapour to condense into droplets, which are seen as a thin streamer for a short distance behind each wing-tip (see frontispiece).

To see the starting vortex all that is needed is a tub of water and a small piece of board, or even a hand. If the board is placed upright into the water cutting the surface and then suddenly moved through the water at a moderate incidence, an eddy will be seen to leave the rear, and move forwards and away from the ‘wing’. This is the starting vortex, and its movement is induced by the circulation round the plate.

The vortex system

Подпись: 5.1Lanchester’s contribution was essentially the replacement of the lifting wing by a theoretical model consisting of a system of vortices that imparted to the surrounding air a motion similar to the actual flow, and that sustained a force equivalent to the lift known to be created. The vortex system can be divided into three main parts: the starting vortex; the trailing vortex system; and the bound vortex system. Each of these may be treated separately but it should be remembered that they are all component parts of one whole.

5.1.1 The starting vortex

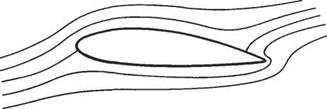
When a wing is accelerated from rest the circulation round it, and therefore the lift, is not produced instantaneously. Instead, at the instant of starting the streamlines over the rear part of the wing section are as shown in Fig. 5.1, with a stagnation point occurring on the rear upper surface. At the sharp trailing edge the air is required to change direction suddenly while still moving at high speed. This high speed calls for extremely high local accelerations producing very large viscous forces and the air is unable to turn round the trailing edge to the stagnation point. Instead it leaves the surface and produces a vortex just above the trailing edge. The stagnation point moves towards the trailing edge, the circulation round the wing, and therefore its lift, increasing progressively as the stagnation point moves back. When the stagnation point reaches the trailing edge the air is no longer required to flow round the trailing edge. Instead it decelerates gradually along the aerofoil surface, comes to rest at the trailing edge, and then accelerates from rest in a different direction (Fig. 5.2). The vortex is left behind at the point reached by the wing when the stagnation point

The vortex system

Fig. 5.1 Streamlines of the flow around an aerofoil with zero circulation, stagnation point on the rear upper surface


The vortex system

Fig. 5.2 Streamlines of the flow around an aerofoil with full circulation, stagnation point at the trailing edge. The initial eddy is left way behind


reached the trailing edge. Its reaction, the circulation round the wing, has become stabilized at the value necessary to place the stagnation point at the trailing edge (see Section 4.1.1).[22] The vortex that has been left behind is equal in strength and opposite in sense to the circulation round the wing and is called the starting vortex or initial eddy.

Finite wing theory

Preamble

Whatever the operating requirements of an aeroplane may be in terms of speed; endurance, pay-load and so on, a critical stage in its eventual operation is in the low-speed flight regime, and this must be accommodated in the overall design process. The fact that low-speed flight was the classic flight regime has meant that over the years a vast array of empirical data has been accumulated from flight and other tests, and a range of theories and hypotheses set up to explain and extend these observations. Some theories have survived to provide successful working processes for wing design that are capable of further exploitation by computational methods.

In this chapter such a classic theory is developed to the stage of initiating the preliminary low-speed aerodynamic design of straight, swept and delta wings. Theoretical fluid mechanics of vortex systems are employed, to model the loading properties of lifting wings in terms of their geometric and attitudinal characteristics and of the behaviour of the associated flow processes.

The basis on which historical solutions to the finite wing problem were arrived at are explained in detail and the work refined and extended to take advantage of more modern computing techniques.

A great step forward in aeronautics came with the vortex theory of a lifting aerofoil due to Lanchester[21] and the subsequent development of this work by Prandti. t Previously, all aerofoil data had to be obtained from experimental work and fitted to other aspect ratios, planforms, etc., by empirical formulae based on past experi­ence with other aerofoils.

Among other uses the Lanchester-Prandtl theory showed how knowledge of two-dimensional aerofoil data could be used to predict the aerodynamic charac­teristics of (three-dimensional) wings. It is this derivation of the aerodynamic characteristics of wings that is the concern of this chapter. The aerofoil data can either be obtained empirically from wind-tunnel tests or by means of the theory described in Chapter 4. Provided the aspect ratio is fairly large and the assump­tions of thin-aerofoil theory are met (see Section 4.3 above), the theory can be applied to wing planforms and sections of any shape.

Computational (panel) methods for two-dimensional lifting flows

The extension of the computational method, described in Section 3.5, to two­dimensional lifting flows is described in this section. The basic panel method was developed by Hess and Smith at Douglas Aircraft Co. in the late 1950s and early 1960s. The method appears to have been first extended to lifting flows by Rubbert[19] at Boeing. The two-dimensional version of the method can be applied to aerofoil sections of any thickness or camber. In essence, in order to generate the circulation necessary for the production of lift, vorticity in some form must be introduced into the modelling of the flow.

It is assumed in the present section that the reader is familiar with the panel method for non-lifting bodies as described in Section 3.5. In a similar way to the computational method in the non-lifting case, the aerofoil section must be model­led by panels in the form of straight-line segments – see Section 3.5 (Fig. 3.37). The required vorticity can either be distributed over internal panels, as suggested by Fig. 4.22a, or on the panels that model the aerofoil contour itself, as shown in Fig. 4.22b.

The central problem of extending the panel method to lifting flows is how to satisfy the Kutta condition (see Section 4.1.1). It is not possible with a computational scheme to satisfy the Kutta condition directly, instead the aim is to satisfy some of the implied conditions namely:

(a) The streamline leaves the trailing edge with a direction along the bisector of the trailing-edge angle.

(b)

Computational (panel) methods for two-dimensional lifting flows

As the trailing edge is approached the magnitudes of the velocities on the upper and lower surfaces approach the same limiting value.

T


(0)


(b)


Fig. 4.23 Two methods of implementing the Kutta condition at the trailing edge T


Computational (panel) methods for two-dimensional lifting flows

(c) In the practical case of an aerofoil with a finite trailing-edge angle the trailing edge must be a stagnation point so the common limiting value of (b) must be zero.

(d) The source strength per unit length must be zero at the trailing edge.

Computational schemes either use conditions (a) or (b). It is not generally possible to satisfy (c) and (d) as well because, as will be shown below, this leads to an over­specification of the problem. The methods of satisfying (a) and (b) are illustrated in Fig. 4.23. For condition (a) an additional panel must be introduced oriented along the bisector of the trailing-edge angle. The value of the circulation is then fixed by requiring the normal velocity to be zero at the collocation point of the additional (N + l)th panel. For condition (b) the magnitudes of the tangential velocity vectors at the collocation points of the two panels, that define the trailing edge, are required to be equal. Hess[20] has shown that the use of condition (b) gives more accurate results than (a), other things being equal. The use of surface, rather than interior, vorticity panels is also preferable from the viewpoint of computational accuracy.

There are two main ways that surface vorticity panels can be used. One method* is to use vorticity panels alone. In this case each of the N panels carries a vorticity distribution of uniform strength per unit length, 7i(i —1,2, …, N). In general, the vortex strength will vary from panel to panel. Let і = t for the panel on the upper surface at the trailing edge so that 1 = t + 1 for the panel on the lower surface at the trailing edge. Condition (b) above is equivalent to requiring that

Подпись: (4.104)It = -7/+1

The normal velocity component at the collocation point of each panel must be zero, as it is for the non-lifting case. This gives N conditions to be satisfied for each of the N panels. So when account is also taken of condition Eqn (4.104) there are N + 1 conditions to be satisfied in total. Unfortunately, there are only N unknown vortex strengths. Accordingly, it is not possible to satisfy all N + 1 conditions. In order to proceed further, therefore, it is necessary to ignore the requirement that the normal velocity should be zero for one of the panels. This is rather unsatisfactory since it is not at all clear which panel would be the best choice.

An alternative and more satisfactory method is to distribute both sources and vortices of uniform strength per unit length over each panel. In this case, though, the vortex strength is the same for all panels, i. e.

Подпись: (4.105)7/ = 7(i= 1,2, N)

Thus there are now N + 1 unknown quantities, namely the N source strengths and the uniform vortex strength per unit length, 7, to match the N + 1 conditions. With this approach it is perfectly feasible to use internal vortex panels instead of surface ones. However these internal panels must carry vortices that are either of uniform strength or of predetermined variable strength, providing the variation is character­ized by a single unknown parameter. Generally, however, the use of surface vortex panels leads to better results. Also Condition (a) can be used in place of (b). Again, however, the use of Condition (b) generally gives more accurate results.

A practical panel method for lifting flows around aerofoils is described in some detail below. This method uses Condition (b) and is based on a combination of surface vortex panels of uniform strength and source panels. First, however, it is necessary to show how the normal and tangential influence coefficients may be evaluated for vortex panels. It turns out that the procedure is very similar to that for source panels.

The velocity at point P due to vortices on an element of length <5£ in Fig. 4.24 is given by

Подпись: (4.106)sve = ldt

where 7d£ replaces Г/(27г) used in Section 3.3.2. SVg is oriented at angle в as shown.

Therefore, the velocity components in the panel-based coordinate directions, i. e. in the xq and y<2 directions, are given by

Computational (panel) methods for two-dimensional lifting flows(4.107)

Computational (panel) methods for two-dimensional lifting flows

(4.108)

Подпись: Д3/2Д»/2

Fig. 4.24

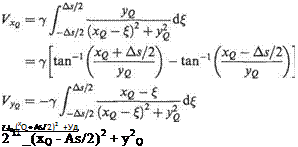
Подпись:To obtain the corresponding velocity components at P due to all the vortices on the panel, integration along the length of the panel is carried out to give

(4.109)

(4.110)

Following the basic method described in Section 3.5 normal and tangential influ­ence coefficients, N’y and Ту are introduced, the primes are used to distinguish these coefficients from those introduced in Section 3.5 for the source panels. N’y and Ту represent the normal and tangential velocity components at collocation point і due to vortices of unit strength per unit length distributed on panel j. Let?,■ and л,(і = 1,2, ..N) denote the unit tangent and normal vectors for each of the panels, and let the point P correspond to collocation point i, then in vector form the velocity at collocation point і is given by

VpQ — VXQij + Vya tij

To obtain the components of this velocity vector perpendicular and tangential to panel і take the scalar product of the velocity vector with л,- and?,■ respectively. If furthermore 7 is set equal to 1 in Eqns (4.109) and (4.110) the following expressions are obtained for the influence coefficients

Computational (panel) methods for two-dimensional lifting flows(4.111a)

(4.111b)

and [^vertices [^*el

Computational (panel) methods for two-dimensional lifting flows Подпись: XQ sources Подпись: (4.112)

Making a comparison between Eqns (4.109) and (4.111) for the vortices and the corresponding expressions (3.97) and (3.99) for the source panels shows that

With the results given above it is now possible to describe how the basic panel method of Section 3.5 may be extended to lifting aerofoils. Each of the N panels now carries a source distribution of strength at per unit length and a vortex distribution of strength 7 per unit length. Thus there are now N + 1 unknown quantities. The N x N influence coefficient matrices Ny and Ту corresponding to the sources must now be expanded to N x (N + 1) matrices. The (N + l)th column now contains the velocities induced at the collocation points by vortices of unit strength per unit length on all the panels. Thus Nys+i represents the normal velocity at the zth collocation point induced by the vortices over all the panels and similarly for 7) л’-і – Thus using Eqns (4.111)

Подпись:Подпись: Nijt+i = Y, Kj and rvv+i = Y T'iJComputational (panel) methods for two-dimensional lifting flows(4.113)

In a similar fashion as for the non-lifting case described in Section 3.5 the total normal velocity at each collocation point, due to the net effect of all the sources, the vortices and the oncoming flow, is required to be zero. This requirement can be written in the form:

Подпись: N Sources (4.114)

These TV equations are supplemented by imposing Condition (b). The simplest way to do this is to equate the magnitudes of the tangential velocities at the collocation point of the two panels defining the trailing edge (see Fig. 4.23b). Remembering that the unit tangent vectors І, and tt+ are in opposite directions Condition (b) can be expressed mathematically as

N ^ ^

Y vjTtj + 7Г, д+і + U ■ І, = — Y + 7Г;+ід+1 + U • t,+1J (4.115)

Equations (4.114) and (4.115) combine to form a matrix equation that can be written as

Подпись: Ma = b(4.116)

where M is an (TV + 1) x (TV + 1) matrix and a and b are (TV + 1) column vectors. The elements of the matrix and vectors are as follows:

MU = NU і = 1,2, …,N j — 1,2,… ,7V + 1
Mn+j = TtJ + Tt+j j = 1,2,…, TV +1
a,- = <7,- ;= 1,2,…,7V and ajv+i = 7
bt = —U ■ ht /=1,2,…,7V
Ья-и = —U ■ (it + ?;+i)

Systems of Unear equations Uke (4.116) can be readily solved numerically for the unknowns at using standard methods (see Section 3.5). Also it is now possible to see why the Condition (c), requiring that the tangential velocities on the upper and lower surfaces both tend to zero at the trailing edge, cannot be satisfied in this sort of numerical scheme. Condition (c) could be imposed approximately by requiring, say, that the tangential velocities on panels t and t + 1 are both zero. Referring to Eqn (4.115) this approximate condition can be expressed mathematically as

Подпись: N

‘Y. OjT. j + 77^1 + U ■ І, — 0

Подпись: N

Y’. <rjT,+yj + 77)+i^+i + U ■ tt+i — 0 7=1

Equation (4.115) is now replaced by the above two equations so that M in Eqn

(4.116) is now a (N + 2) x (N + 1) matrix. The problem is now overdetermined, i. e. there is one more equation than the number of unknowns, and Eqn (4.116) can no longer be solved for the vector a, i. e. for the source and vortex strengths.

The calculation of the influence coefficients is at the heart of a panel method. In Section 3.5 a computational routine in FORTRAN 77 is given for computing the influence coefficients for the non-lifting case. It is shown below how this routine can be extended to include the calculation of the influence coefficients due to the vortices required for a lifting flow.

Two modifications to SUBROUTINE INFLU in Section 3.5 are required to extend it to the lifting case.

(1) The first two execution statements i. e.

DO 10 I = 1,N

10 READ(7,*) XP(I),YP(I)

should be replaced by

NPl =N+1 DO 10 I = 1,N AN(I, NPl) = 0.0 AT (I, NPl) = PI 10 READ(7,*)XP(I),YP(I)

The additional lines initialize the values of the influence coefficients, Nittf+1 and і in preparation for their calculation later in the program. Note that the initial value of TitN+1 is set at 7г because in Eqn (4.113)

^N+l, N—1 — % :

that is the tangential velocity induced on a panel by vortices of unit strength per unit length distributed over the same panel is, from Eqn (4.112), the same as the normal velocity induced by sources of unit strength per unit length distributed over the panel. This was shown to take the value tv in Eqn (3.100b).

(2) It remains to insert the two lines of instruction that calculate the additional influence coefficients according to Eqn (4.113). This is accomplished by inserting two additional lines below the last two execution statements in the routine, as shown

AN(I, J) = VX * NTIJ + VY * NNIJ Existing line

AT (I, J) = VX * TTIJ + VY * TNI J Existing line

AN (I, NPl) = AN (1, NPl) + VY * NTI J – VX * NNIJ New line ДТ(І, NPl) =AT(I, NPl) + VY * TTI J – VX * TNI J Newline

As with the original routine presented in Section 3.5 this modified routine is primarily intended for educational purposes. Nevertheless, as is shown by the exam­ple computation for a NACA 4412 aerofoil presented below, a computer program based on this routine and LU decomposition gives accurate results for the pressure distribution and coefficients of lift and pitching moment. The computation times required are typically a few seconds using a modern personal computer.

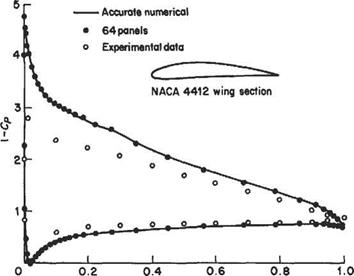
The NACA 4412 wing section has been chosen to illustrate the use of the panel method. The corresponding aerofoil profile is shown inset in Fig. 4.25. As can be seen it is a moderately thick aerofoil with moderate camber. The variation of the pressure coefficient around a NACA 4412 wing section at an angle of attack of 8 degrees is presented in Fig. 4.25. Experimental data are compared with the computed

Computational (panel) methods for two-dimensional lifting flows

Fig. 4.25 Variation of pressure coefficient around a NACA 4412 wing section at an angle of attack of 8°

results for 64 panels and 160 panels. The latter can be regarded as exact and are plotted as the solid line in the figure. It can be seen that the agreement between the two sets of computed data is very satisfactory. The agreement between the experi­mental and computed data is not good, especially for the upper surface. This is undoubtedly a result of fairly strong viscous effects at this relatively high angle of attack. The discrepancy between the computed and experimental pressure coeffi­cients is particularly marked on the upper surface near the leading edge. In this region, according to the computed results based on inviscid theory, there is a very strong favourable pressure gradient followed by a strong adverse one. This scenario is very likely to give rise to local boundary-layer separation (see Section 7.4.1 below) near the leading edge leading to greatly reduced peak suction pressures near the leading edge.

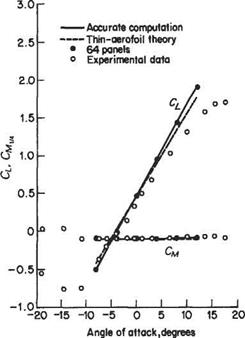
The computed and experimental lift and pitching-moment coefficients, CL and СМці are plotted as functions of the angle of attack in Fig. 4.26. Again there is good agreement between the two sets of computed results. For the reasons explained above the agreement between the computed and experimental lift coefficients is not all that satisfactory, especially at the higher angles of attack. Also shown in Fig. 4.25 are the predictions of thin-aerofoil theory – see Eqns (4.91) and (4.92). In view of the relatively poor agreement between theory and experiment evidenced in Fig. 4.26 it might be thought that there is little to choose between thin-aerofoil theory and computations using the panel method. For predictions of Cl and Cmva this is probably a reasonable conclusion, although for aerofoils that are thicker or more cambered than the NACA 4412, the thin-aerofoil theory would perform much less well. The great advantage of the panel method, however, is that it provides accurate results for the pressure distribution according to inviscid theory. Accordingly, a panel method can be used in conjunction with a method for computing the viscous (boundary-layer) effects and ultimately produce a corrected pressure distribution that is much closer to the experimental one (see Section 7.11).

Computational (panel) methods for two-dimensional lifting flows

Fig. 4.26 Variation of lift and moment coefficients with angle of attack for NACA 4412 aerofoil

Exercises

1 A thin two-dimensional aerofoil of chord c is operating at its ideal lift coefficient Си – Assume that the loading (i. e. the pressure difference across the aerofoil) varies linearly with its maximum value at the leading edge. Show that

Computational (panel) methods for two-dimensional lifting flows

where yc defines the camber line, a is the angle of incidence, and £ = xjc.

[Hint: Do not attempt to make the transformation x = (c/2)(l — cos 0), instead write the singular integral as follows:

Ґ—!—d£ = lim{ Ґ ‘-l-d£+ Ґ —Ц-d*}]

Jo г-оіУо £-£i Jti+e£-£i J

Then, using this result, show that the angle of incidence and the camber-line shape are given by

»=£; &=^{-(i-£)!in(,-0+£«-2)i„f}

[Hint: Write —1 = C—1 — C where 1 + C = 2ivalCL and the constant C is deter­mined by requiring that yc = 0 at £ = 0 and £ = 1.]

2 A thin aerofoil has a camber line defined by the relation yc = kc£(£ — l)(f – 2). Show that if the maximum camber is 2% of chord then к — 0.052. Determine the coefficients of lift and pitching moment, i. e. Cl and СщА, at 3° incidence.

(Answer: 0.535, —0.046)

3 Use thin-aerofoil theory to estimate the coefficient of lift at zero incidence and the pitching-moment coefficient Сд/1/4 for a NACA 8210 wing section.

(Answer: 0.789, —0.172)

4 Use thin-aerofoil theory to select a NACA four-digit wing section with a coefficient of lift at zero incidence approximately equal to unity. The maximum camber must be located at 40% chord and the thickness ratio is to be 0.10. Estimate the required maximum camber as a percentage of chord to the nearest whole number. [Hint: Use a spreadsheet program to solve by trial and error.]

(Answer: NACA 9410)

5 Use thin-aerofoil theory to select a NACA four-digit wing section with a coeffi­cient of lift at zero incidence approximately equal to unity and pitching-moment coefficient CMvA = -0.25. The thickness ratio is to be 0.10. Estimate the required maximum camber as a percentage of chord to the nearest whole number and its position to the nearest tenth of a chord. The CL value must be within 1% of the required value and СМщ within 3%. [Hint: Use a spreadsheet program to solve by trial and error.]

(Answer: NACA 7610, but NACA 9410 and NACA 8510 are also close.)

6 A thin two-dimensional flat-plate aerofoil is fitted with a trailing-edge flap of chord lOOe per cent of the aerofoil chord. Show that the flap effectiveness,

Подпись:ас,

Эц

ас,

da where a is the angle of incidence and 77 is the flap angle, is approximately 4у/ё/тг for flaps of small chord.

7 A thin aerofoil has a circular-arc camber line with a maximum camber of 0.025 chord. Determine the theoretical pitching-moment coefficient Сдг1/4 and indicate methods by which this could be reduced without changing maximum camber.

The camber line may be approximated by the expression

Подпись:Computational (panel) methods for two-dimensional lifting flowsyc = kc

where xl = x — 0.5c. (Answer: —0.0257t)

8

Computational (panel) methods for two-dimensional lifting flows

The camber line of a circular-arc aerofoil is given by

Derive an expression for the load distribution (pressure difference across the aerofoil) at incidence a. Show that the zero-lift angle ao = —2h, and sketch the load distribu­tion at this incidence. Compare the lift curve of this aerofoil with that of a flat plate.

9 A flat-plate aerofoil is aligned along the x-axis with the origin at the leading edge and trailing edge at x = c. The plate is at an angle of incidence a to a free stream of
air speed U. A vortex of strength Гу is located at (xv, yv). Show that the distribution, k(x), of vorticity along the aerofoil from x = 0 to x = c satisfies the integral equation

-L [‘«£Ldx = – Ua–hi*’ –

2ir J0 x – x (jcv – xi)2 + уі

where x = x is a particular location on the chord of the aerofoil. If xy = c/2 and у у = А» xv show that the additional increment of lift produced by the vortex (which could represent a nearby aerofoil) is given approximately by

37ГЙ2 ‘

Computational (panel) methods for two-dimensional lifting flows

The thickness problem for thin aerofoils

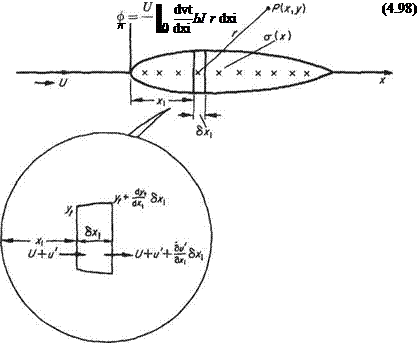
A symmetrical closed contour of small thickness-chord ratio may be obtained from a distribution of sources, and sinks, confined to the chord and immersed in a uniform undisturbed stream parallel to the chord. The typical model is shown in Fig. 4.21 where a(x) is the chordwise source distribution. It will be recalled that a system of discrete sources and sinks in a stream may result in a closed streamline.

Consider the influence of the sources in the element 6xi of chord, X from the origin. The strength of these sources is

6m = a{x)6x

The thickness problem for thin aerofoils Подпись: (4.95)

Since the elements of upper and lower surface are impermeable, the strength of the sources between *i and *i + &ci are found from continuity as:

Neglecting second-order quantities,

Подпись:6m = 2и^^-6х

QXl

The velocity potential at a general point P for a source of this strength is given by (see Eqn (3.6))

6ф = —In r

= -^<5*,lnr (4.97)

‘K d*i

where r = у (x — X])2 +y2. The velocity potential for the complete distribution of sources lying between 0 and c on the jc axis becomes

The thickness problem for thin aerofoils

Fig. 4.21

The thickness problem for thin aerofoils Подпись: (4.99)

and adding the free stream gives

Differentiating to find the velocity components

Подпись: (4.100) (4.101) дф TJ U fcdyt (x-Xi) dx ‘KjQdx(x-xly+y1 = дф^и rcdyt у

dy ‘xJo dxi (x — x])2 + y2 1

To obtain the tangential velocity at the surface of the aerofoil the limit as у —► 0 is taken for Eqn (4.100) so that

M= U + u’ = U + – f^—^—dxi (4.102)

irJo dxi x — xi

The coefficient of pressure is then given by

„ „и’ 2 rcdyt 1 ,

The theory in the form given above is of limited usefulness for practical aerofoil sections because most of these have rounded leading edges. At a rounded leading edge djt/dxi becomes infinite thereby violating the assumptions made to develop the thin-aerofoil theory. In fact from Example 4.3 given below it will be seen that the theory even breaks down when dyt/djti is finite at the leading and trailing edges. There are various refinements of the theory that partially overcome this problem[18] and others that permit its extension to moderately thick aerofoilsЛ

Example 4.3 Find the pressure distribution on the bi-convex aerofoil

Подпись:2"

(with origin at mid-chord) set at zero incidence in an otherwise undisturbed stream. For the given aerofoil

Подпись: VУі = ±

c 2c

and

= —4r— dxi c2

From above:

, и fc/1 t Xi и = — /—– —4-^ dxj

KJ-c/2 CZX~X 1

or

2 4f Г0/2 x,

= ~~3 —— d*i

The thickness problem for thin aerofoils The thickness problem for thin aerofoils

C2 J_c/2 X – Xi

Подпись: . x. 2x — c 1 H—In

Подпись: * ■к c
Подпись: с 2x+ c

Thus

At the mid-chord point:

Подпись:x = 0 C„ =

At the leading and trailing edges, x = ±c, Cp —> —oo. The latter result shows that the approx­imations involved in the linearization do not permit the method to be applied for local effects in the region of stagnation points, even when the slope of the thickness shape is finite.

Thickness problem for thin-aerofoil theory

Before extending the theory to take account of the thickness of aerofoil sections, it is useful to review the parts of the method. Briefly, in thin-aerofoil theory, above, the two-dimensional thin wing is replaced by the vortex sheet which occupies the camber surface or, to the first approximation, the chordal plane. Vortex filaments comprising the sheet extend to infinity in both directions normal to the plane, and all velocities are confined to the xy plane. In such a situation, as shown in Fig. 4.12, the sheet supports a pressure difference producing a normal (upward) increment of force of (p — pi)8s per unit spanwise length. Suffices 1 and 2 refer to under and upper sides of the sheet respectively. But from Bernoulli’s equation:

P ~ Pi = ^ p{u ~ u]) = p{u2 – щ) Ul 2 U’ (4.93)

Writing («2 + wi)/2 — U the free-stream velocity, and г/2 – u = к, the local loading on the wing becomes

ІР — pi)Ss — pUk6s (4.94)

The lift may then be obtained by integrating the normal component and similarly the pitching moment. It remains now to relate the local vorticity to the thin shape of the aerofoil and this is done by introducing the solid boundary condition of zero velocity normal to the surface. For the vortex sheet to simulate the aerofoil completely, the velocity component induced locally by the distributed vorticity must be sufficient to make the resultant velocity be tangential to the surface. In other words, the compon­ent of the free-stream velocity that is normal to the surface at a point on the aerofoil must be completely nullified by the normal-velocity component induced by the distributed vorticity. This condition, which is satisfied completely by replacing the surface line by a streamline, results in an integral equation that relates the strength of the vortex distribution to the shape of the aerofoil.

So far in this review no assumptions or approximations have been made, but thin – aerofoil theory utilizes, in addition to the thin assumption of zero thickness and small camber, the following assumptions:

(a) That the magnitude of total velocity at any point on the aerofoil is that of the local chordwise velocity = U + u1.

(b) That chordwise perturbation velocities г/ are small in relation to the chordwise component of the free stream U.

(c) That the vertical perturbation velocity v anywhere on the aerofoil may be taken as that (locally) at the chord.

Making use of these restrictions gives

– fCk dx

Jo 2tt x – ,n


and thus Eqn (4.42) is obtained:

• ‘4Ус _ 1 _ Г

.d* J Jo

k cbc

27Г X — X


(Eqn (4.42))


U


This last integral equation relates the chordwise loading, i. e. the vorticity, to the shape and incidence of the thin aerofoil and by the insertion of a suitable series expression for k in the integral is capable of solution for both the direct and indirect aerofoil problems. The aerofoil is reduced to what is in essence a thin lifting sheet, infinitely long in span, and is replaced by a distribution of singularities that satisfies the same conditions at the boundaries of the aerofoil system, i. e. at the surface and at infinity. Further, the theory is a linearized theory that permits, for example, the velocity at a point in the vicinity of the aerofoil to be taken to be the sum of the velocity components due to the various characteristics of the system, each treated separately. As shown in Section 4.3, these linearization assumptions permit an extension to the theory by allowing a perturbation velocity contribution due to thickness to be added to the other effects.

The NACA four-digit wing sections

According to Abbott and von Doenhoff when the NACA four-digit wing sections were first derived in 1932, it was found that the thickness distributions of efficient
wing sections such as the Gottingen 398 and the Clark Y were nearly the same when the maximum thicknesses were set equal to the same value. The thickness distribution for the NACA four-digit sections was selected to correspond closely to those for these earlier wing sections and is given by the following equation:

yt = ±5сф.2969у/1 – 0.1260£ – 0.3516£2 + 0.2843£3 – 0.1015^] (4.84)

where / is the maximum thickness expressed as a fraction of the chord and £ = xjc. The leading-edge radius is

Подпись: (4.85)rt = 1.1019c/2

It will be noted from Eqns (4.84) and (4.85) that the ordinate at any point is directly proportional to the thickness ratio and that the leading-edge radius varies as the square of the thickness ratio.

In order to study systematically the effect of variation in the amount of camber and the shape of the camber line, the shapes of the camber lines were expressed analytically as two parabolic arcs tangent at the position of the maximum camber­line ordinate. The equations used to define the camber line are:

Jc = -^2-(2/>£-£2) £<P

Подпись: (4.86)Ус = —’2-Id ~2P) + Ы-£2] Z>P (i – P)

where m is the maximum value of yc expressed as a fraction of the chord c, and p is the value of xjc corresponding to this maximum.

The numbering system for the NACA four-digit wing sections is based on the section geometry. The first integer equals ЮОте, the second equals 10p, and the final two taken together equal 100/. Thus the NACA 4412 wing section has 4 per cent camber at x = 0.4c from the leading edge and is 12 per cent thick.

To determine the lifting characteristics using thin-aerofoil theory the camber-line slope has to be expressed as a Fourier series. Differentiating Eqn (4.86) with respect to x gives

The NACA four-digit wing sections

dyc __ dpc/c) _ 2m dx d£ p2

The NACA four-digit wing sections

Changing variables from І to в where £ = (1 – cos &)j2 gives

Подпись: (4.87)= ~ (2p — 1 + cos в) в>в,

dx (l-p)2K J ~ 1

where ep is the value of в corresponding to x = pc.

Substituting Eqn (4.87) into Eqn (4.41) gives xj0 ax

1 f^p YYl 1 fЖ ЇУІ

= -/ —={2p — 1 + cos0)d0 + – ——— ~ (2p – 1 + cos в) йв

Wo P1 W^(i-p)

= ^[(^- 1)gf, + singf,] + 7r(i-j>)2 ^2P~ 1)(7r~gp)~sin^ (4-88)

Similarily from Eqn (4.42)

A = -/^cos0d0 xJo ax

2»j f ^p 0/И f ^

——=■ / {2p — I)cos0 + cos201d0-|——— = [O-p-I)cos0 + cos201d0

The NACA four-digit wing sections

T^rJ 0 7г( 1 — P) J 9„

Example 4.2 The NACA 4412 wing section

For a NACA 4412 wing section m = 0.04 and p = 0.4 so that

9P = cos-1 (1 – 2 x 0.4) = 78.46° = 1.3694 rad making these substitutions into Eqns (4.88) to (4.90) gives

A0 = 0.0090, Ai = 0.163 and A2 = 0.0228 Thus Eqns (4.43) and (4.47) give

CL = x(Ai- 2A0) + 2тга = тг(0.163 – 2 x 0.009) + 2тга = 0.456 + 6.2832a (4.91)

Смиі = ~(A1-A2) = -^(0.163-0.0228) = -0.110 (4.92)

In Section 4.10 (Fig. 4.26), the predictions of thin-aerofoil theory, as embodied in Eqns (4.91) and (4.92), are compared with accurate numerical solutions and experimental data. It can be seen that the predictions of thin-aerofoil theory are in satisfactory agreement with the accurate numerical results, especially bearing in mind the considerable discrepancy between the latter and the experimental data.

Particular camber lines

It has been shown that quite general camber lines may be used in the theory satisfactorily and reasonable predictions of the aerofoil characteristics obtained. The reverse problem may be of more interest to the aerofoil designer who wishes to obtain the camber-line shape to produce certain desirable characteristics. The general design problem is more comprehensive than this simple statement suggests and the theory so far dealt with is capable of considerable extension involving the introduc­tion of thickness functions to give shape to the camber line. This is outlined in Section 4.9.

4.8.1 Cubic camber lines

Starting with a desirable aerodynamic characteristic the simpler problem will be considered here. Numerous authorities* have taken a cubic equation as the general shape and evaluated the coefficients required to give the aerofoil the characteristic of a fixed centre of pressure. The resulting camber line has the reflex trailing edge which is the well-known feature of this characteristic.

Example 4.1 Find the cubic camber line that will provide zero pitching moment about the quarter chord point for a given camber.

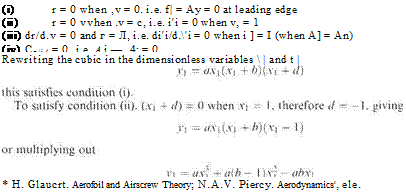
The general equation for a cubic can be written as г = a’.(x + />’)(.v + </’) with the origin at the leading edge. For convenience the new variables. V| — а/с and Vi = rT can be introduced. 6 is the camber. The conditions to be satisfied are that:

Подпись:(4.76)

(4.77)

(4.78)

Differentiating Eqn (4.78) to satisfy (iii)

Подпись: (4.79)= 3ax +2a(b — l)xi – ab = 0 when yi = 1

and if xq corresponds to the value of X when y = l, i. e. at the point of maximum displace­ment from the chord the two simultaneous equations are

To satisfy (iv) above, A and A2 must be found, dyi/dxi can be converted to expressions suitable for comparison with Eqn (4.35) by writing

c 1

X = -(l — cost?) or *1 = -(1 — cost?)

= ^a(l — 2 cos в + cos2 в) +a(b — 1) — a(b — l)cos 8 — ab = + ab — a — abj — ^a + ab — aj cos в – l-^acos2 в

§+-)■

Подпись: (4.80)

Подпись: dyc _ 6 dyi _ 6 dx cdxi c Подпись: 3 , -acos 64 Подпись: I cos в — ^ Подпись: (4.81)

1 = axq + a(b — l)x% — abxo 0 = 3 ax% + 2 a(b — l)xo — ab

Comparing Eqn (4.81) and (4.35) gives

ab 3 6 96

0_ 4с + 8Яс~8с

3a S A2=Tc

Thus to satisfy (iv) above, A = A2, i. e.

Подпись:(a 6 36 . . , 7

-І2 + аЬ)-Га8 c ®vmg b = ~l

The quadratic in Eqn (4.80) gives for x0 on cancelling a,

-2(b – 1) ± ф2(Ь-1)2+4хЗЬ (1 – b)± VF+T+T

Xq —————— 2—————— ————- t———-

From Eqn (4.82), b = – – gives

О

22.55 7.45

*0 = ^Г or -2Г

i. e. taking the smaller value since the larger only gives the point of reflexure near the trailing edge:

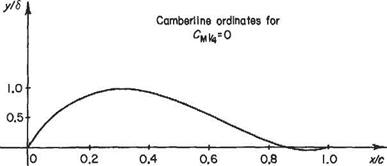
у = 6 when x = 0.31 x chord Substituting xo = 0.31 in the cubic of Eqn (4.80) gives

Подпись: = 8.281

0.121

The camber-line equation then is

Подпись:У = 8.285xi ^ (xi – 1)

> = 8.285^x?-yx?+|xi

This cubic camber-line shape is shown plotted on Fig. 4.20 and the ordinates given on the inset table.

Lift coefficient The lift coefficient is given from Eqn (4.43) by

Cl = 2тг — Л0 +

Particular camber lines

So with the values of Aq and A given above

giving a no-lift angle

ao = —0.518- radians c

or with /3 = the percentage camber = 1005/c

cxq = —0.3/3 degrees

The load distribution From Eqn (4.40)

, „rtf 1.04Л1 +cos0 3.125. . 3.125. „.1

k = 2U{[a———- —r-^—h———— sin 5 +——– sm20^

(V c J sin5 с c )

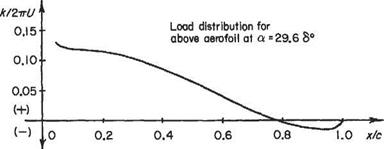
for the first three terms. This has been evaluated for the incidence a° = 29.6(5/c) and the result shown plotted and tabulated in Fig. 4.20.

Particular camber lines

It should be noted that the leading-edge value has been omitted, since it is infinite according to this theory. This is due to the term

becoming infinite at в = 0. When

a fS 5

a = – (- I = 1.04­8 c) c

Подпись:(a — Aq) becomes zero so (a — Aq)

becomes zero. Then the intensity of circulation at the leading edge is zero and the stream flows smoothly on to the camber line at the leading edge, the leading edge being a stagnation point.

Particular camber lines

x/c

0

0.05

0.1

0.15

0.2

0.25

0.3

0.35

0.4

0.45

y/b

0

0.324

0.577

0.765

0.894

0.970

0.999

0.988

0.943

0.870

x/c

0.5

0.55

0.6

0.65

0.7

0.75

0.8

0.85

0.9

0.95

1.0

y/S

0.77Б

0.666

0.546

0.424

0.304

0.194

0.099

0.026

0.019

0.03

0

Particular camber lines

x/c

0

0.05

0.1

0.15

0.2

0.25

0.3

0.35

0.4

0.45

k/ZrrU

CO

0.127

0.123

0.121

0JI8

0.112

0.105

0.096

0.087

0.076

x/c

0.5

0.55

0.6

0.65

0.7

0.75

0.8

0.85

0.9

0.95

1.0

k/tirU

0.065

0.053

0.042

0JD30

0.019

0.009

0.006

5.008

0.013

0.014

0

Fig. 4.20

This is the so-called Theodorsen condition, and the appropriate Cl is the ideal, optimum, or design lift coefficient, Сюpt-

The normal force and pitching moment derivatives due to pitching[17]

4.7.1 (Zq)(Mq) wing contributions

Thin-aerofoil theory can be used as a convenient basis for the estimation of these important derivatives. Although the use of these derivatives is beyond the general scope of this volume, no text on thin-aerofoil theory is complete without some reference to this common use of the theory.

When an aeroplane is rotating with pitch velocity q about an axis through the centre of gravity (CG) normal to the plane of symmetry on the chord line produced (see Fig. 4.18), the aerofoil’s effective incidence is changing with time as also, as a consequence, are the aerodynamic forces and moments.

The rates of change of these forces and moments with respect to the pitching velocity q are two of the aerodynamic quasi-static derivatives that are in general commonly abbreviated to derivatives. Here the rate of change of normal force on the aircraft, i. e. resultant force in the normal or Z direction, with respect to pitching velocity is, in the conventional notation, dZ/dq. This is symbolized by Zq. Similarly the rate of change of M with respect to q is QMjdq = Mq.

In common with other aerodynamic forces and moments these are reduced to non­dimensional or coefficient form by dividing through in this case by pVI{ and [>VI~ respectively, where /, is the tail plane moment arm, to give the non-dimensional

The normal force and pitching moment derivatives due to pitching[17]

The normal force and pitching moment derivatives due to pitching[17]

Fig. 4.18 normal force derivative due to pitching zq, and the non-dimensional pitching moment derivative due to pitching mq.

The contributions to these two, due to the mainplanes, can be considered by replacing the wing by the equivalent thin aerofoil. In Fig. 4.19, the centre of rotation (CG) is a distance he behind the leading edge where c is the chord. At some point jc from the leading edge of the aerofoil the velocity induced by the rotation of the aerofoil about the CG is v’ = —q(hc — jc). Owing to the vorticity replacing the camber line a velocity v is induced. The incident flow velocity is V inclined at a to the chord line, and from the condition that the local velocity at jc must be tangential to the aerofoil (camber line) (see Section 4.3) Eqn (4.14) becomes for this case or

(4.59)

and with the substitution jc = — (1 — cos в)

dy v qc (, 1 cos0

The normal force and pitching moment derivatives due to pitching[17] Подпись: (4.60)

S-“=r’v(A-2 + —J

but in the pitching case the loading distribution would be altered to some general form given by, say,

Подпись: (4.61)

The normal force and pitching moment derivatives due to pitching[17]

— = Bq + cos пв

Fig. 4.19

where the coefficients are changed because of the relative flow changes, while the camber-line shape remains constant, i. e. the form of the function remains the same but the coefficients change. Thus in the pitching case

For the theoretical estimation of rt/ and т, ґ of the complete aircraft, the contribu­tions of the tailplane must be added. These are given here for completeness.

The normal force and pitching moment derivatives due to pitching[17](4.75)

where the terms with dashes refer to tailplane data.