Category Aerodynamics for Engineering Students

Effect of Reynolds number on the CL: a curve

Reduction of Reynolds number moves the transition point of the boundary layer rearwards on the upper surface of the wing. At low values of Re this may permit a laminar boundary layer to extend into the adverse pressure gradient region of the aerofoil. As a laminar boundary layer is much less able than a turbulent boundary layer to overcome an adverse pressure gradient, the flow will separate from the surface at a lower angle of incidence. This causes a reduction of This is a problem that exists in model testing when it is always difficult to match full-scale and model Reynolds numbers. Transition can be fixed artificially on the model by rough­ening the model surface with carborundum powder at the calculated full-scale point.

Drag coefficient: lift coefficient

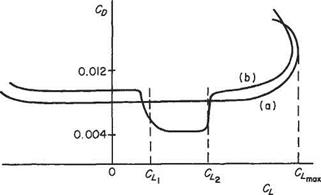
For a two-dimensional wing at low Mach numbers the drag contains no induced or wave drag, and the drag coefficient is Сд0. There are two distinct forms of variation of Cd with Cl, both illustrated in Fig. 1.26.

Curve (a) represents a typical conventional aerofoil with Сд0 fairly constant over the working range of lift coefficient, increasing rapidly towards the two extreme values of Cl- Curve (b) represents the type of variation found for low-drag aerofoil sections. Over much of the Cl range the drag coefficient is rather larger than for the conventional type of aerofoil, but within a restricted range of lift coefficient (Cl, to C^) the profile drag coefficient is considerably less. This range of CL is known as the favourable range for the section, and the low drag coefficient is due to the design of the aerofoil section, which permits a comparatively large extent of laminar boundary layer. It is for this reason that aerofoils of this type are also known as laminar-flow sections. The width and depth of this favourable range or, more graphically, low-drag bucket, is determined by the shape of the thickness distribu­tion. The central value of the lift coefficient is known as the optimum or ideal lift coefficient, Clor Сц ■ Its value is decided by the shape of the camber line, and the degree of camber, and thus the position of the favourable range may be placed where desired by suitable design of the camber line. The favourable range may be placed to cover the most common range of lift coefficient for a particular aeroplane, e. g. may be slightly larger than the lift coefficient used on the climb, and Си may be

Effect of Reynolds number on the CL: a curve

Fig. 1.26 Typical variation of sectional drag coefficient with lift coefficient

slightly less than the cruising lift coefficient. In such a case the aeroplane will have the benefit of a low value of the drag coefficient for the wing throughout most of the flight, with obvious benefits in performance and economy. Unfortunately it is not possible to have large areas of laminar flow on swept wings at high Reynolds numbers. To maintain natural laminar flow, sweep-back angles are limited to about 15°.

The effect of a finite aspect ratio is to give rise to induced drag and this drag coefficient is proportional to C, and must be added to the curves of Fig. 1.26.

Drag coefficient: (lift coefficient)2

Since

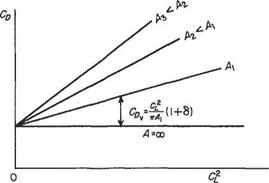
it follows that a curve of against C will be a straight line of slope (1 + fi)/nA. If the curve Cd0 against C from Fig. 1.26 is added to the induced drag coefficient, that is to the straight line, the result is the total drag coefficient variation with C2L, as shown in Fig. 1.27 for the two types of section considered in Fig. 1.26. Taking an

Effect of Reynolds number on the CL: a curve

Fig. 1.27 Variation of total wing drag coefficient with (lift coefficient)2

Effect of Reynolds number on the CL: a curve

Fig. 1.28 Idealized variation of total wing drag coefficient with (lift coefficient)2 for a family of three­dimensional wings of various aspect ratios

idealized case in which Сд0 is independent of lift coefficient, the CDv:(CL)2 curve for a family of wings of various aspect ratios as is shown in Fig. 1.28.

Pitching moment coefficient

Effect of Reynolds number on the CL: a curve

In Section 1.5.4 it was shown that

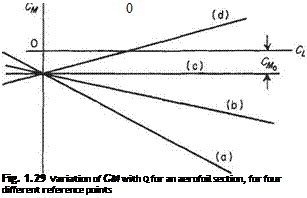
the value of the constant depending on the point of the aerofoil section about which CM is measured. Thus a curve of Cm against Cl is theoretically as shown in Fig. 1.29.

Line (a) for which dCM/dCL — -1 is for Cm measured about the leading edge. Line (c), for which the slope is zero, is for the case where Cm is measured about the aerodynamic centre. Line (b) would be obtained if Cm were measured about a point between the leading edge and the aerodynamic centre, while for (d) the reference point is behind the aerodynamic centre. These curves are straight only for moderate values of Cl – As the lift coefficient approaches C^, the Cm against Cl curve departs from the straight line. The two possibilities are sketched in Fig. 1.30.
Effect of Reynolds number on the CL: a curve Effect of Reynolds number on the CL: a curve

For curve (a) the pitching moment coefficient becomes more negative near the stall, thus tending to decrease the incidence, and unstall the wing. This is known as a stable break. Curve (b), on the other hand, shows that, near the stall, the pitching moment coefficient becomes less negative. The tendency then is for the incidence to

Fig. 1.30 The behaviour of the pitching moment coefficient in the region of the stalling point, showing stable and unstable breaks

increase, aggravating the stall. Such a characteristic is an unstable break. This type of characteristic is commonly found with highly swept wings, although measures can be taken to counteract this undesirable behaviour.

Exercises

1 Verify the dimensions and units given in Table 1.1.

2 The constant of gravitation G is defined by

Подпись: F = GmM

where F is the gravitational force between two masses m and M whose centres of mass are distance r apart. Find the dimensions of G, and its units in the SI system.

{Answer. MT2L-3, kg s2 m-3)

3 Assuming the period of oscillation of a simple pendulum to depend on the mass of

the bob, the length of the pendulum and the acceleration due to gravity g, use the theory of dimensional analysis to show that the mass of the bob is not, in fact, relevant and find a suitable expression for the period of oscillation in terms of the other variables. {Answer, t = cy/IJg)

4 A thin flat disc of diameter D is rotated about a spindle through its centre at a speed of u> radians per second, in a fluid of density p and kinematic viscosity v. Show that the power P needed to rotate the disc may be expressed as:

Effect of Reynolds number on the CL: a curve

(a)

Note: for (a) solve in terms of the index of v and for (b) in terms of the index of to.

Further, show that cuD2/v, PDjpv3 and P/pu^D5 are all non-dimensional quan­tities. (CU)

5 Spheres of various diameters D and densities a are allowed to fall freely under gravity through various fluids (represented by their densities p and kinematic viscosities v) and their terminal velocities V are measured.

Find a rational expression connecting V with the other variables, and hence suggest a suitable form of graph in which the results could be presented.

Note: there will be 5 unknown indices, and therefore 2 must remain undetermined, which will give 2 unknown functions on the right-hand side. Make the unknown indices those of a and v.

Подпись: [Щ

Подпись: against
Effect of Reynolds number on the CL: a curve

{Answer: V = [Dg f h^ VDg’j, therefore plot curves of

6 An aeroplane weighs 60 000 N and has a wing span of 17 m. A l/10th scale model is tested, flaps down, in a compressed-air tunnel at 15 atmospheres pressure and 15 °С

at various speeds. The maximum lift on the model is measured at the various speeds, with the results as given below:

Speed (ms-1) 20 21 22 23 24

Maximum lift (N) 2960 3460 4000 4580 5200

Estimate the minimum flying speed of the aircraft at sea-level, i. e. the speed at which the maximum lift of the aircraft is equal to its weight. (Answer: 33 m s"1)

7 The pressure distribution over a section of a two-dimensional wing at 4° incidence

may be approximated as follows: Upper surface; Cp constant at —0.8 from the leading edge to 60% chord, then increasing linearly to +0.1 at the trailing edge: Lower surface; Cp constant at —0.4 from the LE to 60% chord, then increasing linearly to +0.1 at the ТЕ. Estimate the lift coefficient and the pitching moment coefficient about the leading edge due to lift. {Answer. 0.3192; —0.13)

8 The static pressure is measured at a number of points on the surface of a long circular cylinder of 150 mm diameter with its axis perpendicular to a stream of standard density at 30 ms-1. The pressure points are defined by the angle в, which is the angle subtended at the centre by the arc between the pressure point and the front stagnation point. In the table below values are given of p — po, where p is the pressure on the surface of the cylinder and po is the undisturbed pressure of the free stream, for various angles в, all pressures being in N m-2. The readings are identical for the upper and lower halves of the cylinder. Estimate the form pressure drag per metre run, and the corresponding drag coefficient.

в (degrees) 0 10 20 30 40 50 60 70 80 90 100 110 120

p-po (Nm-2) +569 +502 +301 -57 -392 -597 -721 -726 -707 -660 -626 -588 -569

For values of в between 120° and 180°, p – po is constant at -569 Nm 2.

(Answer: CD = 0.875, D = 7.25 Nm"1)

9 A sailplane has a wing of 18 m span and aspect ratio of 16. The fuselage is 0.6 m wide at the wing root, and the wing taper ratio is 0.3 with square-cut wing-tips. At a true air speed of 115 km h"1 at an altitude where the relative density is 0.7 the lift and drag are 3500 N and 145 N respectively. The wing pitching moment coefficient about the j-chord point is —0.03 based on the gross wing area and the aerodynamic mean chord. Calculate the lift and drag coefficients based on the gross wing area, and the pitching moment about the | chord point.

(Answer: Cl = 0.396, Сд = 0.0169, M = —322Nm since сд = 1.245m)

10 Describe qualitatively the results expected from the pressure plotting of a con­

ventional, symmetrical, low-speed, two-dimensional aerofoil. Indicate the changes expected with incidence and discuss the processes for determining the resultant forces. Are any further tests needed to complete the determination of the overall forces of lift and drag? Include in the discussion the order of magnitude expected for the various distributions and forces described. (U of L)

11 Show that for geometrically similar aerodynamic systems the non-dimensional

force coefficients of lift and drag depend on Reynolds number and Mach number only. Discuss briefly the importance of this theorem in wind-tunnel testing and simple performance theory. (U of L)

Aerofoil characteristics

Lift coefficient: incidence

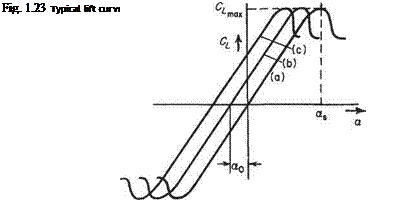
This variation is illustrated in Fig. 1.23 for a two-dimensional (infinite span) wing. Considering first the full curve (a) which is for a moderately thick (13%) section of
zero camber, it is seen to consist of a straight line passing through the origin, curving over at the higher values of Cl, reaching a maximum value of Сгшд at an incidence of as, known as the stalling point. After the stalling point, the lift coefficient decreases, tending to level off at some lower value for higher incidences. The slope of the straight portion of the curve is called the two-dimensional lift-curve slope, (dCi/da)^ or floe. Its theoretical value for a thin section (strictly a curved or flat plate) is 27Г per radian (see Section 4.4.1). For a section of finite thickness in air, a more accurate empirical value is

Aerofoil characteristics

Aerofoil characteristics

(1.66)

The value of Сis a very important characteristic of the aerofoil since it determines the minimum speed at which an aeroplane can fly. A typical value for the type of aerofoil section mentioned is about 1.5. The corresponding value of as would be around 18°.

Curves (b) and (c) in Fig. 1.23 are for sections that have the same thickness distribution but that are cambered, (c) being more cambered than (b). The effect of camber is merely to reduce the incidence at which a given lift coefficient is produced, i. e. to shift the whole lift curve somewhat to the left, with negligible change in the value of the lift-curve slope, or in the shape of the curve. This shift of the curve is measured by the incidence at which the lift coefficient is zero. This is the no-lift incidence, denoted by Qo, and a typical value is —3°. The same reduction occurs in as. Thus a cambered section has the same value of as does its thickness distribu­tion, but this occurs at a smaller incidence.

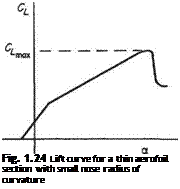
Modern, thin, sharp-nosed sections display a slightly different characteristic to the above, as shown in Fig. 1.24. In this case, the lift curve has two approximately straight portions, of different slopes. The slope of the lower portion is almost the same as that for a thicker section but, at a moderate incidence, the slope takes a different, smaller value, leading to a smaller value of C^, typically of the order of unity. This change in the lift-curve slope is due to a change in the type of flow near the nose of the aerofoil.

Подпись: Fig. 1.24 Lift curve for a thin aerofoil section with small nose radius of curvature

Effect of aspect ratio on the CL a curve

Aerofoil characteristics

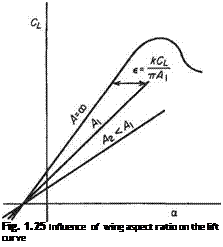
The induced angle of incidence є is given by

where A is the aspect ratio and thus

Подпись: kCL 7Г A «ос = a –

Considering a number of wings of the same symmetrical section but of different aspect ratios the above expression leads to a family of Cl, a curves, as in Fig. 1.25, since the actual lift coefficient at a given section of the wing is equal to the lift coefficient for a two-dimensional wing at an incidence of a^.

Подпись: Fig. 1.25 Influence of wing aspect ratio on the lift curve

For highly swept wings of very low aspect ratio (less than 3 or so), the lift curve slope becomes very small, leading to values of С^и of about 1.0, occurring at stalling incidences of around 45°. This is reflected in the extreme nose-up landing attitudes of many aircraft designed with wings of this description.

Induced drag

Section 5.5 below should also be referred to. Consider what is happening at some point у along the wing span (Fig. 1.21). Each of the trailing vortices produces a downwards component of velocity, w, at y, known as the downwash or induced velocity (see Section 5.5.1). This causes the flow over that section of the wing to be inclined slightly downwards from the direction of the undisturbed stream V (Fig. 1.22) by the angle e, the induced angle of incidence or downwash angle. The local flow is also at a slightly different speed, q.

If the angle between the aerofoil chord line and the direction of the undisturbed stream, the geometric angle of incidence, is a, it is seen that the angle between the chord line and the actual flow at that section of the wing is equal to а—e, and this is called the effective incidence a^. It is this effective incidence that determines the lift coefficient at that section of the wing, and thus the wing is lifting less strongly than the geometric incidence would suggest. Since the circulation and therefore w and є increase with lift coefficient, it follows that the lift of a three-dimensional wing increases less rapidly with incidence than does that for a two-dimensional wing, which has no trailing vortices.

Now the circulation round this section of the wing will have a value Г appro­priate to «ос, and the lift force corresponding to this circulation will be pqT per unit length, acting perpendicular to the direction of q as shown, i. e. inclined backwards from the vertical by the angle e. This force therefore has a component perpendicular to the undisturbed stream V, that, by definition, is called the lift, and is of magnitude

V

/ = pqT cose = pqT — = pVY per unit length 4

There is also a rearwards component of magnitude

Ellipto-Zhukovsky section at the mid-section of a three-dimensional wing. Geometric incidence = 6"

Reynolds number=4.8×10⁵

Induced drag

Induced drag

Fig. 1.20 Pressure distribution on an aerofoil surface

w

d = pqT sine = pqT— = pwT per unit length

q

This rearwards component must be reckoned as a drag and is, in fact, the induced drag. Thus the induced drag arises essentially from the downwards velocity induced over the wing by the wing-tip vortices.

Induced drag

z/c

Induced drag

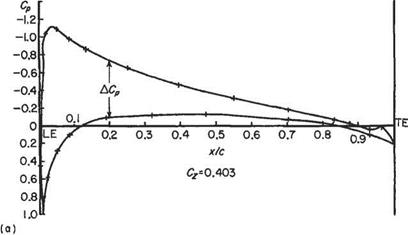
CL = Cz cos a – Cx sin a = +0-402 CD = Cz sin a + Cx cos a = +0-0182


_ CM+CMz – -0-096


dCM/dCL ^ 0-24


Fig. 1.20 (Continued)


Induced drag

Fig. 1.21 The simplified horseshoe vortex system


D

Induced drag

Fig. 1.22 Flow conditions and forces at a section of a three-dimensional lifting wing


Induced drag Подпись: (Eqn(5.64))

The further apart the wing-tip vortices the less will be their effectiveness in producing induced incidence and drag. It is therefore to be expected that these induced quantities will depend on the wing aspect ratio, (AR). Some results obtained in Chapter 5 below are:

where floo is the lift curve slope for the two-dimensional wing, and the trailing vortex drag coefficient Сд„ is given by

Подпись:Dv

‘{pV^S tv (AR) where 6 is a small positive number, constant for a given wing.

Lift-dependent drag

It has been seen that the induced drag coefficient is proportional to Cf, and may exist in an inviscid fluid. On a complete aircraft, interference at wing/fuselage, wing/ engine-nacelle, and other such junctions leads to modification of the boundary layers over the isolated wing, fuselage, etc. This interference, which is actually part of the profile drag, usually varies with the lift coefficient in such a manner that it may be treated as of the form (a + bCj). The part of this profile drag coefficient which is represented by the term (bCj) may be added to the induced drag. The sum so obtained is known as the lift-dependent drag coefficient. The lift-dependent drag is actually defined as ‘the difference between the drag at a given lift coefficient and the drag at some datum lift coefficient’.

If this datum lift coefficient is taken to be zero, the total drag coefficient of a complete aeroplane may be taken, to a good approximation in most cases, as

Cd = Cd0 + kC2L

where Cd0 is the drag coefficient at zero lift, and kC is the lift-dependent drag coefficient, denoted by Cdl-

Estimation of the coefficients of lift, drag and pitching moment from the pressure distribution

Let Fig. 1.18 represent an aerofoil at an angle of incidences to a fluid flow travelling from left to right at speed V. The axes Ox and Oz are respectively aligned along and perpendicular to the chord line. The chord length is denoted by c.

Taking the aerofoil to be a wing section of constant chord and unit spanwise length, let us consider the forces acting on a small element of the upper aerofoil surface having length 6s. The inward force perpendicular to the surface is given by pu6s. This force may be resolved into components 6X and 6Z in the x and z directions. It can be seen that

Подпись:Подпись: (1.57)

Estimation of the coefficients of lift, drag and pitching moment from the pressure distribution

6ZU — —pu cos є

and from the geometry

6s cose = 6x
so that

SZU = —pu6x per unit span Similarly, for the lower surface

6Z( = pe6x per unit span

We now add these two contributions and integrate with respect to x between x = 0 and x = c to get

Подпись: Pedx– Г Pudx+ f Jo Jo

But we can always subtract a constant pressure from both pu and pe without altering the value of Z, so we can write

Подпись:

Estimation of the coefficients of lift, drag and pitching moment from the pressure distribution

-[ (Pu~Poc)dx+ [ {pe~Poo)d>

JO Jo

where px is the pressure in the free stream (we could equally well use any other constant pressure, e. g. the stagnation pressure in the free stream).

Estimation of the coefficients of lift, drag and pitching moment from the pressure distribution

Equation (1.58) can readily be converted into coefficient form. Recalling that the aerofoil section is of unit span, the area S = 1 x c = c, so we obtain

we see that

Подпись: (1.59a)Cz — f (CPu Cpe)d(x/c)

Jo

Estimation of the coefficients of lift, drag and pitching moment from the pressure distribution

or, simply

Cz = <p Cpcosed(.s/c) = <p Cpd(x/c), (1.59b)

Je Jc

where the contour integral is evaluated by following an anti-clockwise direction around the contour C of the aerofoil.

Similar arguments lead to the following relations for X.

6Xu—pu6s sine, SXe = pe6s sine, 6s sin є = 6z,

giving

c*=i Cp sined(s/c) = У Cpd(z/c) = J ACpd^-j, (1.60)

where z^ and zm( are respectively the maximum and minimum values of z, and ACP is the difference between the values of Cp acting on the fore and rear points of an aerofoil for a fixed value of z.

The pitching moment can also be calculated from the pressure distribution. For simplicity, the pitching moment about the leading edge will be calculated. The contribution due to the force 6Z acting on a slice of aerofoil of length 6x is given by

6M = (pu -Pe)x6x – [{pu – Poo) (pt – Poo)]*#;*;

so, remembering that the coefficient of pitching moment is defined as

_ M M. , . „

= mthlst! ase’ as s = c’

the coefficient of pitching moment due to the Z force is given by

CmZ = “i Cp cd(c) = l [Cp" _ Cpf] cd(c) (L61)

Similarly, the much smaller contribution due to the X force may be obtained as

CUX = – jf cr, intjdg = d© (1«)

The integrations given above are usually performed using a computer or graphically.

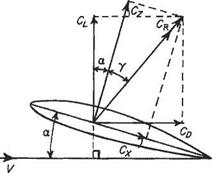
The force coefficients Cx and Cz are parallel and perpendicular to the chord line, whereas the more usual coefficients Cl and Co are defined with reference to the direction of the free-stream air flow. The conversion from one pair of coefficients to the other may be carried out with reference to Fig. 1.19, in which, Cr, the coefficient of the resultant aerodynamic force, acts at an angle 7 to Cz – CR is both the resultant of Cx and Cz, and of CL and CD; therefore from Fig. 1.19 it follows that

Cl = Cr cos(7 + a) = Cr cos 7 cos a — Cr sin 7 sin a

But Cr cos 7 = Cz and Cr sin 7 = Cx, so that

Cl = Cz cos a — Cx sin a. (1.63)

Similarly

Estimation of the coefficients of lift, drag and pitching moment from the pressure distribution

Fig. 1.19

The total pitching moment coefficient is

Cm = Cm, + Cm, (1.65)

In Fig. 1.20 are shown the graphs necessary for the evaluation of the aerodynamic coefficients for the mid-section of a three-dimensional wing with an ellipto – Zhukovsky profile.

Profile drag (or boundary-layer drag)

The profile drag is the sum of the skin-friction and form drags. See also the formal definition given at the beginning of the previous item.

Comparison of drags for various types of body

Normal flat plate (Fig. 1.14)

In the case of a flat plate set broadside to a uniform flow, the drag is entirely form drag, coming mostly from the large negative pressure coefficients over the rear face. Although viscous tractions exist, they act along the surface of the plate, and therefore have no rearwards component to produce skin-friction drag.

Profile drag (or boundary-layer drag)

Fig. 1.14 Pressure on a normal flat plate

Parallel flat plate (Fig. 1.15)

In this case, the drag is entirely skin-friction drag. Whatever the distribution of pressure may be, it can have no rearward component, and therefore the form drag must be zero.

Circular cylinder (Fig. 1.16)

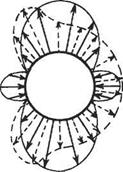
Figure 1.16 is a sketch of the distribution of pressure round a circular cylinder in inviscid flow (solid lines) (see Section 3.3.9 below) and in a viscous fluid (dotted lines). The perfect symmetry in the inviscid case shows that there is no resultant force on the cylinder. The drastic modification of the pressure distribution due to viscosity is apparent, the result being a large form drag. In this case, only some 5% of the drag is skin-friction drag, the remaining 95% being form drag, although these proportions depend on the Reynolds number.

Aerofoil or streamlined strut

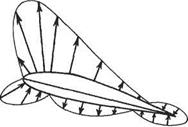
The pressure distributions for this case are given in Fig. 1.13. The effect of viscosity on the pressure distribution is much less than for the circular cylinder, and the form drag is much lower as a result. The percentage of the total drag represented by skin – friction drag depends on the Reynolds number, the thickness/chord ratio, and a number of other factors, but between 40% and 80% is fairly typical.

Подпись: Inviscid flow Real fluid, Re> O6
Profile drag (or boundary-layer drag)

Fig. 1.15 Viscous tractions on a tangential flat plate

Fig. 1.16 Pressure on a circular cylinder with its axis normal to the stream (see also Fig. 3.23)

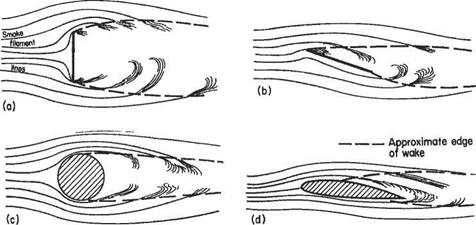
Rg. 1.17 The behaviour of smoke filaments in the flows past various bodies, showing the wakes, (a) Normal flat plate. In this case the wake oscillates up and down at several cycles per second. Half a cycle later the picture would be reversed, with the upper filaments curving back as do the lower filaments in this sketch, (b) Flat plate at fairly high incidence, (c) Circular cylinder at low Re. For pattern at higher Re, see Fig. 7.14. (d) Aerofoil section at moderate incidence and low Re

The wake

Behind any body moving in air is a wake, just as there is a wake behind a ship. Although the wake in air is not normally visible it may be felt, as when, for example, a bus passes by. The total drag of a body appears as a loss of momentum and increase of energy in this wake. The loss of momentum appears as a reduction of average flow speed, while the increase of energy is seen as violent eddying (or vorticity) in the wake. The size and intensity of the wake is therefore an indication of the profile drag of the body. Figure 1.17 gives an indication of the comparative widths of the wakes behind a few bodies.

Types of drag

Attempts have been made to rationalize the definitions and terminology associated with drag[3]. On the whole the new terms have not been widely adopted. Here we will use the widely accepted traditional terms and indicate alternatives in parentheses.

Total drag

This is formally defined as the force corresponding to the rate of decrease in momen­tum in the direction of the undisturbed external flow around the body, this decrease being calculated between stations at infinite distances upstream and downstream of the body. Thus it is the total force or drag in the direction of the undisturbed flow. It is also the total force resisting the motion of the body through the surrounding fluid.

There are a number of separate contributions to total drag. As a first step it may be divided into pressure drag and skin-friction drag.

Skin-friction drag (or surface-friction drag)

This is the drag that is generated by the resolved components of the traction due to the shear stresses acting on the surface of the body. This traction is due directly to viscosity and acts tangentially at all points on the surface of the body. At each point it has a component aligned with but opposing the undisturbed flow (i. e. opposite to the direction of flight). The total effect of these components, taken (i. e. integrated) over the whole exposed surface of the body, is the skin-friction drag. It could not exist in an invisidd flow.

Pressure drag

This is the drag that is generated by the resolved components of the forces due to pressure acting normal to the surface at all points. It may itself be considered as consisting of several distinct contributions:

(i) Induced drag (sometimes known as vortex drag);

(ii) Wave drag; and

(iii) Form drag (sometimes known as boundary-layer pressure drag).

Induced drag (or vortex drag)

This is discussed in more detail in Sections 1.5.7 and 5.5. For now it may be noted that induced drag depends on lift, does not depend directly on viscous effects, and can be estimated by assuming inviscid flow.

Wave drag

This is the drag associated with the formation of shock waves in high-speed flight. It is described in more detail in Chapter 6.

Form drag (or boundary-layer pressure drag)

This can be defined as the difference between the profile drag and the skin-friction drag where the former is defined as the drag due to the losses in total pressure and

Types of drag
Подпись: (a)
Types of drag

Fig. 1.13 (a) The displacement thickness of the boundary layer (hatched area) represents an effective change to the shape of the aerofoil. (Boundary-layer thickness is greatly exaggerated in this sketch.) (b) Pressure-distribution on an aerofoil section in viscous flow (dotted line) and inviscid flow (full line)

total temperature in the boundary layers. But these definitions are rather unhelpful for giving a clear idea of the physical nature and mechanisms behind form drag, so a simple explanation is attempted below.

The pressure distribution over a body in viscous flow differs from that in an ideal inviscid flow (Fig. 1.13). If the flow is inviscid, it can be shown that the flow speed at the trailing edge is zero, implying that the pressure coefficient is +1. But in a real flow (see Fig. 1.13a) the body plus the boundary-layer displacement thickness has a finite width at the traihng edge, so the flow speed does not fall to zero, and therefore the pressure coefficient is less than +1. The variation of coefficient of pressure due to real flow around an aerofoil is shown in Fig. 1.13b. This combines to generate a net drag as follows. The relatively high pressures around the nose of the aerofoil tend to push it backwards. Whereas the region of the suction pressures that follows, extend­ing up to the point of maximum thickness, act to generate a thrust pulling the aerofoil forwards. The region of suction pressures downstream of the point of maximum thickness generates a retarding force on the aerofoil, whereas the relatively high – pressure region around the traihng edge generates a thrust. In an inviscid flow, these various contributions cancel out exactly and the net drag is zero. In a real viscous flow this exact cancellation does not occur. The pressure distribution ahead of the point of maximum thickness is little altered by real-flow effects. The drag generated by the suction pressures downstream of the point of maximum thickness is slightly reduced in a real flow. But this effect is greatly outweighed by a substantial reduction in the thrust generated by the high-pressure region around the traihng edge. Thus the exact cancellation of the pressure forces found in an inviscid flow is destroyed in a real flow, resulting in an overall rearwards force. This force is the form drag.

It is emphasized again that both form and skin-friction drag depend on viscosity for their existence and cannot exist in an inviscid flow.

Centre of pressure

The aerodynamic forces on an aerofoil section may be represented by a lift, a drag, and a pitching moment. At each value of the lift coefficient there will be found to be one particular point about which the pitching moment coefficient is zero, and the aerodynamic effects on the aerofoil section may be represented by the lift and the drag alone acting at that point. This special point is termed the centre of pressure.

Whereas the aerodynamic centre is a fixed point that always lies within the profile of a normal aerofoil section, the centre of pressure moves with change of lift coefficient and is not necessarily within the aerofoil profile. Figure 1.11 shows the forces on the aerofoil regarded as either

(a) lift, drag and moment acting at the aerodynamic centre; or

(b) lift and drag only acting at the centre of pressure, a fraction kCp of the chord behind the leading edge.

Then, taking moments about the leading edge:

Centre of pressure

Mle = Mc — (L cos a + D sin q:)xac = — {L cos a + D sin a)kcpc Dividing this by p Vі Sc, it becomes

Centre of pressure Подпись: (1.54)

giving

Again making the approximations that cos a ~ 1 and CD sin a can be ignored, the Eqn (1.54), above, becomes

Подпись: fcCP - *AC CMAC (1.55)

At first sight this would suggest that kcp is always less than хде/с. However, CVAC is almost invariably negative, so that in fact fccp is numerically greater than jcac/c and the centre of pressure is behind the aerodynamic centre.

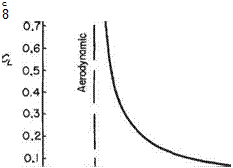
Example 1.5 For the aerofoil section of Example 1.4, plot a curve showing the approximate variation of the position of centre of pressure with lift coefficient, for lift coefficients between zero and unity. For this case:

kcp — 0.233 – (—0.04/Cl) ^ 0.233 + (0.04/Cl)

The corresponding curve is shown as Fig. 1.12. It shows that kcp tends asymptotically to хдс as CL increases, and tends to infinity behind the aerofoil as CL tends to zero. For values of CL less than 0.05 the centre of pressure is actually behind the aerofoil.

For a symmetrical section (zero camber) and for some special camber lines, the pitching moment coefficient about the aerodynamic centre is zero. It then follows, from Eqn (1.55), that kcp = хдс/с, i. e. the centre of pressure and the aerodynamic centre coincide, and that for moderate incidences the centre of pressure is therefore stationary at about the quarter-chord point.

l. l 1.0 0.9

Подпись: C 8

0.8 •

0 O. l 0.2 0.3 0.4 0.5 0l6 0.7 0.8 0.9 1.0 l. l 1.2 1.3 1.4

Подпись: LEТЕ

Fig. 1.12 Centre of pressure position for Example 1.5

Pitching moment

The pitching moment on a wing may be estimated experimentally by two principal methods: direct measurement on a balance, or by pressure plotting, as described in Section 1.5.6. In either case, the pitching moment coefficient is measured about some definite point on the aerofoil chord, while for some particular purpose it may be desirable to know the pitching moment coefficient about some other point on the chord. To convert from one reference point to the other is a simple application of statics.

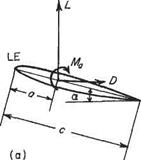
Suppose, for example, the lift and drag are known, as also is the pitching moment Ma about a point distance a from the leading edge, and it is desired to find the pitching moment Mx about a different point, distance x behind the leading edge. The situation is then as shown in Fig. 1.10. Figure 1.10a represents the known conditions, and Fig. 1.10b the unknown conditions. These represent two alternative ways of looking at the same physical system, and must therefore give identical effects on the aerofoil.

Obviously, then, L = L and D = D.

Taking moments in each case about the leading edge:

Mle = Ma — La cos a — Da sin a = Mx — Lx cos a — Dx sin a

Pitching moment
Pitching moment

Fig. 1.10

then

Mx = Ma — (L cos a + D sin a) (a — x)

Converting to coefficient form by dividing by jpV^Sc gives

CMx = CMa – (CL cos a + CD sin a) (“ – (1.46)

With this equation it is easy to calculate Cmx, for any value of x/c. As a particular case, if the known pitching moment coefficient is that about the leading edge, Смш, then a = 0, and Eqn (1.46) becomes

X

CMx = CMle + – (CL cos a + CD sin a) (1-47)

Aerodynamic centre

If the pitching moment coefficient at each point along the chord is calculated for each of several values of CL, one very special point is found for which Cm is virtually constant, independent of the lift coefficient. This point is the aerodynamic centre. For incidences up to 10 degrees or so it is a fixed point close to, but not in general on, the chord line, between 23% and 25% of the chord behind the leading edge.

For a flat or curved plate in inviscid, incompressible flow the aerodynamic centre is theoretically exactly one quarter of the chord behind the leading edge; but thickness of the section, and viscosity of the fluid, tend to place it a few per cent further forward as indicated above, while compressibility tends to move it backwards. For a thin aerofoil of infinite aspect ratio in supersonic flow the aerodynamic centre is theoretically at 50% chord.

Knowledge of how the pitching moment coefficient about a point distance а behind the leading edge varies with Cl may be used to find the position of the aerodynamic centre behind the leading edge, and also the value of the pitching moment coefficient there, Cmac■ Let the position of the aerodynamic centre be a distance *ac behind the leading edge. Then, with Eqn (1.46) slightly rearranged,

Cm„ = CMде – (Cl cos а + CD sin a) ^

Find the aerodynamic centre and the value of Cm0 ■

It is seen that Cm varies linearly with Cl, the value of dC^/dC/, being

Подпись:

Pitching moment

0.04 – (-0.02) 0.06

0.80-0.20 -+0.60

Therefore, from Eqn (1.50), with а/с = 1/3

— = i – 0.10 = 0.233 c 3

The aerodynamic centre is therefore at 23.3% chord behind the leading edge. Plotting Су against Cl gives the value of Сма, the value of Cm when Cl = 0, as —0.04.

Pitching moment Подпись: (1.52)
Pitching moment

A particular case is that when the known values of Cm are those about the leading edge, namely CMuL – In this case a = 0 and therefore

Taking this equation with the statement made earlier about the normal position of the aerodynamic centre implies that, for all aerofoils at low Mach numbers:

Pitching moment(1.53)

Pressure distribution on an aerofoil

The pressure on the surface of an aerofoil in flight is not uniform. Figure 1.9 shows some typical pressure distributions for a given section at various angles of incidence. It is convenient to deal with non-dimensional pressure differences with p00, the pressure far upstream, being used as the datum. Thus the coefficient of pressure is introduced below

^ (P-Poc)

P~ {PV2

Подпись: (b) Incidence = 6° Length of arrows a: Cp S denotes Cp at stagnation

Looking at the sketch for zero incidence (a = 0) it is seen that there are small regions at the nose and tail where Cp is positive but that over most of the section Cp is negative. At the trailing edge the pressure coefficient comes close to +1 but does not actually reach this value. More will be said on this point later. The reduced pressure on the upper surface is tending to draw the section upwards while that on the lower

Подпись:Подпись: (c) Incidence = 15°Подпись:Pressure distribution on an aerofoilwhere Cps= unity

Direction of arrows indicates positive or negative Cj, s

surface has the opposite effect. With the pressure distribution as sketched, the effect on the upper surface is the larger, and there is a resultant upwards force on the section, that is the lift.

As incidence is increased from zero the following points are noted:

(i) the pressure reduction on the upper surface increases both in intensity and extent until, at large incidence, it actually encroaches on a small part of the front lower surface;

(ii) the stagnation point moves progressively further back on the lower surface, and the increased pressure on the lower surface covers a greater proportion of the surface. The pressure reduction on the lower surface is simultaneously decreased in both intensity and extent.

The large negative values of Cp reached on the upper surface at high incidences, e. g. 15 degrees, are also noteworthy. In some cases values of —6 or —7 are found. This corresponds to local flow speeds of nearly three times the speed of the undisturbed stream.

From the foregoing, the following conclusions may be drawn:

(i) at low incidence the lift is generated by the difference between the pressure reductions on the upper and lower surfaces;

(ii) at higher incidences the lift is partly due to pressure reduction on the upper surface and partly due to pressure increase on the lower surface.

At angles of incidence around 18° or 20° the pressure reduction on the upper surface suddenly collapses and what little lift remains is due principally to the pressure increase on the lower surface. A picture drawn for one small negative incidence (for this aerofoil section, about —4°) would show equal suction effects on the upper and lower surfaces, and the section would give no lift. At more negative incidences the lift would be negative.

The relationship between the pressure distribution and the drag of an aerofoil section is discussed later (Section 1.5.5).

Force and moment coefficients

F

pV*S

Подпись: Cp = Подпись: (1.44)

The non-dimensional quantity FI(pV2S) (c. f. Eqn 1.43) (where F is an aerodynamic force and S is an area) is similar to the type often developed and used in aerody­namics. It is not, however, used in precisely this form. In place of pV2 it is conven­tional for incompressible flow to use pV2, the dynamic pressure of the free-stream flow. The actual physical area of the body, such as the planform area of the wing, or the maximum cross-sectional area of a fuselage is usually used for S. Thus aero­dynamic force coefficient is usually defined as follows:

The two most important force coefficients are the lift and drag coefficients, defined by:

lift coefficient Cl = lift/pV2S (1.44a)

drag coefficient Co = dragjpV2S (1.44b)

When the body in question is a wing the area S is almost invariably the planform area as defined in Section 1.3.1. For the drag of a body such as a fuselage, sphere or cylinder the area S is usually the projected frontal area, the maximum cross-sectional area or the (volume)2/3. The area used for definition of the lift and drag coefficients of
such a body is thus seen to be variable from case to case, and therefore needs to be stated for each case.

The impression is sometimes formed that lift and drag coefficients cannot exceed unity. This is not true; with modern developments some wings can produce lift coefficients based on their plan-area of 10 or more.

Force and moment coefficientsПодпись:Aerodynamic moments also can be expressed in the form of non-dimensional coefficients. Since a moment is the product of a force and a length it follows that a non-dimensional form for a moment is QjpV2Sl, where Q is any aerodynamic moment and l is a reference length. Here again it is conventional to replace pV2 by ini/2 in the case of the pitching moment of a wing the area is the plan-area S and the