Category Aerodynamics for Engineering Students

Multi-element aerofoils

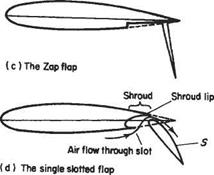
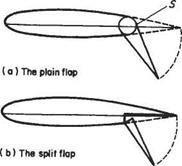
At the low speeds encountered during landing and take-off, lift needs to be greatly augmented and stall avoided. Lift augmentation is usually achieved by means of flaps[57] of various kinds – see Fig. 8.8. The plain flap shown in Fig. 8.8a increases the camber and angle of incidence; the Fowler flap (Fig. 8.8b) increases camber, angle of

Multi-element aerofoils

Shroud


(e) The Fbwier flap


Shroud Aerofoil chord line


Multi-element aerofoils

Fig. 8.8 Some types of flaps


Main flap


Position of aerofoil chord line on flap when flap is retracted


(f )The double slotted flap


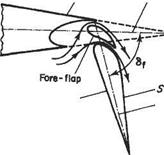
The angle 8f is the flap deflection


(g)The nose flap


Multi-element aerofoils

Multi-element aerofoils

incidence and wing area; and the nose flap (Fig. 8.8g) increases camber. The flaps shown in Fig. 8.8 are relatively crude devices and are likely to lead to boundary-layer separation when deployed. Modern aircraft use combinations of these devices in the form of multi-element wings – Fig. 8.9. The slots between the elements of these wings effectively suppress the adverse effects of boundary-layer separation, providing that they are appropriately designed. Multi-element aerofoils are not a new idea. The basic concept dates back to the early days of aviation with the work of Handley Page in Britain and Lachmann in Germany. Nature also exploits the concept in the wings of birds. In many species a group of small feathers, attached to the thumb-bone and known as the alula, acts as a slat.

Main aerofoil

Multi-element aerofoils

Fig. 8.9 Schematic sketch of a four-element aerofoil


How do multi-element aerofoils greatly augment lift without suffering the adverse effects of boundary-layer separation? The conventional explanation is that, since a slot connects the high-pressure region on the lower surface of a wing to the relatively low-pressure region on the top surface, it therefore acts as a blowing type of boundary-layer control (see Section 8.4.2). This explanation is to be found in a large number of technical reports and textbooks, and as such is one of the most widespread misconceptions in aerodynamics. It can be traced back to no less an authority than Prandtl[58] who wrote:

The air coming out of a slot blows into the boundary layer on the top of the wing and imparts fresh momentum to the particles in it, which have been slowed down by the action of viscosity. Owing to this help the particles are able to reach the sharp rear edge without breaking away.

This conventional view of how slots work is mistaken for two reasons. Firstly, since the stagnation pressure in the air flowing over the lower surface of a wing is exactly the same as for that over the upper surface, the air passing through a slot cannot really be said to be high-energy air, nor can the slot act like a kind of nozzle. Secondly, the slat does not give the air in the slot a high velocity compared to that over the upper surface of the unmodified single-element wing. This is readily apparent from the accurate and comprehensive measurements of the flow field around a realistic multi-element aerofoil reported by Nakayama elaO In fact, as will be explained below, the slat and slot usually act to reduce the flow speed over the main aerofoil.

The flow field associated with a typical multi-element aerofoil is highly complex. Its boundary-layer system is illustrated schematically in Fig. 8.10 based on the measure­ments of Nakayama etal. It is noteworthy that the wake from the slot does not interact strongly with the boundary layer on the main aerofoil before reaching the trailing edge of the latter. The wake from the main aerofoil and boundary layer from the flap also remain separate entities. As might well be expected, given the complexity of the flow field, the true explanation of how multi-element aerofoils augment lift, while avoiding the detrimental effects of boundary-layer separation, is multifaceted. And, the bene­ficial aerodynamic action of a well-designed multi-element aerofoil is due to a number of different primary effects, that will be described in turn.*

Multi-element aerofoils

Fig. 8.10 Typical boundary-layer behaviour for a three-element aerofoil

Maximizing lift for single-element aerofoils

This section addresses the question of how to choose the pressure distribution, particularly that on the upper wing surface, to maximize the lift. Even when a completely satisfactory answer is found to this rather difficult question, it still remains to determine the appropriate shape the aerofoil should assume in order to produce the specified pressure distribution. This second step in the process is the so called inverse problem of aerofoil design. It is very much more demanding than the direct problem, discussed in Chapter 4, of determining the pressure distribution for a given shape of aerofoil. Nevertheless, satisfactory inverse design methods are available. They will not, however, be discussed any further here. Only the more fundamental question of choosing the pressure distribution will be considered.

In broad terms the maximum lift achievable is limited by two factors, namely:

(i) Boundary-layer separation; and

(ii) The onset of supersonic flow.

In both cases it is usually the upper wing surface that is the more critical. Boundary – layer separation is the more fundamental of the two factors, since supercritical wings are routinely used even for subsonic aircraft, despite the substantial drag penalty in the form of wave drag that will result if there are regions of supersonic flow over the wing. However, no conventional wing can operate at peak efficiency with significant boundary-layer separation.

In two-dimensional flow boundary-layer separation is governed by:

(a) The severity and quality of the adverse pressure gradient; and

(b) The kinetic-energy defect in the boundary layer at the start of the adverse pressure gradient.

This latter quantity can be measured by the kinetic-energy thickness, 6**, introduced in Section 7.3.2. Factor (a) is more vague. Precisely how is the severity of an adverse pressure gradient assessed? What is the optimum variation of adverse pressure distribution along the wing? Plainly when seeking an answer to the first of these questions a suitable non-dimensional local pressure must be used in order to remove, as far as possible, the effects of scale. What soon becomes clear is that the conven­tional definition of coefficient of pressure, namely

,, P~Pqo

is not at all satisfactory. Use of this non-dimensional quantity invariably makes pressure distributions with high negative values of Cp appear to be the most severe. It is difficult to tell from the variation of Cp along an aerofoil whether or not the boundary layer has a satisfactory margin of safety against separation. Yet it is known from elementary dimensional analysis that if the Reynolds number is the same for two aerofoils of the same shape, but different size and freestream speed, the boundary

layers will behave in an identical manner. Furthermore, Reynolds-number effects, although very important, are relatively weak.

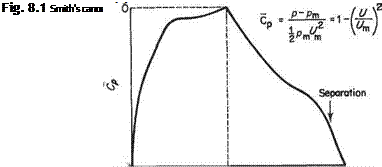
There is a more satisfactory definition of pressure coefficient for characterizing the adverse pressure gradient. This is the canonical pressure coefficient, Cp, introduced by A. M.O. Smith.[54] The definition of Cp is illustrated in Fig. 8.1. Note that local pressure is measured as a departure from the value of pressure, pm, (the correspond­ing local velocity at the edge of the boundary layer is Um) at the start of the pressure rise. Also note that the local dynamic pressure at the start of the pressure rise is now used to make the pressure difference non-dimensional. When the canonical repre­sentation is used, Cp = 0 at the start of the adverse pressure gradient and Cp = 1, corresponding to the stagnation point where U = 0, is the maximum possible value. Furthermore, if two pressure distributions have the same shape a boundary layer experiencing a deceleration of (UjU^)2 from 20 to 10 is no more or less likely to separate than one experiencing a deceleration of (U/Uao)2 from 0.2 to 0.1. With the pressure-magnitude effects scaled out it is much easier to assess the effect of the adverse pressure gradient by simple inspection than when a conventional Cp distribution is used.

Подпись: and
Maximizing lift for single-element aerofoils Maximizing lift for single-element aerofoils

How are the two forms of pressure coefficient related? From the Bernoulli equation it follows that

Maximizing lift for single-element aerofoils

Therefore it follows that

Maximizing lift for single-element aerofoils

The factor (Um/Uoo)2 is just a constant for a given pressure distribution or aerofoil shape.

Maximizing lift for single-element aerofoils

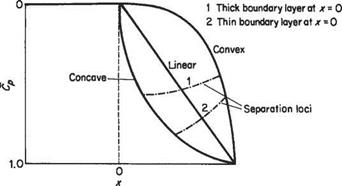
Fig. 8.2 Effects of different types of adverse pressure variation on separation

Figure 8.2 gives some idea of how the quality of the adverse pressure distribution affects boundary-layer separation. For this figure it is assumed that a length of constant pressure is followed by various types of adverse pressure gradient. Suppose that from the point x = 0 onwards Cp oc x™. For the curve labelled convex, m ~ 4, say; for that labelled linear, m = 1; and for that labelled concave, m ~ 1/4. One would not normally design a wing for which the flow separates before the trailing edge is reached, so ideally the separation loci should coincide with the trailing edge. The separation loci in Fig. 8.2 depend on two additional factors, namely the thickness of the boundary layer at the start of the adverse pressure gradient, as shown in Fig. 8.2; and also the Reynolds number per unit length in the form of Um/v. This latter effect is not illustrated, but as a general rule the higher the value of Um/v the higher the value of Cp that the boundary layer can sustain before separating.

It is mentioned above that the separation point is affected by the energy defect in the boundary layer at the start of the adverse pressure gradient, x = 0. Other things being equal this implies that the thinner the boundary layer is at x = 0, the farther the boundary layer can develop in the adverse pressure gradient before separating. This point is illustrated in Fig. 8.3. This figure is based on calculations (using Head’s method) of a turbulent boundary layer in an adverse pressure gradient with a preliminary constant-pressure region of variable length, jco – It is shown very clearly that the shorter xo is, the longer the distance Axs from x = 0 to the separation point. It may be deduced from this result that it is best to keep the boundary layer laminar, and therefore thin, up to the start of the adverse pressure gradient. Ideally, transition should occur at or shortly after x = 0, since turbulent boundary layers can withstand adverse pressure gradients much better than laminar ones. Fortunately the physics of transition, see Section 7.9, ensures that this desirable state of affairs can easily be achieved.

The canonical plot in Fig. 8.2 contains much information of practical value. For example, suppose that at typical cruise conditions the value of (U/Uoo)2 at the trailing edge is 0.8 corresponding to Cp = 0.2, and typically Cp = 0.4 (say) there. In this case any of the Cp curves in Fig. 8.2 would be able to sustain the pressure rise without leading to separation. Therefore, suitable aerofoils with a wide variety of pressure distributions could be designed to meet the specification. If, on the other hand, the goal is to achieve the maximum possible lift, then a highly concave pressure-rise curve with m ~ 1/4 would be the best choice. This is because, assuming that separation

Maximizing lift for single-element aerofoils

Maximizing lift for single-element aerofoils

Fig. 8.3 Variation of location of separation with length of initial flat plate for a turbulent boundary layer in a specified adverse pressure variation

occurs at the trailing edge, the highly concave distribution not only gives the largest possible value of (Cp)TE and therefore the largest possible value of Um/UjE, but also because the pressure rises to its value at the trailing edge the most rapidly. This latter attribute is of great advantage because it allows the region of constant pressure to be maintained over as much of the aerofoil surface as possible, leading to the greatest possible average value of CP on the upper surface and, therefore, the greatest possible lift. For many people this conclusion is counter-intuitive, since it seems to violate the classic rules of streamlining that seek to make the adverse pressure gradient as gentle as possible. Nevertheless, the conclusions based on Fig. 8.2 are practically sound.

The results depicted in Fig. 8.2 naturally suggest an important practical question. Is there, for a given situation, a best choice of adverse pressure distribution? The desired goals would be as above, namely to maximize UmjUTE and to maximize the rate of pressure rise. This question, or others very similar, have been considered by many researchers and designers. A widely quoted method of determining the optimum adverse pressure distribution is due to Stratford.[55] His theoretically derived pressure distributions lead to a turbulent boundary layer that is on the verge of separation, but remains under control, for much of the adverse pressure gradient. It is quite similar qualitatively to the concave distribution in Fig. 8.2. Two prominent features of Stratford’s pressure distribution are:

(a) The initial pressure gradient dCpjdx is infinite, so that small pressure rises can be accomplished in very short distances.

(b) It can be shown that in the early stages Cp ос x1/3.

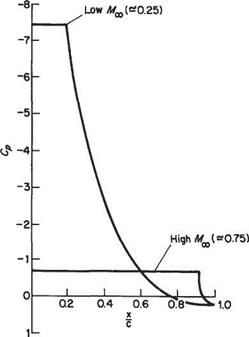
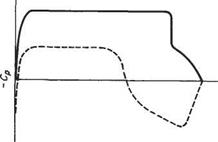
If compressible effects are taken into account and it is considered desirable to avoid supersonic flow on the upper wing surface, the minimum pressure must correspond to sonic conditions. The consequences of this requirement are illustrated in Fig. 8.4. Here it can be seen that at comparatively low speeds very high values of suction pressure can be sustained before sonic conditions are reached, resulting in a pronounced peaky pressure distribution. For high subsonic Mach numbers, on the

Maximizing lift for single-element aerofoils

Fig. 8.4 Upper-wing-surface pressure distributions with laminar rooftop

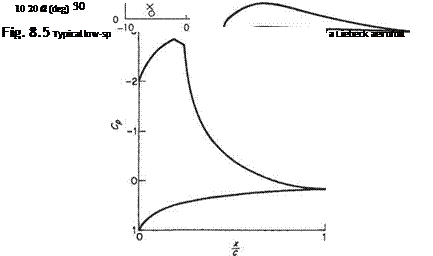
other hand, only modest maximum suction pressures are permissible before sonic conditions are reached. In this case, therefore, the pressure distribution is very flat. An example of the practical application of these ideas for low flight speeds is illustrated schematically in Fig. 8.5. This shows a Liebeck[56] aerofoil. This sort of aerofoil was used as a basis for the aerofoil designed by Lissama^ specially for the successful man-powered aircraft Gossamer Albatross and Condor. In this application high lift and low drag were paramount. Note that there is a substantial fore-portion of the aerofoil with a favourable pressure gradient, rather than a very rapid initial acceleration up to a constant-pressure region. The favourable pressure gradient ensures that the boundary layer remains laminar until the onset of the adverse pressure gradient, thereby minimizing the boundary-layer thickness at the start of the pressure rise. Incidentally, note that the maximum suction pressure in Fig. 8.5 is considerably less than that in Fig. 8.4 for the low-speed case. But, it is not, of course, suggested here that at the speeds encountered in man-powered flight the flow over the upper wing surface is close to sonic conditions.

There is some practical disadvantage with aerofoils designed for concave pressure- recovery distributions. This is illustrated in Fig. 8.6 which compares the variations of lift coefficient with angle of incidence for typical aerofoils with convex and concave pressure distributions. It is immediately plain that the concave distribution leads to much higher values of (Cx)max. But the trailing-edge stall is much more gentle, initially at least, for the aerofoil with the convex distribution. This is a desirable

cP° сГ о о о о Oq

Maximizing lift for single-element aerofoilsПодпись:о° °°°

D°0vXfXxXx

Подпись: О X -Г X

Maximizing lift for single-element aerofoils

Ххх

Fig. 8.6 Comparison of the variations of lift coefficient versus angle of incidence for aerofoils with concave and convex pressure-recovery distributions. Re = 2 x 105.x, Wortmann FX-137 aerofoil (convex); o, Selig-Guglielmo S1223 aerofoil (concave)

Source; Based on Figs 7 and 14 of M. S. Selig and J. J. Guglielmo (1997) ‘High-lift low Reynolds number airfoil design’, Л/А4 Journal of Aircraft, 34(1), 72-79

Maximizing lift for single-element aerofoils

Sonic line

Maximizing lift for single-element aerofoils

Fig. 8.7 Schematic figure illustrating a modern supercritical aerofoil

feature from the viewpoint of safety. The much sharper fall in CL seen in the case of the aerofoil with the concave pressure distribution is explained by the fact that the boundary layer is close to separation for most of the aerofoil aft of the point of minimum pressure. (Recall that the ideal Stratford distribution aims for the boundary layer to be on the verge of separation throughout the pressure recovery.) Conse­quently, when the angle of incidence that provokes separation is reached, any further rise in incidence sees the separation point move rapidly forward.

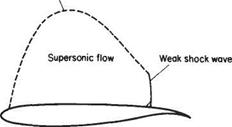
As indicated above, it is not really feasible to design efficient wings for aircraft cruising at high subsonic speeds without permitting a substantial region of supersonic flow to form over the upper surface. However, it is still important to minimize the wave drag as much as possible. This is achieved by tailoring the pressure distribution so as to minimize the strength of the shock-wave system that forms at the end of the supersonic-flow region. A schematic figure illustrating the main principles of modern supercritical aerofoils is shown in Fig. 8.7. This sort of aerofoil would be designed for Moo in the range of 0.75-0.80. The principles behind this design are not very dissimilar from those exemplified by the high-speed case in Fig. 8.4, in the sense that a constant pressure is maintained over as much of the upper surface as possible.

Flow control and wing. design

Preamble

This chapter deals with some of the fundamental principles of wing design for maximizing lift and minimizing drag. In this regard the behaviour of the boundary layer is critical and many design techniques and flow-control methods are available to counter adverse developments. Ways of identifying the most advantageous pressure distributions over the wing are given for low – and high-speed flows. Lift augmentation at low speeds by the use of multi­element aerofoils and various types of flap is described, along with several methods of direct boundary-layer control. The chapter closes with descrip­tions of the methods for reducing drag in Its various forms (skin-friction, form, induced, and wave drag).

8.1 Introduction

Wing design is an exceedingly complex and multi-faceted subject. It is not possible to do justice to all that it involves in the present text. It is possible, however, to cover some of the fundamental principles that underly design for high lift and low drag.

For fixed air properties and freestream speed, lift can be augmented in four main ways, namely:

(i) Increase in wing area;

(ii) Rise in angle of incidence;

(iii) Increased camber; or

(iv) Increased circulation by the judicious application of high-momentum fluid.

The extent to which (ii) and (iii) can be exploited is governed by the behaviour of the boundary layer. A wing can only continue to generate lift successfully if bound­ary-layer separation is either avoided or closely controlled. Lift augmentation is usually accomplished by deploying various high-lift devices, such as Daps and multi­element aerofoils. Such devices lead to increased drag, so they are generally used only at the low speeds encountered during take-off and landing. Nevertheless, it is instruct­ive to examine the factors governing the maximum lift achievable with an unmodified single-element aerofoil before passing to a consideration of the various high-lift

devices. Accordingly, in what follows the maximization of lift for single-element aerofoils is considered in Section 8.2, followed by Section 8.3 on multi-element aerofoils and various types of flap, and Section 8.4 on other methods of boundary – layer control. Finally, the various methods used for drag reduction are described in Sections 8.5 to 8.8.

Shock-wave/boundary-layer interaction in supersonic flow

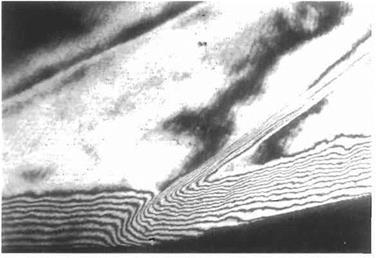
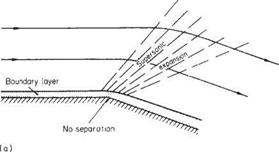
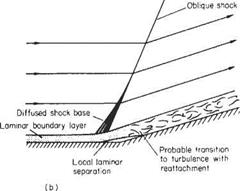
One of the main differences between subsonic and supersonic flows, as far as boundary-layer behaviour is concerned, is that the pressure gradient along the flow is of opposite sign with respect to cross-sectional area change. Thus in a converging supersonic flow the pressure rises and in a diverging flow the pressure falls in the stream direction (see Section 6.2). As a result the pressure gradient at a convex corner is negative and the boundary layer will generally negotiate the comer without separating, and the effect of the boundary layer on the external or mainstream flow will be negligible (Fig. 7.52a). Conversely, at a concave comer an oblique shock wave is generated and the corresponding pressure rise will cause boundary-layer thickening ahead of the shock, and in the case of a laminar boundary layer will probably cause local separation at the comer (see Figs 7.52b and 7.53). The resultant curvature of the flow just outside the boundary layer causes a wedge of compression wavelets to develop which, in effect, diffuse the base of the shock wave as shown in Fig. 7.52b.

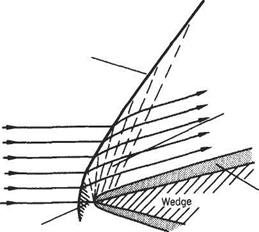
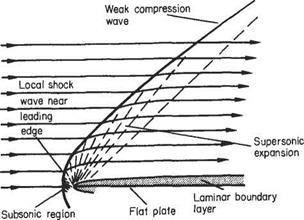
At the nose of a wedge, the oblique nose shock will be affected by the boundary- layer growth; the presence of the rapidly thickening boundary layer near the leading edge produces an effective curvature of the nose of the wedge and a small region of expansive (Prandtl-Meyer) flow will develop locally behind the nose shock, which will now be curved and slightly detached from the nose (Fig. 7.54a). A similar effect will occur at the leading edge of a flat plate where a small detached curved local shock will develop. This shock will rapidly degenerate into a very weak shock approximating to a Mach wave at a small distance from the leading edge (Fig. 7.54b).

In some cases, an oblique shock that has been generated at some other point in the mainstream may be incident on the surface and boundary layer. Such a shock will be at an angle, between the upstream surface and itself, of considerably less than 90°. The general reaction of the boundary layer to this condition is similar to that already discussed in the transonic case, except that the oblique shock does not, in general, reduce the mainstream flow to a subsonic speed.

If the boundary layer is turbulent, it appears to reflect the shock wave as another shock wave in much the same way as would the solid surface in the absence of the boundary layer, although some thickening of the boundary layer occurs. There may also be local separation and reattachment, in which case the reflected shock originates just

Fig. 7.52


Shock-wave/boundary-layer interaction in supersonic flow

Fig. 7.53 Supersonic flow through a sharp concave corner: The flow is from left to right at a downstream Mach number of 2.5. The holographic interferogram shows flow turning through an angle of 11° thereby forming an oblique shock wave that interacts with the turbulent boundary layer present on the wall. Each fringe corresponds to constant density. The boundary layer transmits the effect of the shock wave a short distance upstream but there is no flow separation. Compare with Fig. 7.52b above. (The photograph was taken by P. J. Bryanston-Cross in the Engineering Department, University of Warwick, UK.)


Shock-wave/boundary-layer interaction in supersonic flowShock-wave/boundary-layer interaction in supersonic flow

Nose shock wave


Supersonic

expansion


Laminar boundary layer


Subsonic region (a)


(b)


Shock-wave/boundary-layer interaction in supersonic flowShock-wave/boundary-layer interaction in supersonic flow

Fig. 7.54 ahead of the point of incidence. A laminar boundary layer, however, thickens gradually up to the point of incidence, and may separate locally in this region, and then rapidly become thinner again. The shock then reflects as a fan of expansion waves, followed by a diffused shock a little farther downstream. There is also a set of weak compression waves set up ahead of the incident shock, owing to the boundary-layer thickening, but these do not usually set up a lambda configuration as with a near-normal incident shock.

Approximate representations of the above cases are shown in Fig. 7.55.

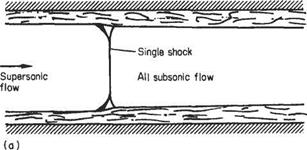
One other condition of interest that occurs in a closed uniform duct (two-dimen­sional or circular) when a supersonic stream is being retarded by setting up a back pressure in the duct. In the absence of boundary layers, the retardation would normally occur through a plane normal shock across the duct, reducing the flow, in one jump, from supersonic to subsonic speed. However, because of the presence of

Shock-wave/boundary-layer interaction in supersonic flow

Fig. 7.55

the boundary layer, which thickens ahead of the shock, causing the base of the shock to thicken or bifurcate (lambda shock) depending on the nature and thickness of the boundary layer, in much the same way as for the transonic single-surface case.

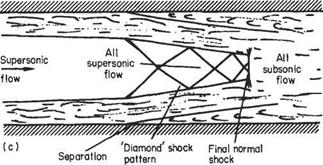
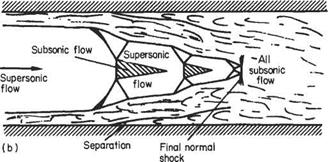
Because of the considerable thickening of the boundary layers, the net flow area is reduced and may reaccelerate the subsonic flow to supersonic, causing another normal shock to be set up to re-establish the subsonic condition. This situation may be repeated several times until the flow reduces to what is effectively fully-developed subsonic boundary-layer flow. If the boundary layers are initially thick, the first shock may show a large degree of bifurcation owing to the large change of flow direction well ahead of the normal part of the shock. In some cases, the extent of the normal shock may be reduced almost to zero and a diamond pattern of shocks develops in the duct. Several typical configurations of this sort are depicted in Fig. 7.56.

To sum up the last two sections, it can be stated that, in contrast to the case of most subsonic mainstream flows, interaction between the viscous boundary layer and the effectively inviscid, supersonic, mainstream flow is likely to be appreciable. In the subsonic case, unless complete separation takes place, the effect of the boundary-layer

Shock-wave/boundary-layer interaction in supersonic flow

Shock-wave/boundary-layer interaction in supersonic flow

Shock-wave/boundary-layer interaction in supersonic flow

Fig. 7.56 (a) Low upstream Mach number thin boundary layer; relatively small pressure rise; no separation, (b) Higher upstream Mach number; thin boundary layer; larger overall pressure rise; separation at first shock, (c) Moderately high upstream Mach number; thick boundary layer; large overall pressure rise; separation at first shock

development on the mainstream can usually be neglected, so that an inviscid main­stream-flow theory can be developed independently of conditions in the boundary layer. The growth of the latter can then be investigated in terms of the velocities and streamwise pressure gradients that exist in the previously determined mainstream flow.

In the supersonic (and transonic) case, the very large pressure gradients that exist across an incident shock wave are propagated both up – and downstream in the boundary layer. The rapid thickening and possible local separation that result

Shock-wave/boundary-layer interaction in supersonic flow

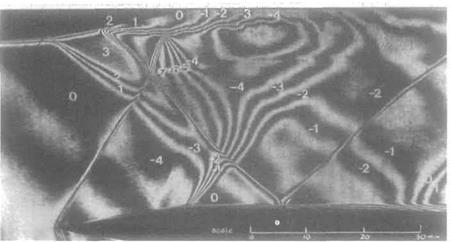
Fig. 7.57 Complex wave interactions in supersonic flow: The flow is from left to right for this holographic interferogram. Complex interactions occur between shock waves, expansion waves and boundary layers on the upper and lower walls. An oblique shock wave runs up and to the right from the leading edge of the wedge. This interacts with a fan of expansion waves running downwards and to the right from a sharp turn in the upper surface. A subsequent compression turn in the upper surface located at the top of the photograph generates a second shock wave running downward and to the right which interacts first with the leading-edge shock wave, then with an expansion wave emanating from the lower surface, and finally with the boundary layer on the lower surface. The pressure rise associated with this second shock wave has led to boundary-layer separation on the upper surface close to the label 2. See Fig. 7.55 on page 480. Interferograms can supply quantitative data in form of density or Mach number values. The Mach numbers corresponding to the numerical labels (given in parentheses) appearing in the photograph are as follows: 0.92(-7), 0.98(-6), 1.05(-5), 1.13(-4), 1.21(-3), 1.28(-2),

1.36(-1), 1.44(0), 1.53(1), 1.64(2), 1.75(3). (The photograph was taken by P. J. Bryanston-Cross in the Engineering Department, University of Warwick, UK.)

frequently have considerable effects on the way in which the shock is reflected by the boundary layer (see Fig. 7.57). In this way, the whole character of the mainstream flow may frequently be changed. It follows from this that a supersonic mainstream flow is much more dependent on Reynolds number than a subsonic one because of the appreciably different effects of an incident shock on laminar and turbulent boundary layers. The Reynolds number, of course, has a strong influence on the type of boundary layer that will occur. The theoretical quantitative prediction of supersonic stream behaviour in the presence of boundary layers is, consequently, extremely difficult.

Exercises

1 A thin plate of length 50 cm is held in uniform water flow such that the length of the plate is parallel to the flow direction. The flow speed is lOm/s, the viscosity, /л — 1.0 x lO-3 Pa s, and the water density is 998 kg/nr3.

(i) What is the Reynolds number based on plate length. What can be deduced from its value?

(ii) On the assumption that the boundary layer is laminar over the whole surface, use the approximate theory based on the momentum-integral equation to find:

(a) The boundary-layer thickness at the trailing edge of the plate; and

(b) The skin-friction drag coefficient.

(iii) Repeat (ii), but now assume that the boundary layer is turbulent over the whole surface. (Use the formulae derived from the 1/7-power-law velocity profile.) {Answer. Rei. = 500 000; 6 ~ 3.3 mm, C^f ~ 0.0018; 6 ~ 13.4mm, Cot ~ 0.0052)

2 A thin plate of length 1.0 m is held in a uniform air flow such that the length of the plate is parallel to the flow direction. The flow speed is 25m/s, the viscosity, jj, = 14.96 x 10⁻⁶Pas, and the air density is 1.203 kg/m3.

(i) If it is known that transition from laminar to turbulent flow occurs when the Reynolds number based on x reaches 500 000, find the transition point.

(ii) Calculate the equivalent plate length for an all-turbulent boundary layer with the same momentum thickness at the trailing edge as the actual boundary layer.

(iii) Calculate the coefficient of skin-friction drag per unit breadth for the part of the plate with

(a) A laminar boundary layer; and

(b) A turbulent boundary layer. (Use the formulae based on the 1/7-power-law velocity profile.)

(iv) Calculate the total drag per unit breadth.

(v) Estimate the percentage of drag due to the turbulent boundary layer alone.

{Answer. 300 mm from the leading edge; 782 mm; 0.00214, 0.00431;

1.44N/m per side; 88%)

3 The geometric and aerodynamic data for a wing of a large white butterfly is

as follows: Flight speed, Ux = 1.35m/s; Average chord, c = 25mm; Average span, s = 50mm; air density = 1.2kg/m3; air viscosity, ц = 18 x 10_6Pas; Drag at zero lift = 120 |j. N (measured on a miniature wind-tunnel balance). Estimate the boundary-layer thickness at the trailing edge. Also compare the measured drag with the estimated skin-friction drag. How would you account for any difference in value? {Answer. 2.5 mm; 75 pN)

4 A submarine is 130 m long and has a mean perimeter of 50 m. Assume its wetted surface area is hydraulically smooth and is equivalent to a flat plate measuring 130 m x 50 m. Calculate the power required to maintain a cruising speed of 16m/s when submerged in a polar sea at 0°C. If the engines develop the same power as before, at what speed would the submarine be able to cruise in a tropical sea at 20 °С?

Take the water density to be 1000kg/m3, and its kinematic viscosity to be 1.79 x 10⁻⁶m2/s at 0°C and 1.01 x 10⁻⁶m2/s at 20°C.

{Answer. 20.5 MW; 16.37m/s)

5 A sailing vessel is 64 m long and its hull has a wetted surface area of 560 m2. Its top speed is about 9m/s. Assume that normally the equivalent sand-grain roughness, ks, of the hull is about 0.2 mm.

The total resistance of the hull is composed of wave drag plus skin-friction drag. Assume that the latter can be estimated by assuming it to be the same as the equivalent flat plate. The skin-friction drag is exactly half the total drag when sailing at the top speed under normal conditions. Assuming that the water density and kinematic viscosity are 1000 kg/m3 and 1.2 x 10_6m2/s respectively, estimate:

(a) The admissible roughness for the vessel;

(b) The power required to maintain the vessel at its top speed when the hull is unfouled (having its original sand-grain roughness);

(c) The amount by which the vessel’s top speed would be reduced if barnacles and seaweed were allowed to remain adhered to the hull, thereby raising the equiva­lent sand-grain roughness, ks, to about 5 mm.

(Answer: 2.2 pm; 1.06 MW; 8.04 m/s, i. e. a reduction of 10.7%)

6 Suppose that the top surface of a light-aircraft wing travelling at an air speed of

55 m/s were assumed to be equivalent to a flat plate of length 2 m. Laminar-turbulent transition is known to occur at a distance of 0.75 m from the leading edge. Given that the kinematic viscosity of air is 15 x 10_6m2/s, estimate the coefficient of skin – friction drag. (Answer: 0.00223)

7 Dolphins have been observd to swim at sustained speeds up to 11 m/s. According to the distinguished zoologist Sir James Gray, this speed could only be achieved, assuming normal hydrodynamic conditions prevail, if the power produced per unit mass of muscle far exceeds that produced by other mammalian muscles. This result is known as Gray’s paradox. The object of this exercise is to carry out revised estimates of the power required in order to check the soundness of Gray’s calculations.

Assume that the dolphin’s body is hydrodynamically equivalent to a prolate spheroid (formed by an ellipse rotated about its major axis) of 2 m length with a maximum thickness-to-length ratio of 1:6.

4 ,

Volume of a prolate spheroid = – тгаЬ

Surface/area = 2ттЬ2 + ,_ arc sin

where 2a is the length and 2b the maximum thickness.

Calculate the dimensions of the equivalent flat plate and estimate the power required to overcome the hydrodynamic drag (assuming it to be solely due to skin friction) at 11 m/s for the following two cases:

(a) Assuming that the transitional Reynolds number takes the same value as the maximum found for a flat plate, i. e. 2 x 10⁶, say;

(b) Assuming that transition occurs at the point of maximum thickness (i. e. at the point of minimum pressure), which is located half-way along the body.

The propulsive power is supplied by a large group of muscles arranged around the spine, typically their total mass is about 36 kg, the total mass of the dolphin being typically about 90 kg. Assuming that the propulsive efficiency of the dolphin’s tail unit is about 75%, estimate the power required per unit mass of muscle for the two cases above. Compare the results with the values given below.

Running man, 40 W/kg; Hovering humming-bird, 65 W/kg.

(Answer: 2m x 0.832m; 2.87kW, 1.75kW; 106 W/kg, 65 W/kg)

8 Many years ago the magazine The Scientific American published a letter concerned with the aerodynamics of pollen spores. A photograph accompanied the letter showing a spore having a diameter of about 20 pm and looking remarkably like a golf ball. The gist of the letter was that nature had discovered the principle of golf – ball aerodynamics millions of years before man. Explain why the letter-writer’s logic is faulty.
Near-normal shock interaction with turbulent boundary layer

Because the turbulent boundary layer is far less susceptible to disturbance by an adverse pressure gradient than is a laminar one, separation is not Ukely to occur for local mainstream Mach numbers, ahead of the shock, of less than about 1.3 (this corresponds to a downstream-to-upstream pressure ratio of about 1.8). When no separation occurs, the thickening of the boundary layer ahead of the shock is rapid and the compression wavelets near the base of the main shock are very localized, so that the base of the shock appears to be slightly diffused, although no lambda formation is apparent. Behind the shock no subsequent thinning of the boundary layer appears to occur and the secondary shocks, typical of laminar boundary-layer interaction, do not develop.

If separation of the turbulent layer occurs ahead of the main shock a lambda shock develops and the mainstream flow looks much like that for a fully separated laminar boundary layer.

Near-normal shock interaction with laminar boundary layer

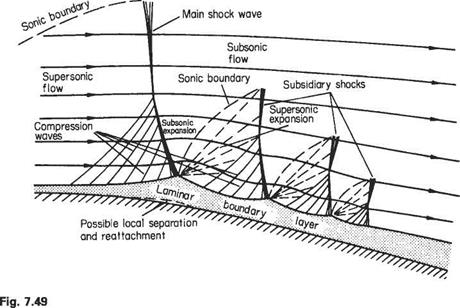
There appear to be three general possibilities when a near-normal shock interacts with a laminar boundary layer. With a relatively weak shock, corresponding to an upstream Mach number just greater than unity, the diffused pressure rise may simply cause a gradual thickening of the boundary layer ahead of the shock with no transition and no separation. The gradual thickening causes a family of weak compression waves to develop ahead of the main shock (these are required to produce the supersonic main­stream curvature) and the latter sets itself up at an angle, between itself and the upstream surface, of rather less than 90° (see Fig. 7.49). The compression waves join the main shock at some small distance from the surface, giving a diffused base to the shock.

Immediately behind the shock, the boundary layer tends to thin out again and a local expansion takes place which brings a small region of the mainstream up to a slightly supersonic speed again and this is followed by another weak near-normal

Near-normal shock interaction with laminar boundary layer

shock which develops in the same way as the initial shock. This process may be repeated several times before the mainstream flow settles down to become entirely subsonic. Generally speaking this condition is not associated with boundary-layer separation, although there may possibly be a very limited region of separation near the base of the main shock wave.

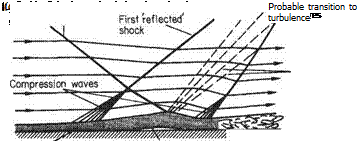
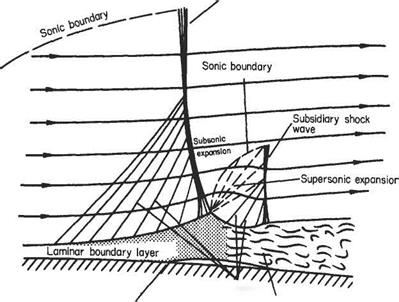
As the mainstream speed increases so that the supersonic region is at a higher Mach number, the above pattern tends to change, the first shock becoming very much stronger than the subsequent ones and all but one of the latter may well not occur at all for local upstream Mach numbers much above 1.3. This is to be expected, because a strong first shock will produce a lower Mach number in the mainstream behind it. This means that there is less likelihood of the stream regaining supersonic speed. Concur­rently with this pattern change, the rate of thickening of the boundary layer, upstream of the first and major shock, becomes greater and the boundary layer at the base of the normal part of the shock will generally separate locally before reattaching. There is a considerable possibility that transition to turbulence will occur behind the single sub­sidiary shock. This type of flow is indicated in Fig. 7.50.

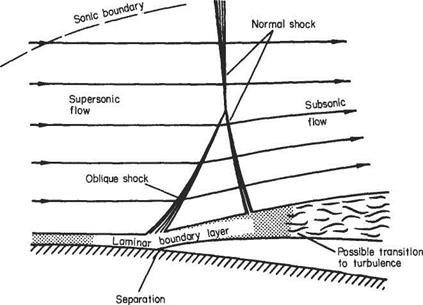
With still greater local supersonic Mach numbers, the pressure rise at the shock may be sufficient to cause separation of the laminar boundary layer well ahead of the main shock position. This will result in a sharp change in direction of the mainstream flow just outside the boundary layer and this will be accompanied by a well-defined oblique shock which joins the main shock at some distance from the surface. This type of shock configuration is called a lambda-shock, for obvious reasons. It is unlikely that the boundary layer will reattach under these conditions, and the secondary shock, which normally appears as the result of reattachment or boundary – layer thinning, will not develop. This type of flow is indicated in Fig. 7.51. This sudden separation of the upper-surface boundary layer on an aerofoil, as Mach number increases, is usually associated with a sudden decrease in lift coefficient and the phenomenon is known as a shock stall.

Compression

Подпись: Main shock waveNear-normal shock interaction with laminar boundary layer,___ . .. waves Transition to

Laminar separat. on turbulence and

reattachment

Fig. 7.50


Fig. 7.51


Near-normal shock interaction with laminar boundary layer

Some boundary-layer effects in supersonic flow

A few comments may now be made about the qualitative effects on boundary-layer flow of shock waves that may be generated in the mainstream adjacent to the surface of a body. A normal shock in a supersonic stream invariably reduces the Mach number to a subsonic value and this speed reduction is associated with a very rapid increase in pressure, density and temperature.

For an aerofoil operating in a transonic regime, the mainstream flow just outside the boundary layer accelerates from a subsonic speed near the leading edge to sonic

speed at some point near the subsonic-peak-suction position. At this point, the streamlines in the local mainstream will be parallel and the effect of the aerofoil surface curvature will be to cause the streamlines to begin to diverge downstream. Now the characteristics of a supersonic stream are such that this divergence is accompanied by an increase in Mach number, with a consequent decrease in pres­sure. Clearly, this state of affairs cannot be maintained, because the local mainstream flow must become subsonic again at a higher pressure by the time it reaches the undisturbed free-stream conditions downstream of the trailing edge. The only mechan­ism available for producing the necessary retardation of the flow is a shock wave, which will set itself up approximately normal to the flow in the supersonic region of the mainstream; the streamwise position and intensity (which will vary with distance from the surface) of the shock must be such that just the right conditions are established behind it, so that the resulting mainstream approaches ambient conditions far down­stream. However, this simple picture of a near-normal shock requirement is compli­cated by the presence of the aerofoil boundary layer, an appreciable thickness of which must be flowing at subsonic speed regardless of the mainstream flow speed. Because of this, the rapid pressure rise at the shock, which cannot be propagated upstream in the supersonic regions of flow, can be so propagated in the subsonic region of the boundary layer. As a result, the rapid pressure rise associated with the shock becomes diffused near the base of the boundary layer and appears in the form of a progressive pressure rise starting at some appreciable distance upstream of the incident shock. The length of this upstream diffusion depends on whether the boundary layer is laminar or turbulent. In a laminar boundary layer the length may be as much as one hundred times the nominal general thickness (6) at the shock, but for a turbulent layer it is usually nearer ten times the boundary-layer thickness. This difference can be explained by the fact that, compared with a turbulent boundary layer, a larger part of the laminar boundary – layer flow near the surface is at relatively low speed, so that the pressure disturbance can propagate upstream more rapidly and over a greater depth.

It has already been pointed out in Sections 7.2.6 and 7.4 that an adverse pressure gradient in the boundary layer will at least cause thickening of the layer and may well cause separation. The latter effect is more probable in the laminar boundary layer and an additional possibility in this type of boundary layer is that transition to turbulence may be provoked. There are thus several possibilities, each of which may affect the external flow in different ways.

Growth rate of two-dimensional wake, using the general momentum integral equation

As explained the two boundary layers at the trailing edge of a body will join up and form a wake of retarded flow. The velocity profile across this wake will vary appreciably with distance behind the trailing edge. Some simple calculations can be made that will relate the rate of growth of the wake thickness to distance downstream, provided the wake profile shape and external mainstream conditions can be specified.

Подпись: d0_ Q dx 2 Growth rate of two-dimensional wake, using the general momentum integral equation Подпись: (7.171)

The momentum integral equation for steady incompressible flow, Eqn (7.98) may be reduced to

Подпись: dO dx Growth rate of two-dimensional wake, using the general momentum integral equation Подпись: (7.172)

Now Cf is the local surface shear stress coefficient at the base of the boundary layer, and at the wake centre, where the two boundary layers join, there is no relative velocity and therefore no shearing traction. Thus, for each half of the wake, Q is zero and Eqn (7.171) becomes

It is clear from this that if the mainstream velocity outside the wake is constant, then dUe/dx = 0 and the right-hand side becomes zero, i. e. the momentum thickness of the wake is constant. This would be expected from the direct physical argument that there are no overall shearing tractions at the wake edges under these conditions, so that the total wake momentum will remain unaltered with distance downstream. 0 may represent the momentum thickness for each half of the wake, considered separately if it is unsymmetrical, or of the whole wake if it is symmetrical.

The general thickness S of the wake is then obtainable from the relationship

0 — S f m(1 — u) dy = IS Jo

so that

Подпись: (7.173)<5b _ Оъ h <5a 0a h

where suffices a and b refer to two streamwise stations in the wake. Knowledge of the velocity profiles at stations a and b is necessary before the integrals 7a and /ь can be evaluated and used in this equation.

Example 7.11 A two-dimensional symmetrical aerofoil model of 0.3 m chord with a roughened surface is immersed, at zero incidence, in a uniform airstream flowing at 30 m s_ 1. The minimum velocity in the wake at a station 2.4 m downstream from the trailing edge is 27 ms-1. Estimate the general thickness of the whole wake at this station. Assume that each boundary layer at the trailing edge has a ‘seventh root’ profile and a thickness corresponding to a turbulent flat-plate growth from a point at 10% chord, and that each half-wake profile at the downstream station may be represented by a cubic curve of the form U = ay? + by2 + cy + d.

Growth rate of two-dimensional wake, using the general momentum integral equation

Growth rate of two-dimensional wake, using the general momentum integral equation

At the trailing edge, where. v = 0.3 m:

(Eqn (7.81))

Growth rate of two-dimensional wake, using the general momentum integral equation

z Re Xі

Re[/S = 14.39

1 r 0.383 x 0.27 л „ 2^a = 14.39 =°-00719m

Also

/„ = 0.0973 Eqn (a) (Section 7.7.5)

At the wake station:

Подпись: du

и = a у + bv + су + d, — = Ъаг + 2 by + c ■ ’ dy ■

Подпись: d = 0.9, Подпись: c = 0, Подпись: = a + b + 0.9 and 0 = 3a + 2b

The conditions to be satisfied are that (і) й = 0.9 and (ii) дй/ду = 0, when у = 0; and (iii) й = 1.0 and (iv) дй/ду = 0, when у = 1. (Condition (ii) follows because, once the wake is established at a short distance behind the trailing edge, the profile discontinuity at the centre­line disappears.) Thus:

a = lh

Growth rate of two-dimensional wake, using the general momentum integral equation

= (1 — j + 0.9 or /> = 0.3 and a = -0.2

B. M. Jones’ wake traverse method for determining profile drag

In the wake close behind a body the static pressure, as well as the velocity, will vary from the value in the free stream outside the wake. B. Melville Jones allowed for this fact by assuming that, in any given stream tube between planes 1 (close to the body) and 2 (far downstream), the stagnation pressure could be considered to remain constant. This is very nearly the case in practice, even in turbulent wakes.

B. M. Jones&#39; wake traverse method for determining profile drag

Let Hx be the stagnation pressure in any stream tube at plane 0 and Hi = #2 be its value in the same stream tube at planes 1 and 2. Then

Подпись: and
B. M. Jones&#39; wake traverse method for determining profile drag B. M. Jones&#39; wake traverse method for determining profile drag

The velocities are given by

Substituting the values for Ux and м2 into Eqn (7.166) gives

D = lf л/Ні – px{^Hx -px – VНу – px)dy2 (7.167)

To refer this to plane 1, the equation of continuity in the stream tube must be used, i. e.

Ml буї = М2 6y2

or

B. M. Jones&#39; wake traverse method for determining profile drag(7.168)

Referred to the wake at plane 1, Eqn (7.167) then becomes

D = 2 f ^/Hi-pi(y/Hx-px – у/Hi – Poo) dyi (7.169)

In order to express Eqn (7.169) non-dimensionally, the profile-drag coefficient CDp is used. For unit span:

Подпись: D D.P^OOC C(H°° Poo)

* A. Betz, ZFM, 16, 42, 1925.

+ B. Melville Jones, ARCR and M, 1688, 1936.

B. M. Jones&#39; wake traverse method for determining profile drag Подпись: (7.170)
B. M. Jones&#39; wake traverse method for determining profile drag B. M. Jones&#39; wake traverse method for determining profile drag

so that Eqn (7.169) becomes

It will be noticed again that this integral needs to be evaluated only across the wake, because beyond the wake boundary the stagnation pressure H becomes equal to Hx so that the second term in the bracket becomes unity and the integrand becomes zero.

Equation (7.170) may be conveniently used in the experimental determination of profile drag of a two-dimensional body when it is inconvenient, or impracticable, to use a wind-tunnel balance to obtain direct measurement. It can, in fact, be used to determine the drag of aircraft in free flight. All that is required is a traversing mechanism for a pitot-static tube, to enable the stagnation and static pressures H and p to be recorded at a series of positions across the wake, ensuring that measure­ments are taken as far as the undisturbed stream on either side, and preferably an additional measurement made of the dynamic pressure, Hx — px, in the incoming stream ahead of the body. In the absence of the latter it can be assumed, with reasonable accuracy, that Hx — px will be the same as the value of H — p outside the wake.

Using the recordings obtained from the traverse, values of H — p and H — px may be evaluated for a series of values of yi/c across the wake, and hence a corresponding series of values of the quantity

I Hi-pi Л ІНг-рЛ

у Нх px у у Hoc Poo J

By plotting a curve of this function against the variable yi/c a closed area will be obtained (because the integral becomes zero at each edge of the wake). The magni­tude of this area is the value of the integral, so that the coefficient CD? is given directly by twice the area under the curve.

In order to facilitate the actual experimental procedure, it is often more convenient to construct a comb or rake of pitot and static tubes, set up at suitable spacings. The comb is then positioned across the wake (it must be wide enough to read into the free stream on either side) and the pitot and static readings recorded.

The method can be extended to measure the drag of three-dimensional bodies, by making a series of traverses at suitable lateral (or spanwise) displacements. Each individual traverse gives the drag force per unit span, so that summation of these in a spanwise direction will give the total three-dimensional drag.

The momentum integral expression for the drag of a two-dimensional body

Consider a two-dimensional control volume fixed in space (see Fig. 7.48) of unit width, with two faces (planes 0 and 2) perpendicular to the free stream, far ahead of and far behind the body respectively, the other two lying parallel to the undisturbed flow direction, and situated respectively far above and far below the body. For any stream tube (of vertical height Sy) that is contained within the wake at the downstream boundary, the mass flow per unit time is ригбуг and the velocity reduction between upstream and downstream is Ua0 — «2- The loss of momentum per unit time in the stream tube = pui{Ux — иг)6у2 and, for the whole field of flow:

r

Total loss of momentum per unit time = pu2(Ux — U2)&y2

Joe

In fact, the limits of this integration need only extend across the wake because the term Ux — U2 becomes zero outside it.

This rate of loss of momentum in the wake is brought about by the reaction on the fluid of the profile drag force per unit span D, acting on the body. Thus

D = f pu2(Uo0 – u2)dy2 (7.166)

J W

This expression enables the drag to be calculated from an experiment arranged to determine the velocity profile at some considerable distance downstream of the body, i. e. where p = p00.

For practical use it is often inconvenient, or impossible, to arrange for measurement so far away from the body, and methods that allow measure­ments to be made close behind the body (plane 1 in Fig. 7.48) have been
developed by Betz* and B. M. Jones. t The latter’s method is considerably the simpler and is reasonably accurate for most purposes.