Category Aerodynamics for Engineering Students

Estimation of profile drag from velocity profile in wake

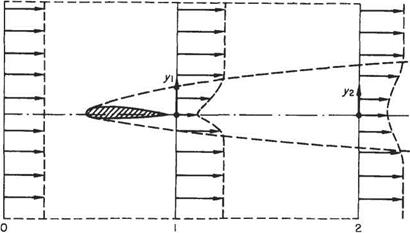
At the trailing edge of a body immersed in a fluid flow, there will exist the boundary layers from the surfaces on either side. These boundary layers will join up and move downstream in the form of a wake of retarded velocity. The velocity profile will change with distance downstream, the wake cross-section increasing in size as the magnitude of its mean velocity defect, relative to free stream, decreases. At a sufficient distance downstream, the streamlines will all be parallel and the static pressure across the wake will be constant and equal to the free-stream value. If conditions at this station are compared with those in the undisturbed stream ahead of the body, then the rate at which momentum has been lost, while passing the body, will equate to the drag force on the body. The drag force so obtained will include both skin-friction and form-drag components, since these together will produce the overall momentum change. A method of calculating the drag of a two-dimensional body using the momentum loss in the wake is given below. The method depends on conditions remaining steady with time.

Estimation of profile drag from velocity profile in wake

Far upstream Close behind body

Ho Pm Um H P U


Far downstream Hz Pm uz


Estimation of profile drag from velocity profile in wake

Fig. 7.48

Large-eddy simulation

This approach to computational calculation of turbulent flow originated with meteorologists. In a sense LES is half way between the turbulence modelling based on Reynolds averaging and direct numerical simulations. LES is motivated by the view that the larger-scale motions are likely to vary profoundly between one type of turbulent flow and another, but that the small-scale turbulence is likely to be much more universal in character. Accordingly any semi-empirical turbulence modelling should be confined to the small-scale turbulence. With this in mind the flow variables are partitioned into

Подпись: (7.156){u, v, w, p] = {it, v, w, p} + {г/, і/, W, p’}

4—- v—- ‘ 4—— V—- ‘

Resolved field Subgrid-scale field

The resolved or large-scale field is computed directly while the subgrid-scale field is modelled semi-empirically.

The resolved field is obtained by applying a filter to the flow variables, e. g.

Подпись: (7.157)й(х) = J G(x-£) u(|)df

Filter function

If the filter function is chosen appropriately this has the effect of ‘averaging’ over the sub-grid scales.

Two common choices of filter function

I* — £l < Л/2

Otherwise

Large-eddy simulation Подпись: (7.158)

(1) Box Filter*:

(2) Gaussian Filter

Подпись: (7.159)G{x – Й = [0 ‘ ^-] exp [~b{x – g)1 /Ага

The choice made for the size of A or Aa in Eqns (7.158) or (7.159) determines the sub-grid scale. Filtering the Navier-Stokes equations gives:

Подпись:дйі d ________ d _______ d ______ 1 dp 2 ~ . – _ –

-x – + -5— M«Mi + б-M<M2 + – s—м, м3= – + z/V М,- 1= 1,2,3

Ot OX 1 OX 2 OX 3 pOXj

Подпись: дщ дй2 дщ^ дх дх2 дхз(7.161)

where щ, м2 and щ denote м, v and w, and леї, *2 and X3 denote x, у and z; and where

mj = ufij + u’fij + UyU[ + u’fij (7.162)

* Deardorff, J. W. (1970) A numerical study of three-dimensional turbulent channel flow at large Reynolds numbers, J. Fluid Mech., 41, 453-480.

* Leonard, A. (1974) Energy cascade in large eddy simulations of turbulent fluid flow, Adv. Geophys., 18A, 237-248.

Large-eddy simulation

Подпись:modelled semi-empirically

Sub-grid scale modelling

Large-eddy simulation Large-eddy simulation Подпись: (7.164)

A common approach, originating with Smagorinsky[53] is to use an eddy viscosity, so that

A common way of modelling sj is also due to Smagorinsky (1963):

Large-eddy simulation(7.165)

where c is a semi-empirically determined constant.

For more information on LES see Wilcox (1993) and Pope (2000). LES is very demanding in terms of computational resources but with the rapid increase in computer power it is becoming more and more feasible for engineering calculations. An alternative that is less demanding on computational resources is to use conven­tional turbulence modelling based on Reynolds averaging, but to include the time derivatives of the mean velocity components in the Reynolds-averaged Navier – Stokes equations. This approach is sometimes known as very-large-eddy simulation (VLES). See Tucker (2001)^ for a specialized treatment.

The k-є method – A typical two-equation method

Probably the most widely used method for calculating turbulent flows is the k—є model which is incorporated into most commercial CFD software. It was independently developed at Los Alamos* and at Imperial College London.* ♦Baldwin, B. S. and Lomax, H. (1978) Thin layer approximation and algebraic model for separated turbulent flows. AIAA Paper 78-257.

* Harlow, F. H. and Nakayama, P. I. (1968) Transport of turbulence energy decay rate. Univ. of California, Los Alamos Science Lab. Rep. LA-3854.

* Jones, W. P. and Launder, B. E. (1972) The prediction of laminarization with a two-equation model of turbulence, Int. J. Heat Mass Transfer, 15, 301-314.

The basis of the k—s and most other two-equation models is an eddy-viscosity formula based on dimensional reasoning and taking the form:

Подпись: (7.152)sT = C^H Сц is an empirical const.

Note that the kinetic energy per unit mass, k = (ua + v’2 + vv’2)/2. Some previous two-equation models derived a transport equation for the length-scale £. This seemed rather unphysical so, based on dimensional reasoning, the k—s model took

Подпись: (7.153)Є = kV2/s

where є is the viscous dissipation rate per unit mass and should not be confused with the eddy viscosity, sT. A transport equation for s was then derived from the Navier – Stokes equations.

Both this equations for є and the turbulence kinetic energy к contain terms involving additional unknown dependent variables. These terms must be modelled semi-empirically. For flows at high Reynolds number the transport equations for к and є are modelled as follows:

The k-є method - A typical two-equation method Подпись: (7.154)

Turbulence energy:

Energy dissipation:

Подпись: (7.155)De d (dst ds є /ди2 _ рє2

pW< = + – C2X

The k-є method - A typical two-equation method Подпись: 1.3

These equations contain 5 empirical constants that are usually assigned the following values:

where ak and aE are often termed effective turbulence Prandtl numbers. Further modification of Eqns (7.154 and 7.155) is required to deal with relatively low Reynolds numbers. See Wilcox (1993) for details of this and the choice of wall boundary conditions.

The k—e model is intended for computational calculations of general turbulent flows. It is questionable whether it performs any better than, or even as well as, the zero-equation models described in Section 7.11.5 for boundary layers. But it can be used for more complex flows, although the results should be viewed with caution. A common misconception amongst practising engineers who use commercial CFD packages containing the k—s model is that they are solving the exact Navier-Stokes equations. They are, in fact, solving a system of equations that contains several approximate semi-empirical formulae, including the eddy-viscosity model described above. Real turbulent flows are highly unsteady and three-dimensional. The best one can expect when using the k—s, or any other similar turbulence model, is an approximate result that gives guidance to some of the features of the real turbulent flow. At worst, the results can be completely misleading, for an example, see the discussion in Wilcox (1993) of the round-jet/plane-jet anomaly.

For a full description and discussion of two-equation turbulence models and other more advanced turbulence models see Wilcox (1993), Pope (2000) and other special­ized books.

Zero-equation methods

Computational methods that are based on Eqns (7.144) and (7.145) plus semi­empirical formulae for eddy viscosity are often known as zero-equation methods. This terminology reflects the fact that no additional partial differential equations, derived from the Navier-Stokes equations, have been used. Here the Cebeci-Smith method[52] will be described. It was one of the most successful zero-equation methods developed in the 1970s.

Most of the zero-equation models are based on extensions of Prandtl’s mixing – length concept (see Sections 7.10.4 and 7.10.5), namely:

Zero-equation methods

The constant к is often known as the von Karman constant.

Three key modifications were introduced in the mid 1950s:

(1) Damping near the wall-. Van Driest*

An exponential damping function was proposed that comes into play as у —► 0. This reflects the reduction in turbulence level as the wall is approached and extends the mixing-length model into the buffer layer and viscous sub-layer:

іш = ку[ 1 – exp(-у+Мо)] Ao = 26

(2) Outer wake-like flow-. Clauser*

It was recognized that the outer part of a boundary layer is like a free shear layer (specifically, like a wake flow), so there the Prandtl-Gortler eddy-viscosity model, see Eqns (7.110) and (7.111), is more appropriate:

є — ax Ue6*

const.

where Ue is the flow speed at the edge of the boundary layer and 6* is the boundary – layer displacement thickness.

(3) Intermittency-. Corrsin and Kistler, and Klebannoff5

It was recognized that the outer part of the boundary layer is only intermittently turbulent (see Section 7.10.7 and Fig. 7.40). To allow for this it was proposed that єт be multiplied by the following semi-empirical intermittency factor:

Cebeci-Smith method

Подпись: where the mixing length Подпись: і = ку l-exp(-^)] Подпись: (7.147) (7.148)

The Cebeci-Smith method incorporates versions of these three key modifications. For the inner region of the turbulent boundary layer:

Term (i) is a semi-empirical modification of Van Driest’s damping model that takes into account the effects of the streamwise pressure gradient; к — 0.4 and Damping Length:

Подпись: (7.149) (7.150) Подпись:л 26i/

~ V^- 11.8(i/17e/F3)dl7e/dx)

For the outer region of the turbulent boundary layer: (єт)0 = aUe6*jtr yc< у <6

where a = 0.0168 when Reg > 5000. yc is determined by requiring

(єт)і = (єт)о at y = yc

See Cebeci and Bradshaw (1977) for further details of the Cebeci-Smith method.

It does a reasonably good job in calculating conventional turbulent boundary- layer flows. For applications involving separated flows, it is less successful and one – equation methods like that due to Baldwin and Lomax* are preferred.

For further details on the Baldwin-Lomax and other one-equation methods, including computer codes, Wilcox (1993) and other specialist texts should be con­sulted.

Computational solution of turbulent boundary layers

The simplest approach is based on the turbulent boundary-layer equations (7.108a, b) written in the form:

Подпись: (7.144) (7.145) du dv д^с + ду=°

_дй _дй dp д / дй – р-л йд-х + ~Уд-у = ~Тх + д-у^д-у-^)

No attempt is made to write these equations in terms of non-dimensional variables as was done for Eqns (7.131) and (7.132). A similar procedure would be advantageous for computational solutions, but it is not necessary for the account given here.

The primary problem with solving Eqns (7.131) and (7.132) is not computational. Rather, it is that there are only two equations, but three dependent variables to determine by calculation, namely m, v and mV. The ‘solution’ described in Section 7.10 is to introduce an eddy-viscosity model (see Eqn 7.109) whereby

Подпись: (7.146)— du ~pu V = рєг — dy

In order to solve Eqns (7.144) and (7.145), єт must be expressed in terms of м (and, possibly, v). This can only be done semi-empirically. Below in Section 7.11.5 it will be explained how a suitable semi-empirical model for the eddy viscosity can be devel­oped for computational calculation of turbulent boundary layers. First, a brief exposition of the wider aspects of this so-called turbulence modelling approach is given.

From the time in the 1950s when computers first began to be used by engineers, there has been a quest to develop increasingly more effective methods for computa­tional calculation of turbulent flows. For the past two decades it has even been possible to carry out direct numerical simulations (DNS) of the full unsteady, three­dimensional, Navier-Stokes equations for relatively simple turbulent flows at com­paratively low Reynolds numbers.[51] Despite the enormous advances in computer power, however, it is unlikely that DNS will be feasible, or even possible, for most engineering applications within the foreseeable future.* All alternative computational methods rely heavily on semi-empirical approaches known collectively as turbulent modelling. The modern methods are based on deriving additional transport equations from the Navier-Stokes equations for quantities like the various components of the Reynolds stress tensor (see Eqn 7.107), the turbulence kinetic energy, and the viscous dissipation rate. In a sense, such approaches are based on an unattainable goal, because each new equation that is derived contains ever more unknown quantities, so that the number of dependent variables always grows faster than the number of equations. As a consequence, an increasing number of semi-empirical formulae is required. Nevertheless, despite their evident drawbacks, the computational methods based on turbulence modelling have become an indispensable tool in modern

engineering. A brief account of one of the most widely used of these methods will be given in Section 7.11.6.

Increasingly, an alternative approach to this type of turbulence modelling is becoming a viable computational tool for engineering applications. This is large – eddy simulation (LES) that was first developed by meteorologists. It still relies on semi-empirical turbulence modelling, however. A brief exposition will be given in Section 7.11.7.

Computational solution of the laminar boundary-layer equations

Nowadays, with the ready availability of powerful desktop computers, it is perfectly feasible to solve the boundary-layer equations computationally in their original form as partial differential equations. Consequently, methods based on the momentum integral equation are now less widely used. Computational solution of the boundary – layer equations is now a routine matter for industry and university researchers alike, and suitable computer programs are widely available. Nevertheless, specialized numerical techniques are necessary and difficulties are commonly encountered. Good expositions of the required techniques and the pitfalls to be avoided are available in several textbooks.[49] All-purpose commercial software packages for computational fluid dynamics are also widely available. As a general rule such software does not handle boundary layers well owing to the fine resolution required near the wall*. Only a brief introduction to the computational methods used for boundary layers will be given here. For full details the recommended texts should be consulted.

It is clear from the examples given that in aeronautical applications boundary layers are typically very thin compared with the streamwise dimensions of a body like a wing. This in itself would pose difficulties for computational solution. For this reason equations (7.7) and (7.14) are usually used in the following non-dimensional form

Подпись: (7.131)Подпись: (7.132)dU 9V_ dX + dY~

dU dU _ dP &U UdX+VdY~ d X +dY2

where U = u/Urc, V = v/iRebUoo), P — p/(pU£.), X = x/L, and Y = y/(LReL). In many respects this form was suggested by the method of derivation given in Section 7.3.1. What this form of the equations achieves is to make the effective range of both independent variables X and Y similar in size, i. e. 0(1). The two dependent variables U and V are also both 0(1). Thus the grid used to discretize the equations for computational solution can be taken as rectangular and rectilinear, as depicted in Fig. 7.47.

Mathematically, the boundary-layer equations are what are termed parabolic. What this means for computational purposes is that one starts at some initial point X = Xq, say, where U is known as a function of Y, e. g. the stagnation-point solution (see Section 2.10.3) should be used in the vicinity of the fore stagnation point. The object of the computational scheme is then to compute the solution at Xq + AX where AX is a small step around the body surface. One then repeats this procedure until the trailing edge or the boundary-layer separation point is reached. For obvious

Fig. 7.47 reasons such a procedure is called a marching scheme. The fact that the equations are parabolic allows one to use such a marching scheme. It would not work for the Laplace equation, for example. In this case, quite different methods must be used (see Section 3.5).

The simplest approach is based on a so-called explicit finite-difference scheme. This will be briefly explained below.

It is assumed that the values of V are known along the line X — Xt, i. e. the discrete values at the grid points (like P) are known. The object is to devise a scheme for calculating the values of U at the grid points along X = T,+1. To do this we rewrite Eqn (7.132) in a form for determining dU/dX at the point P in Fig. 7.47. Thus

Computational solution of the laminar boundary-layer equations(7.133)

Values at X = Xi+ can then be estimated by writing

Computational solution of the laminar boundary-layer equations(7.134)

The last term on the right-hand side indicates the size of the error involved in using this approximation. The pressure gradient term in Eqn (7.133) is a known function of X obtained either from experimental data or from the solution for the potential flow around the body. But the other terms have to be estimated using finite differences. To obtain estimates for the first and second derivatives with respect to Y we start with Taylor expansions about the point P in the positive and negative Y directions. Thus we obtain

Computational solution of the laminar boundary-layer equationsComputational solution of the laminar boundary-layer equations

Подпись: i-l і i+l
Подпись: у
Подпись: P
Подпись: /
Computational solution of the laminar boundary-layer equations
Подпись: X

(7.135a)

(7.135b)

Viscous flow and boundaiy layers 461

<7Л36>

We then add Eqns (7.135a) and (7.135b) and rearrange to obtain the estimate

(0),= Uw’ U‘J~’+ °((Ar)i>- <7Л37)

The results given in Eqns (7.136) and (7.137) are usually referred as centred finite differences. Finally, the value of Vjj also has to be estimated. This has to be obtained from Eqn (7.131) which can be rewritten as

Computational solution of the laminar boundary-layer equations

There are two problems with this result. First it gives V, j+i rather than V,-,/, this is easily remedied by replacing j by j — 1 to obtain

Ш

dX


(7.138)


VUj = Vij—2 -2AY


U-1


The other problem is that it requires a value of (dU/dX)j j_l. But the very reason we needed to estimate Vtj in the first place was to obtain an estimate for (dU/dX)jj Fortunately, this does not represent a problem provided the calculations are done in the right order.

At the wall, say j = 0, U = V = 0 (assuming it to be impermeable), also from the continuity equation (7.131), dV/dY = 0. Thus, using an equation analogous to Eqn (7.135a),

With this estimate of F,- i, (dU/dX),■ j can now be estimated from Eqn (7.133), the first term on the right-hand side being equivalently zero. Ui+1, i is then estimated from Eqn (7.134). All the values are now known for j = 1. The next step is to set j = 2 in Eqn (7.138), so that

Подпись: (-) dXjiA Vt,2 = V, о -2AY
=o

(dU/dX)j 2 can now be estimated from Eqn (7.133) and so on right across the boundary layer. It is necessary, of course, to choose an upper boundary to the computational domain at a finite, but suitably large, height, у = Yj, corresponding to j = J, say.

This explicit finite-difference scheme is relatively simple to execute. But explicit schemes are far from ideal for boundary-layer calculations. Their main drawback is

that their use leads to numerical instability that is characterized by the solution displaying increasingly large oscillations as the calculation marches downstream leading to unacceptedly large errors. In order to ensure that this does not happen, it is necessary to impose the following condition on the streamwise step length in order to ensure numerical stability:

Подпись: (7.139)ДЛГ<і|тіп(С/і;;.)(ДУ)2

Since U is very small at the first grid point near the wall, very small values of AX will be required to ensure numerical stability.

Because of the problems with numerical instability, so-called implicit schemes are much to be preferred, because these permit step-size to be determined by considera­tions of accuracy rather than numerical stability. Here a scheme based on the Crank – Nicholson method will be briefly described. The essential idea is to rewrite Eqn

(7.134) Подпись: Ui+i j — Ujj +Подпись: (7.140)

Computational solution of the laminar boundary-layer equations

in the form

Подпись: dU_ ex Подпись: i+ij Computational solution of the laminar boundary-layer equations Computational solution of the laminar boundary-layer equations Подпись: (7.141)

So that the derivative at x = x,- is replaced by the average of that and the derivative at x = x,_i. Formally, this is more accurate and numerically much more stable. The problem is that Eqn (7.133) implies that

Computational solution of the laminar boundary-layer equations Computational solution of the laminar boundary-layer equations

and Eqns (7.136) and (7.137) imply that

Thus the unknown values of U at У,_ь i. e. Ui+j(j = 1,…,/), appear on both sides of Eqn (7.140). This is what is meant by the term implicit. In order to solve Eqn (7.140) for these unknowns it must be rearranged as a matrix equation of the form

AU = R

where A is the coefficient matrix, U is a column matrix containing the unknowns UiM. jti = 1, ■ ■ ■, J), and R is a column matrix of containing known quantities. Fortunately A has a tridiagonal form, i. e. only the main diagonal and the two diagonals either side of it are non-zero. Tridiagonal matrix equations can be solved very efficiently using the Thomas (or Tridiagonal) algorithm, versions of which can be found in Press et al. (loc. cit.) and on the Internet site associated with Ferziger (1998) {loc. cit.).

One of the most popular and widely used implicit schemes for computational solution of the boundary-layer equations is the Keller[50] box scheme which is slightly more accurate than the Crank-Nicholson method.

Transition prediction

The usual methods of determining the transition point are based on the so-called e" method developed by A. M.O. Smith and H. Gamberoni (1956) at Douglas Aircraft Co.[48] These methods are rather complex and involve specialized computational techniques. Fortunately, Smith and his colleagues have devised a simple, but highly satisfactory alternative.* They have found on a basis of predictions using the e" method that the transition Reynolds number Rext (where Rex = Uex/v) is related to the shape factor Я by the following semi-empirical formula:

log10(Re#) = -40.4557 + 64.8066Я – 26.7538Я2 + 3.3819Я3 2.1 < Я < 2.8

(7.130)

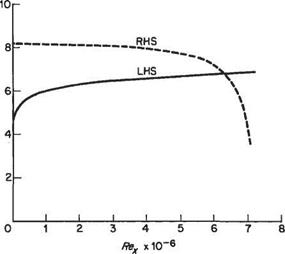
To use this method log10 (Rex) is plotted against x (distance along the surface from the fore stagnation point on the leading edge). A laminar boundary-layer calculation is carried out and the right-hand side of Eqn (7.130) is also plotted against x. Initially, the former curve will lie below the latter; the transition point is located at the value of x (or Rex) where the two curves first cross. This is illustrated in Fig. 7.46

Transition prediction

Fig. 7.46

where the left-hand side (denoted by LHS) and the right-hand side (denoted by RHS) of Eqn (7.130), calculated for the case of the circular cylinder illustrated in Fig. 7.45, are plotted against Rex. In this case, the two curves cross at a value of Rex — 6.2 x 10⁶ and this is taken to correspond to the transition point.

Computational methods

7.11.1 Methods based on the momentum integral equation

Подпись: d0 dx Подпись: Q К 2 Uc Подпись: 0 dt/e, —Я + 2 Ue dx Подпись: (7.127)

In the general case with an external pressure gradient the momentum integral equation must be solved numerically. There are a number of ways in which this can be done. One method for laminar boundary layers is to use the approximate expressions (7.64a’,b’,c’) with Eqn (7.59) (or 7.98) rewritten as

d0/dx can be related to d<$/dx as follows:

dв d(6I) _ d6 dl _ d6 dl dA d<5

d. v dx dx dx dx dA d<$ dx

Подпись: dS dx . dl dA = |, + SdAdi

It follows from Eqns (7.62d) and (7.64b’) respectively that

dA 262 dUc

=—- ^~ = 2A

d о v dx

d / П АЛ

dA“ “63 15 + 72У

So

Подпись: dfl dx (7.128)

where

. 4 ч r 2Л / l A 1 ^ _ “ 63 (l5 + 72

Thus Eqn (7.127) could be readily converted into an equation for ddi/dx by dividing both sides by E’i(A). The problem with doing this is that it follows from Eqn (7.64c’) that

Thus in cases where either 6 = 0 or t/e = 0 at x = 0, the initial value of Q, and therefore the right-hand side of Eqn (7.127) will be infinite. These two cases are in fact the two most common in practice. The former corresponds to sharp leading edges and the latter to blunt ones. To deal with the problem identified above both sides of Eqn (7.127) are multiplied by 2Ue6/v, whereby with use of Eqn (7.128) it becomes

where use of Eqns (7.64a’,b’,c’) gives

Подпись:а л 3 , Л2 4 /37 Л A2 Е2(Л) -4 + т-—Л + — + —( — – — – —
To obtain the final form of Eqn (7.127) for computational purposes Fi(A)62dt/c/dx is added to both sides and then both sides are divided by Fi(A); thus

Подпись:dZ _ Тг(Л) д______ 2__M

dx F (А) Fi(A) v

Computational methods

where the dependent variable has been changed from 6 to Z = 62Ue/v. In the usual case when Vs = 0 the right-hand side of Eqn (7.129) is purely a function of A. Note that

Since Ue is a prescribed function of x this allows both Л and 6 to be obtained from a value of Z. The other quantities of interest can be obtained from Eqn (7.64a’, b’, c’).

With the momentum-integral equation in the form (7.129) it is suitable for the direct application of standard methods for numerical integration of ordinary differ­ential equations.* It is recommended that the fourth-order Runge-Kutta method be used. It could be used with an adaptive stepsize control, the advantage of which is that small steps would be chosen in regions of rapid change, e. g. near the leading edge, while larger steps would be taken elsewhere.

In order to begin the calculation it is necessary to supply initial values for Z and A at x = 0, say. For a sharp leading edge 6 = 0 giving Z = A = 0atx = 0, whereas for a round leading edge Ue = 0 and Z = 0 but Л = 7.052, see Example 7.8 above, this value of A should be used to evaluate the right-hand side of (7.129) at x = 0.

Computational methods

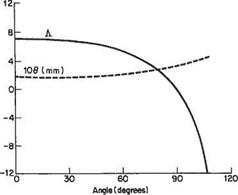
Boundary-layer computations using the method described above have been carried out for the case of a circular cylinder of radius 1 m in air flowing at 20m/s (v = 1.5 x 10⁻⁵ m2/s). In Fig. 7.45, the computed values of A and momentum

Fig. 7.45

Complete FORTRAN subroutines for this are to be found in W. H. Press etal. (1992) loc. cit.

thickness are plotted against angle around the cylinder’s surface measured from the fore stagnation point. A fourth-order Runge-Kutta integration scheme was used with 200 fixed steps between x = 0 and x = 3. This gave acceptable accuracy. According to this approximate calculation the separation point, corresponding to Л = —12, occurs at 106.7°. This should be compared with the accurately computed value of 104.5° obtained using the differential form of the equations of motion. Thus it can be seen that the Pohlhausen method gives reasonably acceptable results in terms of a comparison with more accurate methods. In point of fact neither value given above for the separation point is close to the actual value found experimentally for a laminar boundary layer. Experimentally, separation is found to occur just ahead of the apex of the cylinder. The reason for the large discrepancy between theoretical and observed separation points is that the large wake substantially alters the flow outside the boundary layer. This main-stream flow, accordingly, departs markedly from the potential-flow solution assumed for the boundary-layer calcula­tions. Boundary-layer theory only predicts the separation point accurately in the case of streamlined bodies with relatively small wakes. Nevertheless, the circular cylinder is a good test case for checking the accuracy of boundary-layer computations.

Numerical solutions of the momentum integral equation can also be found using Thwaites’ method.[47] This method does not make use of the Pohlhausen approximate velocity profile Eqn (7.63) or Eqn (7.65). It is very simple to use and for some applications it is more accurate than the Pohlhausen method described above. A suitable FORTRAN program for Thwaites method is given by Cebeci and Bradshaw (1977).

Computational methods based on the momentum integral equation are also available for the turbulent boundary layer. In this case, one or more semi-empirical relationships are also required in addition to the momentum integral equation. For example, most methods make use of the formula for Q due to Ludwieg and Tillmann (1949), namely

/77 7) —10-268

Cf = 0.246 x Ю-°-678іЧ—J

A very good method of this type is due to Head (1958)7 This method is relatively simple to use but, nevertheless, performs better than many of the much more com­plex methods based on the differential equations of motion. A FORTRAN program based on Head’s method is also given by Cebeci and Bradshaw loc. cit.

In order to begin the computation of the turbulent boundary layer using Head’s method it is necessary to locate the transition point and to supply initial values of 6 and H = 8*16. In Section 7.7.7, it was shown that for the boundary layer on a flat plate Eqn (7.89) held at the transition point, i. e. there is not a discontinuous change in momentum thickness. This applies equally well to the more general case. So once the transition point is located the starting value for 6 in the turbulent boundary layer is given by the final value in the laminar part. However, since transition is assumed to occur instantaneously at a specific location along the surface, there will be a discontinuous change in velocity profile shape at the transition point. This implies a discontinuous change in the shape factor H. To a reasonable approximation

Нл = Hu — AH

where

ДЯ = 0.821 +0.114loglo(Re0t) Reet< 5 x 10⁴ ДЯ= 1.357 Reei > 5 x 10⁴

Turbulence structure in the near-wall region

The dominance of the near-wall region in terms of turbulence kinetic energy and Reynolds shear stress motivated engineers to study it in more detail with a view to

Turbulence structure in the near-wall region

identifying the time-varying flow structures there. Kline etal[44] carried out a seminal study of this kind. They obtained hydrogen-bubble flow visualizations for the tur­bulent boundary layer. These revealed that streak-like structures develop within the viscous sub-layer. These are depicted schematically in Fig. 7.41. The streak-like structures are continuously changing with time. Observations over a period of time reveal that there are low – and high-speed streaks. The streak structures become less noticeable further away from the wall and apparently disappear in the law-of-the – wall region. In the outer region experiments reveal the turbulence to be intermittent and of larger scale (Fig. 7.41).

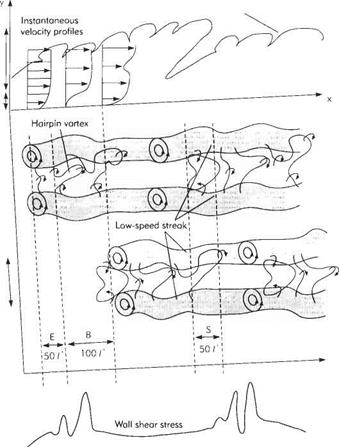
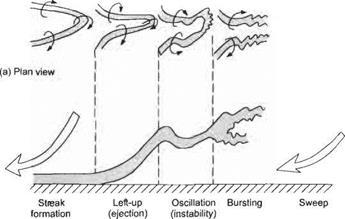
The conventional view is that the streaks are a manifestation of the existence of developing hair-pin vortices. See Figs 7.41 and 7.42 for a schematic illustration of the conceptual burst cycle of these structures, that is responsible for generating transient high levels of wall shear stress. The development of the ‘hair pin vortices’ tends to be quasi-periodic with the following sequence of events:

(i) Formation of the low-speed streaks: During this process the legs of the vortices lie close to the wall.

(ii) Lift-up or ejection: Stage E in Fig. 7.41. The velocity induced by these vortex legs tends to cause the vortex head to lift off away from the wall.

(iii) Oscillation or instability. The first part of Stage В in Fig. 7.41. A local point of inflexion develops in the velocity profile and the flow becomes susceptible to Helmholtz instability locally causing the head of the vortex to oscillate fairly violently.

(iv) Bursting or break-up: The latter part of Stage В in Fig. 7.41. The oscillation culminates in the vortex head bursting.

(v) High-speed sweep: Stage S in Fig. 7.41. After a period of quiescence the bursting event is followed by a high-speed sweep towards the wall. It is during this process that the shear stress at the wall is greatest and the new hairpin-vortex structures are generated.

It should be understood that Fig. 7.41 is drawn to correspond to a frame moving downstream with the evolving vortex structure. So a constant streamwise velocity is superimposed on the ejections and sweeps.

Turbulence structure in the near-wall region

Instantaneous boundary-layer edge


Outer region


Wall region


Streak spacing 100/+


Fig. 7.41 Schematic of flow structures in a turbulent boundary layer showing the conceptual burst cycle E, ejection stage; B, break-up stage; S, sweep stage.


Turbulence structure in the near-wall region

The events described above are quasi-periodic in a statistical sense. The mean values of their characteristics are as follows: spanwise spacing of streaks = 100u/Vt; they reach a vertical height of 50i//K[45]; their streamwise extent is about 1000v/V*; and the bursting frequency is about 0.004 V^/v. This estimate for bursting frequency is still a matter of some controversy. Some experts* think that the bursting frequency does not scale with the wall units, but other investigators have suggested that this result is an artefact of the measurement system.* Much greater detail on these near­wall structures together with the various concepts and theories advanced to explain their formation and regeneration can be found in Panton.*

Turbulence structure in the near-wall region

(b) Side view

Fig. 7.42 Schematic of the evolution of a hairpin vortex in the near-wall region

Example 7.10 Determining specifications of a MEMS actuator for flow control Modern technology is rapidly developing the capability of making very small machines that, among many other applications, can be used for actuation and sensing in flow-control systems. Such machines are collectively known as MEMS (Micro-electro-mechanical Systems). The term is usually used to refer to devices that have characteristic overall dimensions of less than 1 mm but more than 1 pm. Such devices combine electrical and mechanical components that are manufactured by means of integrated circuit batch-processing techniques.[46]

A conceptual MEMS actuator for use as part of a flow-control system is depicted schema­tically in Fig. 7.43. This device consists of a diaphragm located at the bottom of a buried cavity that connects to the boundary layer via an exit orifice. The diaphragm would be made of silicon or a suitable polymeric material and driven by a piezoceramic driver. When a voltage is applied to the driver, depending on the sign of the electrical signal, it either contracts or expands, thereby displacing the diaphragm up or down. Thus, if an alternating voltage is applied to the diaphragm, it will be periodically driven up and down. This in turn will alternately reduce and increase the volume of the cavity, thereby raising then reducing the air pressure there. An elevated cavity pressure will drive air through the exit orifice into the boundary layer followed by air returning to the cavity when the cavity pressure falls. This periodic outflow and inflow creates what is termed a synthetic jet. Despite the fact that over a cycle there is no net air leaving the cavity, vortical structures propagate into the boundary layer, much as they would from a steady micro-jet. It is also possible to drive the diaphragm with short-duration steady voltage thereby displacing the diaphragm suddenly upward and driving a ‘puff of air into the boundary layer. f

Fig. 7.43 Schematic sketch of a jet-type actuator

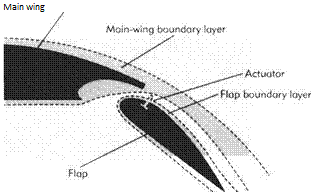
It has been proposed that synthetic-jet actuators be used to control the near-wall, streak­like, structures in the turbulent boundary layer over the flap of a large airliner. In particular, the aim is to increase the so-called bursting frequency in order to increase the level of turbulence. The increased turbulence level would be expected to lead to a delay of boundary – layer separation, allowing the flap to be deployed at a larger angle of incidence, thereby increasing its performance. The basic concept is illustrated in Fig. 7.44. The question to be addressed here is what dimensions and specifications should be chosen for the MEMS actuator in this application.

Подпись: Thus

Consider an aircraft similar to the Airbus A340 with a mean wing chord of 6 m and a flap chord of 1.2 m. Assume that the approach speed is about 100 m/s and assume standard sea – level conditions so that the kinematic viscosity of the air is around 15 x 10-6m2/s. It is proposed to locate the array of MEMS actuators near the point of minimum pressure 200 mm from the leading edge of the flap. A new boundary layer will develop on the flap underneath the separated boundary layer from the main wing. This will ensure that the flap boundary layer is strongly disturbed provoking early transition to turbulence.

Подпись: 1.33 x 10⁶.

Turbulence structure in the near-wall region

„ _ xUe 0.2 x 100

Подпись: Main wing

~ ” 15 x 10-6

Fig. 7.44

In a low-disturbance environment we would normally expect the boundary layer to be laminar at this Reynolds number (see Section 7.9), but the flap boundary layer is highly disturbed by the separated boundary layer from the main wing, ensuring early transition. Using Eqn (7.121) we can estimate the local skin-friction coefficient, i. e.

cf = (21og10(1.33 x 10⁶) – 0.65)-2’3 = 0.00356.

Подпись: Tw=ipl72Cf ~^x 1.2 x 1002 x 0.00356 = 21.36Pa, Подпись: v. = J— = V P Turbulence structure in the near-wall region

From this we can then estimate the wall shear stress and friction velocity, thus

The boundary-layer thickness is not strictly needed for determining the actuator specifications, but it is instructive to determine it also. In Eqn (7.71) it was shown that Cm = 2©(L)/L, i. e. there is a relationship between the coefficient of skin-friction drag and the momentum thick­ness at the trailing edge. This relationship can be exploited to estimate the momentum thickness in the present application. We merely assume for this purpose that the flap boundary layer terminates at the point in question, i. e. at x = 200 mm, so that

(1оё10Яе*)2-58 {logio(1.33 x 10«)}

Подпись: Using Eqn (7.122) CD f(x) = ■ Thus Подпись: 0.455 Подпись: 0.455 Turbulence structure in the near-wall region

©M = ^Стіх).

0(x) =^Cdr(x) = x 0.00424 ~ 425 pm.

From Eqn (7.83)

0.424

Подпись: 0.09730 = 0.09736 giving 6 = = 4.36 mm.

This illustrates yet again just how thin the boundary layer actually is in aeronautical applica­tions.

We can now calculate the wall unit and thence the other dimensions of interest.

Wall unit:

15 xl0“6

t=Vt=^.22-^3’5^’

Viscous sub-layer thickness:

5(.+ ~ 17.5 pm;

Average spanwise spacing of streaks:

100 ~ 350 pm;

Bursting frequency:

Подпись: ~ 4.8 kHz.V2 4.22

0.004— = 0.004 X ———v v 3.5 x 10~6

This suggests that the spanwise dimensions of the MEMS actuators should not exceed about 100 pm; i. e. about 30 per cent of average spanwise streak spacing. They also need to be able to effect control at frequencies of at least ten times the bursting frequency, say 50 kHz.

Distribution of Reynolds stresses and turbulent kinetic energy across the boundary layer

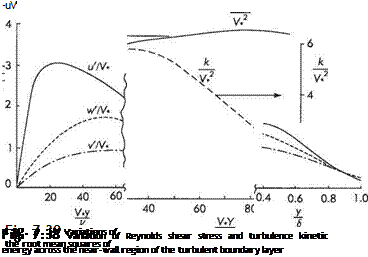
Figure 7.38 plots the variation of Reynolds shear stress and kinetic energy (per unit mass), к = (і/2 + Vа + wa)j2 across the boundary layer. What is immediately striking is how comparatively high the levels are in the near-wall region. The Reynolds shear stress reaches a maximum at about y+ ~ 100 while the turbulence kinetic energy appears to reach its maximum not far above the edge of the viscous sub-layer.

Figure 7.39 plots the distributions of the so-called turbulence intensities of the velocity components, i. e. the square-roots of the direct Reynolds stresses, г/2, va and wa. Note that in the outer part of the boundary layer the three turbulent intensities tend to be the same (they are ‘isotropic’), but they diverge widely as the wall is approached (i. e. they become ‘anisotropic’). The distribution of eddy viscosity across

Distribution of Reynolds stresses and turbulent kinetic energy across the boundary layer

Iа, v’2 and wa across a turbulent boundary layer

the turbulent boundary layer is plotted in Fig. 7.40. This quantity is important for engineering calculations of turbulent boundary layers. Note that the form adopted in Eqn (7.112) for the near-wall region according to the mixing-length theory with £m cc у is borne out by the behaviour shown in the figure.

If a probe were placed in the outer region of a boundary layer it would show that the flow is only turbulent for part of the time. The proportion of the time that the flow is turbulent is called the intermittency (7). The intermittency distribution is also plotted in Fig. 7.40.