It was mentioned in Section 7.2.5 above that transition from laminar to turbulent flow usually occurs at some point along the surface. This process is exceedingly complex and remains an active area of research. Owing to the very rapid changes in both space and time the simulation of transition is, arguably, the most challenging problem in computational fluid dynamics. Despite the formidable difficulties however, considerable progress has been made and transition can now be reliably predicted in simple engineering applications. The theoretical treatment of transition is beyond the scope of the present work. Nevertheless, a physical understanding of transition is vital for many engineering applications of aerodynamics, and accordingly a brief account of the underlying physics of transition in a boundary layer on a flat plate is given below.
Transition occurs because of the growth of small disturbances in the boundary layer. In many respects, the boundary layer can be regarded as a complex nonlinear oscillator that under certain circumstances has an initially linear wave-like response to external stimuli (or inputs). This is illustrated schematically in Fig. 7.28. In free flight or in high-quality wind-tunnel experiments several stages in the process can be discerned. The first stage is the conversion of external stimuli or disturbances into low-amplitude waves. The external disturbances may arise from a variety of different sources, e. g. free-stream turbulence, sound waves, surface roughness and vibration. The conversion process is still not well understood. One of the main difficulties is that the wave-length of a typical external disturbance is invariably very much larger than that of the wave-like response of the boundary layer. Once the low-amplitude wave is generated it will propagate downstream in the boundary layer and, depending on the local conditions, grow or decay. If the wave-like disturbance grows it will eventually develop into turbulent flow.
While their amplitude remains small the waves are predominantly two-dimensional (see Figs 7.28 and 7.29). This phase of transition is well understood and was first explained theoretically by Tollmien[38] with later extensions by Schlichtingt and many others. For this reason the growing waves in the early so-called linear phase of transition are known as Tollmien-Schlichting waves. This linear phase extends for some 80% of the total transition region. The more advanced engineering predictions
|
|
|
Laminar flow Linear stage urDI
—————- — flow
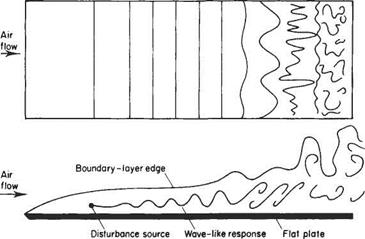
Fig. 7.28 Schematic of transition in a boundary layer over a flat plate, with disturbances generated by a harmonic line source
|
|
|
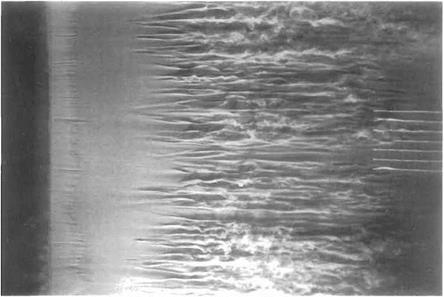
Fig. 7.29 Laminar-turbulent transition in a flat-plate boundary layer: This is a planform view of a dye sheet emitted upstream parallel to the wall into water flowing from left to right. Successive stages of transition are revealed, i. e. laminar flow on the upstream side, then the appearance of the two-dimensional Tollmien- Schlichting waves, followed by the formation of turbulent spots and finally fully developed turbulent flow. The Reynolds number based on distance along the wall is about 75 000. See Fig. 7.28 above for a schematic side – view of the transition process. (The photograph was taken by H. Werle at ONERA, France.)
|
|
are, in fact, based on modern versions of Tollmien’s linear theory. The theory is linear because it assumes the wave amplitudes are so small that their products can be neglected. In the later nonlinear stages of transition the disturbances become increasingly three-dimensional and develop very rapidly. In other words as the amplitude of the disturbance increases the response of the boundary layer becomes more and more complex.
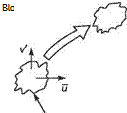
This view of transition originated with Prandtl* and his research team at Gottingen, Germany, which included Tollmien and Schlichting. Earlier theories, based on neglecting viscosity, seemed to suggest that small disturbances could not grow in the boundary layer. One effect of viscosity was well known. Its so-called dissipative action in removing energy from a disturbance, thereby causing it to decay. Prandtl realized that, in addition to its dissipative effect, viscosity also played a subtle but essential role in promoting the growth of wave-like disturbances by causing energy to be transferred to the disturbance. His explanation is illustrated in Fig. 7.30. Consider a small-amplitude wave passing through a small element of fluid within the boundary
|
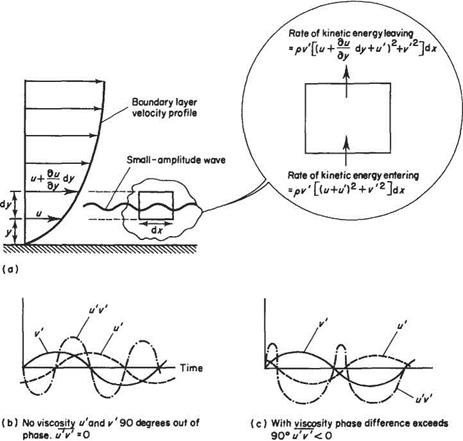
Fig. 7.30 Prandtl’s explanation for disturbance growth
|
L. Prandtl (1921) Bermerkungen iiber die Enstehung der Turbulenz, Z. angew. Math. Mech., 1, 431-436.
layer, as shown in Fig. 7.30a. The instantaneous velocity components of the wave are (г/, V) in the (jt, y) directions, u’ and V are very much smaller than u, the velocity in the boundary layer in the absence of the wave. The instantaneous rate of increase in kinetic energy within the small element is given by the difference between the rates at which kinetic energy leaves the top of the element and enters the bottom, i. e.
-pu’v’^- + higher order terms
dy
In the absence of viscosity vi and V are exactly 90 degrees out of phase and the average of their product over a wave period, denoted by u’V, is zero, see Fig. 7.30b. However, as realized by Prandtl, the effects of viscosity are to increase the phase difference between u’ and V to slightly more than 90 degrees. Consequently, as shown in Fig. 7.30c, mV is now negative, resulting in a net energy transfer to the disturbance. The quantity — puV is, in fact, the Reynolds stress referred to earlier in Section 7.2.4. Accordingly, the energy transfer process is usually referred to as energy production by the Reynolds stress. This mechanism is active throughout the transition process and, in fact, plays a key role in sustaining the fully turbulent flow (see Section 7.10).
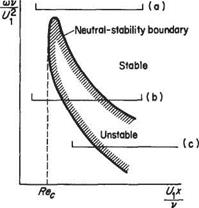
Tollmien was able to verify Prandtl’s hypothesis theoretically, thereby laying the foundations of the modern theory for transition. It was some time, however, before the ideas of the Gottingen group were accepted by the aeronautical community. In part this was because experimental corroboration was lacking. No sign of Tollmien- Schlichting waves could at first be found in experiments on natural transition. Schubauer and Skramstadt[39] did succeed in seeing them but realized that in order to study such waves systematically they would have to be created artificially in a controlled manner. So they placed a vibrating ribbon having a controlled frequency, cu, within the boundary layer to act as a wave-maker, rather than relying on natural sources of disturbance. Their results are illustrated schematically in Fig. 7.31. They found that for high ribbon frequencies, see Case (a), the waves always decayed. For intermediate frequencies (Case (b)) the waves were attenuated just downstream of the ribbon, then at a greater distance downstream they began to grow, and finally at still greater distances downstream decay resumed. For low frequencies the waves grew until their amplitude was sufficiently large for the nonlinear effects, alluded to above, to set in, with complete transition to turbulence occurring shortly afterwards. Thus, as shown in Fig. 7.31, Schubauer and Skramstadt were able to map out a curve of nondimensional frequency versus Rex{= U^xjv) separating the disturbance frequencies that will grow at a given position along the plate from those that decay. When disturbances grow the boundary-layer flow is said to be unstable to small disturbances, conversely when they decay it is said to be stable, and when the disturbances neither grow nor decay it is in a state of neutral stability. Thus the curve shown in Fig. 7.31 is known as the neutral-stability boundary or curve. Inside the neutral-stability curve, production of energy by the Reynolds stress exceeds viscous dissipation, and vice versa outside. Note that a critical Reynolds number Rec and critical frequency ujc exist. The Tollmien-Schlichting waves cannot grow at Reynolds numbers below Rec or at frequencies above cuc. However, since the disturbances leading to transition to turbulence are considerably lower than the critical frequency, the transitional Reynolds number is generally considerably greater than Rec.
The shape of the neutral-stability curve obtained by Schubauer and Skramstadt agreed well with Tollmien’s theory, especially at the lower frequencies of interest for
Boundary-layer edge _________
 (a)
(a)
тшшщтшшїшяшшшг/.
Wall

 (b)
(b)
фтт/Ш/ІЩ№
жттттштжттх
transition. Moreover Schubauer and Skramstadt were also able to measure the growth rates of the waves and these too agreed well with Tollmien and Schlichting’s theoretical calculations. Publication of Schubauer and Skramstadt’s results finally led to the Gottingen ‘small disturbance’ theory of transition becoming generally accepted.
It was mentioned above that Tollmien-Schlichting waves could not be easily observed in experiments on natural transition. This is because the natural sources of disturbance tend to generate wave packets in an almost random fashion in time and space. Thus at any given instant there is a great deal of ‘noise’, tending to obscure the wave-like response of the boundary layer, and also disturbances having a wide range of frequencies are continually being generated. In contrast, the Tollmien – Schlichting theory is based on disturbances with a single frequency. Nevertheless, providing the initial level of the disturbances is low, what seems to happen is that the boundary layer responds preferentially, so that waves of a certain frequency grow most rapidly and are primarily responsible for transition. These most rapidly growing waves are those predicted by the modern versions of the Tollmien-Schlichting theory, thereby allowing the theory to predict, approximately at least, the onset of natural transition.
It has been explained above that provided the initial level of the external disturbances is low, as in typical free-flight conditions, there is a considerable difference between the critical and transitional Reynolds number. In fact, the latter is about 3 x 10⁶ whereas Rec ~ 3 x 10⁵. However, if the initial level of the disturbances rises, for example because of increased free-stream turbulence or surface roughness, the
downstream distance required for the disturbance amplitude to grow sufficiently for nonlinear effects to set in becomes shorter. Therefore, the transitional Reynolds number is reduced to a value closer to Rec. In fact, for high-disturbance environments, such as those encountered in turbomachinery, the linear phase of transition is by-passed completely and laminar flow breaks down very abruptly into fully developed turbulence.
The Tollmien-Schlichting theory can also predict very successfully how transition will be affected by an external pressure gradient. The neutral-stability boundaries for the flat plate and for typical adverse and favourable pressure gradients are plotted schematically in Fig. 7.32. In accordance with the theoretical treatment Reg is used as the abscissa in place of Rex. However, since the boundary layer grows with passage downstream Reg can still be regarded as a measure of distance along the surface. From Fig. 7.32 it can be readily seen that for adverse pressure gradients not only is (Reg)c smaller than for a flat plate, but a much wider band of disturbance frequencies are unstable and will grow. When it is recalled that the boundary-layer thickness also grows more rapidly in an adverse pressure gradient, thereby reaching a given critical value of Reg sooner, it can readily be seen that transition is promoted under these circumstances. Exactly the converse is found for the favourable pressure gradient. This circumstance allows rough and ready predictions to be made for the transition
|
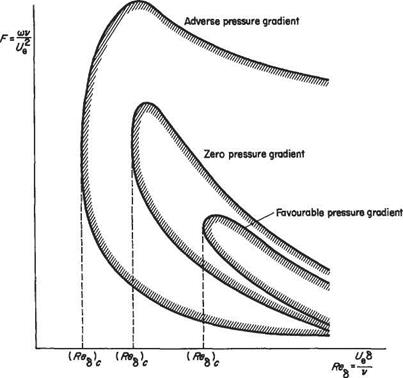
Fig. 7.32 Schematic plot of the effect of external pressure gradient on the neutral stability boundaries
|
|
|
|
|
|
|
|
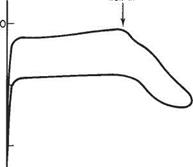
Fig. 7.33 Modern laminar-flow aerofoil and its pressure distribution
|
|

point on bodies and wings, especially in the case of the more classic streamlined shapes. These guidelines may be summarized as follows:
(i) If 105 < ReL < 107 (where ReL = V^Ljv is based on the total length or chord of the body or wing) then transition will occur very shortly downstream of the point of minimum pressure. For aerofoils at zero incidence or for streamlined bodies of revolution, the point of minimum pressure often, but not invariably, coincides with the point of maximum thickness.
(ii) If for an aerofoil ReL is kept constant increasing the angle of incidence advances the point of minimum pressure towards the leading edge on the upper surface, causing transition to move forward. The opposite occurs on the lower surface.
(iii) At constant incidence an increase in ReL tends to advance transition.
(iv) For ReL > 107 the transition point may slightly precede the point of minimum pressure.
The effects of external pressure gradient on transition also explain how it may be postponed by designing aerofoils with points of minimum pressure further aft. A typical modern aerofoil of this type is shown in Fig. 7.33. The problem with this type of aerofoil is that, although the onset of the adverse pressure gradient is postponed, it tends to be correspondingly more severe, thereby giving rise to boundary-layer separation. This necessitates the use of boundary-layer suction aft of the point of minimum pressure in order to prevent separation and to maintain laminar flow. See Section 7.4 and 8.4.1 below.
7.10 The physics of turbulent boundary layers
In this section, a brief account is given of the physics of turbulent boundary layers. This is still very much a developing subject and an active research topic. But some classic empirical knowledge, results and methods have stood the test of time and are worth describing in a general textbook on aerodynamics. Moreover, turbulent flows are so important for engineering applications that some understanding of the relevant flow physics is essential for predicting and controlling flows.
![]() cf =r^- = (2 log10 Rex – 0.65)-2’3 jPUSo
cf =r^- = (2 log10 Rex – 0.65)-2’3 jPUSo


 dr
dr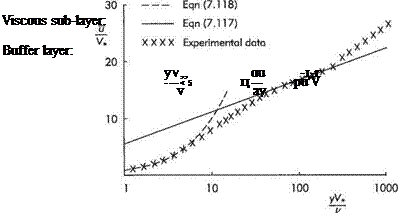

 (7.112)


 (7.100)
 V
V


 – du ~n ’ axy = ^-f^v
 (7.107)


 (a)
(a)


 = —c = const, v



![Mixed boundary layer flow on a flat plate with zero pressure gradient Подпись: [35.5p5/8 x 16480 + 55.8 x 10⁵ - 55.8 x 10⁵/>]4/5](/img/3130/image1469.gif)
