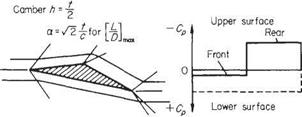
The shock-expansion approximation
The supersonic linearized theory has the advantage of giving relatively simple formulae for the aerodynamic characteristics of aerofoils. However, as shown below in Example 6.13 the exact pressure distribution can be readily found for a double-wedge aerofoil. Hence the coefficients of lift and drag can be obtained.
Example 6.13 Consider a symmetrical double-wedge aerofoil at zero incidence, similar in shape to that in Fig. 6.44 above, except that the semi-wedge angle eo = 10°. Sketch the wave pattern for Mx = 2.0, calculate the Mach number and pressure on each face of the aerofoil, and hence determine Co – Compare the results with those obtained using the linear theory. Assume the free-stream stagnation pressure, po<» = 1 bar.
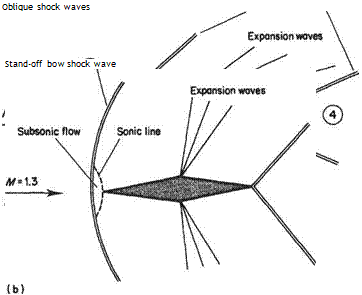
The wave pattern is sketched in Fig. 6.54a. The flow properties in the various regions can be obtained using isentropic flow and oblique shock tables.[33] In region 1 M — MB0 = 2.0 and pooo = 1 bar. From the isentropic flow’ tables po/pі = 7.83 leading to p = 0.1277 bar. In region 2 the oblique shock-wave tables give pijp = 1.7084 (leading to p2 = 0.2182 bar), M2 = 1.6395 and shock angle = 39.33°. Therefore
^ Pi — Рос (pi/px)-1 (Pi/P^)- 1
*~p2 — ] — ] — і
2 l’oc 2 7 (А» /Трсо) vx —
_ (0.2182/0.1277)-! _
0.5 x 1.4 x 22
Fig. 6.54
(Using the linear theory, Eqn (6.145) gives
2s 2 x (10s/180)
Сгі – ~ vp-i ■o m)
In order to continue the calculation into region 3 it is first necessary to determine the Prandtl-Meyer angle and stagnation pressure in region 2. These can be obtained as follows using the isentropic flow tables: ркіірі = 4.516 givingрю = 4.516 x 0.2182 = 0.9853 bar; and Mach angle, pa = 37.57° and Prandtl-Meyer angle, V2 = 16.01°.
Between regions 2 and 3 the flow expands isentropically through 20° so V3 = V2 + 20° = 36.01°. From the isentropic flow tables this value of V3 corresponds to М3 = 2.374, /із = 24.9° and

/>оз//>з = 14.03. Since the expansion ръ = 0.9853/14.03 = 0.0702 bar. Thus
There is an oblique shock wave between regions 3 and 4. The obUque shock tables give рлІРз — 1.823 andM4 = 1.976 giving/>4 = 1.823 x 0.0702 = 0.128 bar and a shock angle of 33.5°. The drag per unit span acting on the aerofoil is given by resolving the pressure forces, so that
 D = 2(p2 — рз) x. x sin(10°)
so
Cd = (Cp2 – Срз) tan(10°) = 0.0703 (Using the linear theory, Eqn (6.151) with a = 0 gives
It can be seen from the calculations above that, although the linear theory does not approximate the value of Cp very accurately, it does yield an accurate estimate of Cd.
When Mao = 1.3 it can be seen from the obUque shock tables that the maximum compression angle is less than 10°. This imphes that in this case the flow can only negotiate the leading edge by being compressed through a shock wave that stands off from the leading edge and is normal to the flow where it intersects the extension of the chord line. This leads to a region of subsonic flow being formed between the stand-off shock wave and the leading edge. The corresponding flow pattern is sketched in Fig. 6.54b.
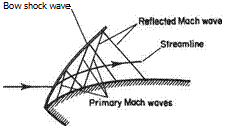
A similar procedure to that in Example 6.13 can be followed for aerofoils with curved profiles. In this case, though, the procedure becomes approximate because it ignores the effect of the Mach waves reflected from the bow shock wave – see Fig. 6.55. The so-called shock-expansion approximation is made clearer by the example given below.
Example 6.14 Consider a biconvex aerofoil at zero incidence in supersonic flow at = 2, similar in shape to that shown in Fig. 6.46 above so that, as before, the shape of the upper surface is given by
у = хєо (l — “) giving local flow angle 0(= a) = arc tan e0 ^1 —
Fig. 6.55
Calculate the pressure and Mach number along the surface as functions of x/c for the case of єо = 0.2. Compare with the results obtained with linear theory. Take the freestream stagnation pressure to be 1 bar.
Region 1 as in Example 6.13, i. e. Mi = 2.0, рої = 1 bar and p = 0.1277 bar At x = 0 в — arctan(0.2) = 11.31°. Hence initially the flow is turned by the bow shock through an angle of 11.31°, so using the oblique shock tables gives Р2ІР1 = 1.827 and М2 = 1.59. Thus p2 = 1.827 x 0.1277 = 0.233 bar. From the isentropic flow tables it is found that М2 = 1.59 corresponds to Р02ІР2 = 4.193 giving рог = 0.977 bar.
Thereafter the pressures and Mach numbers around the surface can be obtained using the isentropic flow tables as shown in the table below.
|
X
c
|
tan в
|
в
|
Д0
|
V
|
M
|
El
Р
|
Р (bar)
|
ср
|
(СР)ш
|
|
0.0
|
0.2
|
11.31°
|
0°
|
14.54°
|
1.59
|
4.193
|
0.233
|
0.294
|
0.228
|
|
0.1
|
0.16
|
9.09°
|
2.22°
|
16.76°
|
1.666
|
4.695
|
0.208
|
0.225
|
0.183
|
|
0.2
|
0.12
|
6.84°
|
4.47°
|
19.01°
|
1.742
|
5.265
|
0.186
|
0.163
|
0.138
|
|
0.3
|
0.08
|
4.57°
|
6.74°
|
21.28°
|
1.820
|
5.930
|
0.165
|
0.104
|
0.092
|
|
0.5
|
0.0
|
0.0
|
11.31°
|
25.85°
|
1.983
|
7.626
|
0.128
|
0.0008
|
0
|
|
0.7
|
-0.08
|
-4.57°
|
15.88°
|
30.42°
|
2.153
|
9.938
|
0.098
|
-0.0831
|
-0.098
|
|
0.8
|
-0.12
|
-6.84°
|
18.15°
|
32.69°
|
2.240
|
11.385
|
0.086
|
-0.1166
|
-0.138
|
|
0.9
|
-0.16
|
-9.09°
|
20.40°
|
34.94°
|
2.330
|
13.104
|
0.075
|
-0.1474
|
-0.183
|
|
1.0
|
-0.20
|
-11.31°
|
22.62°
|
37.16°
|
2.421
|
15.102
|
0.065
|
-0.1754
|
-0.228
|


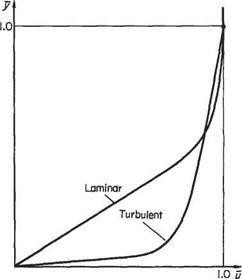
![Further thought about the thickening process will make it evident that the increase in velocity that takes place along a normal to the surface must be continuous. Let у be the perpendicular distance from the surface at any point and let и be the correspond­ing velocity parallel to the surface. If и were to increase discontinuously with у at any point, then at that point du/dy would be infinite. This would imply an infinite shearing stress [since the shear stress r = fi(du/dy)] which is obviously untenable Further thought about the thickening process will make it evident that the increase in velocity that takes place along a normal to the surface must be continuous. Let у be the perpendicular distance from the surface at any point and let и be the correspond­ing velocity parallel to the surface. If и were to increase discontinuously with у at any point, then at that point du/dy would be infinite. This would imply an infinite shearing stress [since the shear stress r = fi(du/dy)] which is obviously untenable](/img/3130/image1266.jpg)
![Further thought about the thickening process will make it evident that the increase in velocity that takes place along a normal to the surface must be continuous. Let у be the perpendicular distance from the surface at any point and let и be the correspond­ing velocity parallel to the surface. If и were to increase discontinuously with у at any point, then at that point du/dy would be infinite. This would imply an infinite shearing stress [since the shear stress r = fi(du/dy)] which is obviously untenable Подпись: (a)](/img/3130/image1267_0.gif)
![Further thought about the thickening process will make it evident that the increase in velocity that takes place along a normal to the surface must be continuous. Let у be the perpendicular distance from the surface at any point and let и be the correspond­ing velocity parallel to the surface. If и were to increase discontinuously with у at any point, then at that point du/dy would be infinite. This would imply an infinite shearing stress [since the shear stress r = fi(du/dy)] which is obviously untenable Further thought about the thickening process will make it evident that the increase in velocity that takes place along a normal to the surface must be continuous. Let у be the perpendicular distance from the surface at any point and let и be the correspond­ing velocity parallel to the surface. If и were to increase discontinuously with у at any point, then at that point du/dy would be infinite. This would imply an infinite shearing stress [since the shear stress r = fi(du/dy)] which is obviously untenable](/img/3130/image1268.jpg)
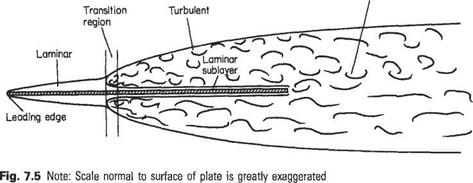
![Viscous flow and boundary layers[35] Подпись: Fig. 7.1](/img/3130/image1264_0.gif)
![Viscous flow and boundary layers[35] Viscous flow and boundary layers[35]](/img/3130/image1265_0.gif)

