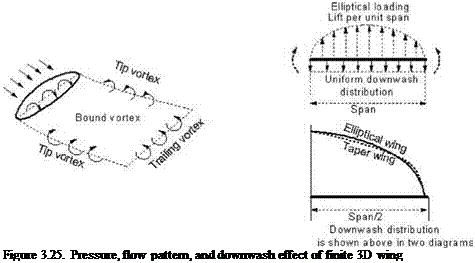
To incorporate the tip effects of a 3D wing, 2D test data need to be corrected for Re and span. This section describes an example of the methodology.
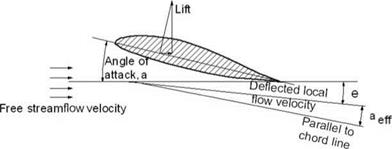
Equation 3.25 indicates that a 3D wing will produce aeff at an attitude when the aerofoil is at the angle of attack, a. Because aeff is always less than a, the wing produces less CL corresponding to aerofoil Ci (see Figure 3.28). This section describes
Figure 3.27. Lift-curve-slope correction for aspect ratio
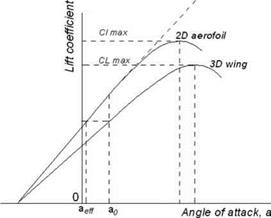 how to correct the 2D aerofoil data to obtain the 3D wing lift coefficient, CL, versus the angle of attack, a, relationship. Within the linear variation, dCL/da needs to be evaluated at low angles (e. g., from -2 to 8 deg).
The 2D aerofoil lift-curve slope a0 = (dCL/da), (3.32)
where a = angle of attack (incidence).
The 2D aerofoil will generate the same lift at a lower a of aeff (see Equation 3.25) than what the wing will generate at a (a3D > a2D). Therefore, using the 2D aerofoil data, the wing lift coefficient CL can be worked at the angle of attack, a, as shown here (all angles are in degrees). The wing lift at an angle of attack, a, is as follows:
CL = a0 x aeff + constant = a0 x (a – e) + constant (3.33)
or
CL = a0 x (a – 57.3CL/ep./AR) + constant
or
CL + (57.3 CL x a0/e^AR) = a0 x a + constant
or
CL = (a0 x a)/[1 + (57.3 x a0/e^AR)] + constant/[1 + (57.3 x a0/e^AR] (3.34)
Differentiating with respect to a, it becomes:
dCL/da = a0/[1 + (57.3/e^AR)] = a = lift – curve slope of the wing (3.35)
The wing tip effect delays the stall by a few degrees because the outer-wing flow distortion reduces the local angle of attack; it is shown as A «max. Note that A «max is the shift of CLmax; this value Aamax is determined experimentally. In this book, the empirical relationship of Aamax = 2 deg, for AR > 5 to 12, Aamax = 1 deg, for AR > 12 to 20, and Aamax = 0 deg, for AR > 20.
Evidently, the wing-lift-curve slope, dCL/da = a, is less than the 2D aerofoil- lift-curve slope, a0. Figure 3.27 shows the degradation of the wing-lift-curve slope, dCL/da, from its 2D aerofoil value.
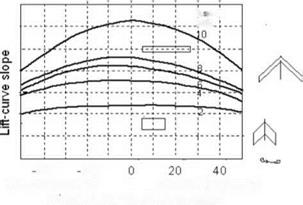 Figure 3.28. Effect of t/c on dCb/da
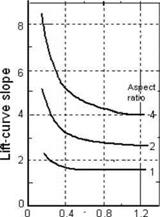 The 2D test data offer the advantage of representing any 3D wing when corrected for its aspect ratio. The effect of the wing sweep and aspect ratio on dCb/da is shown in Figures 3.28 and 3.29 (taken from NASA).
If the flight Re is different from the experimental Re, then the correction for Cbmax must be made using linear interpolation. In general, experimental data provide Cbmax for several Res to facilitate interpolation and extrapolation.
Example: Given the NACA 2412 aerofoil data (see test data in Appendix D), construct wing Cb versus a graph for a rectangular wing planform of aspect ratio 7 having an Oswald’s efficiency factor, e = 0.75, at a flight Re = 1.5 x 10⁶.
From the 2D aerofoil test data at Re = 6 x 10⁶, find dC/da = a0 = 0.095 per degree (evaluate within the linear range: -2 to 8 deg). Cmax is at a = 16 deg.
Use Equation 3.26 to obtain the 3D wing-lift-curve slope:
dCb/da = a = ao/[1 + (57.3/eqAR)] = 0.095/[1 + (57.3/0.75 x 3.14 x 7)]
= 0.095/1.348 = 0.067
From the 2D test data, Cmax for three Res for smooth aerofoils and one for a rough surface, interpolation results in a wing Cmax = 1.25 at flight
Figure 3.29. Effect of sweep on dCb/da

4 0
Wing quarter-chord sweep (deg)
Re = 1.5 x 10⁶. Finally, for AR = 7, the Aomax increment is 1 deg, which means that the wing is stalling at (16 + 1) = 17 deg.
The wing has lost some lift-curve slope (i. e., less lift for the same angle of attack) and stalls at a slightly higher angle of attack compared to the 2D test data. Draw a vertical line from the 2D stall amax + 1 deg (the point where the wing maximum lift is reached). Then, draw a horizontal line with CLmax = 1.25. Finally, translate the 2D stalling characteristic of A a to the 3D wing-lift-curve slope joining the portion to the CLmax point following the test-data pattern.
This demonstrates that the wing CL versus the angle of attack, a, can be constructed (see Figure 3.27).





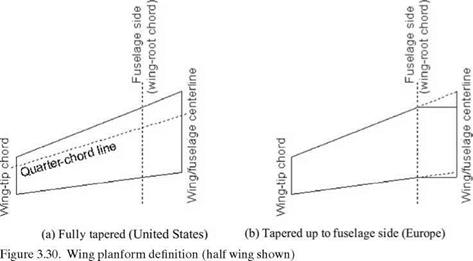
 as a rectangle (Figure 3.30b); that is, the edges are not straight up to centerline unless it is a rectangular wing normal to the centerline. Section 4.8 describes the various options available from which to choose a wing planform.
 how to correct the 2D aerofoil data to obtain the 3D wing lift coefficient, CL, versus the angle of attack, a, relationship. Within the linear variation, dCL/da needs to be evaluated at low angles (e. g., from -2 to 8 deg).
 Figure 3.28. Effect of t/c on dCb/da
 The 2D test data offer the advantage of representing any 3D wing when corrected for its aspect ratio. The effect of the wing sweep and aspect ratio on dCb/da is shown in Figures 3.28 and 3.29 (taken from NASA).
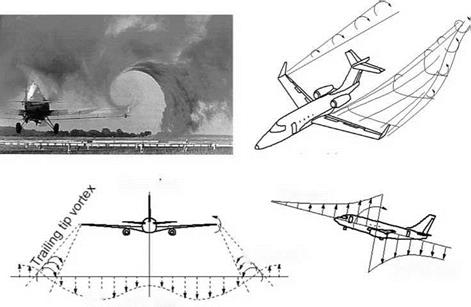 Downwash