Category AIRCRAF DESIGN

Aerofoil

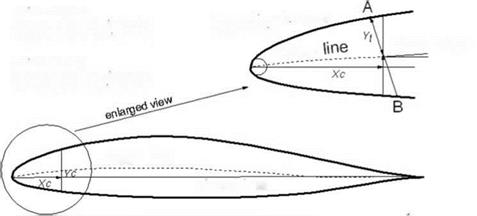
The cross-sectional shape of a wing (i. e., the bread-slice-like sections of a wing com­prising the aerofoil) is the crux of aerodynamic considerations. The wing is a 3D surface (i. e., span, chord, and thickness). An aerofoil represents 2D geometry (i. e., chord and thickness). Aerofoil characteristics are over the unit span at midwing to eliminate effects of the finite 3D wing tip effects. The 3D effects of a wing are dis­cussed in Section 3.11. To standardize aerofoil geometry, Figure 3.10 provides the universally accepted definitions that should be well understood [4].

Chord length is the maximum straight-line distance from the LE to the trailing edge. The mean line represents the midlocus between the upper and lower surfaces; the camber represents the aerofoil expressed as the percent deviation of the mean line from the chord line. The mean line is also known as the camber line. Coordi­nates of the upper and lower surfaces are denoted by Yu and YL for the distance X measured from the LE. The thickness (t) of an aerofoil is the distance between the upper and the lower contour lines at the distance along the chord, measured perpendicular to the mean line and expressed in percentage of the full chord length. Conventionally, it is expressed as the thickness to chord (t/c) ratio in percentage. A small radius at the LE is necessary to smooth out the aerofoil contour. It is conve­nient to present aerofoil data with the chord length nondimensionalized to unity so that the data can be applied to any size aerofoil by multiplying its chord length.

Aerofoil pressure distribution is measured in a wind tunnel to establish its char­acteristics, as shown in [4]. Wind-tunnel tests are conducted at midspan of the wing model so that results are as close as possible to 2D characteristics. These tests are conducted at several Re. Higher Re indicates higher velocity; that is, it has more kinetic energy to overcome the skin friction on the surface, thereby increas­ing the pressure difference between the upper and lower surfaces and, hence, more lift.

In earlier days, drawing the full-scale aerofoils of a large wing and their manu­facture was not easy and great effort was required to maintain accuracy to an accept­able level; their manufacture was not easy. Today, CAD/CAM and microprocessor – based numerically controlled lofters have made things simple and very accurate. In December 1996, NASA published a report outlining the theory behind the U. S. National Advisory Committee for Aeronautics (NACA) (predecessor of the present-day NASA) airfoil sections and computer programs to generate NACA aerofoils.

Forces

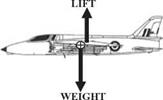
In a steady-state level flight, an aircraft is in equilibrium under the applied forces (i. e., lift, weight, thrust, and drag) as shown in Figure 3.9. Lift is measured perpen­dicular to aircraft velocity (i. e., free streamflow) and drag is opposite to the direction of aircraft velocity (naturally, the wind axes, FW, are suited to analyze these param­eters). In a steady level flight, lift and weight are opposite one another; opposite forces may not be collinear. In steady level flight (equilibrium),

Force = 0;

X lower = Xc * Yt sin (theta)

Forces
Forces
Подпись: Theta = dYc/dXc
Подпись: mean line

Forceschord line

Figure 3.10. Aerofoil section and definitions – NACA family that is, in the vertical direction, lift = weight, and in the horizontal direction, thrust = drag.

The aircraft weight is exactly balanced by the lift produced by the wing (the fuselage and other bodies could share a part of the lift – discussed later). Thrust provided by the engine is required to overcome drag.

Moments arising from various aircraft components are summed to zero to main­tain a straight flight (i. e., in steady level flight, Moment = 0).

Any force/moment imbalance would show up in the aircraft flight profile. This is how an aircraft is maneuvered – through force and/or moment imbalance – even for the simple actions of climb and descent.

Aircraft Motion and Forces

An aircraft is a vehicle in motion; in fact, it must maintain a minimum speed above the stall speed. The resultant pressure field around the aircraft body (i. e., wetted sur­face) is conveniently decomposed into a usable form for designers and analysts. The pressure field alters with changes in speed, altitude, and orientation (i. e., attitude). This book primarily addresses a steady level flight pressure field; the unsteady sit­uation is considered transient in maneuvers. Chapter 5 addresses certain unsteady cases (e. g., gusty winds) and references are made to these design considerations when circumstances demands it. This section provides information on the parame­ters concerning motion (i. e., kinematics) and force (i. e., kinetics) used in this book.

3.6.1 Motion

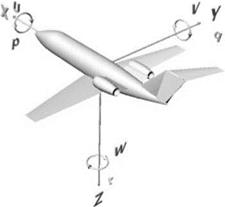
Unlike an automobile, which is constrained by the road surface, an aircraft is the least restricted vehicle, having all six degrees of freedom (Figure 3.8): three linear and three rotational motions along and about the three axes. These can be repre­sented in any coordinate system; however, in this book, the righthanded Cartesian coordinate system is used. Controlling motion in six degrees of freedom is a complex matter. Careful aerodynamic shaping of all components of an aircraft is paramount, but the wing takes top priority. Aircraft attitude is measured using Eulerian angles – f (azimuth), в (elevation), and ф (bank) – and are in demand for aircraft control; however, this is beyond the scope of this book.

In classical flight mechanics, many types of Cartesian coordinate systems are in use. The three most important are as follows:

1. Body-fixed axes, FB, isa system with the origin at the aircraft CG and the X-axis pointing forward (in the plane of symmetry), the Y-axis going over the right wing, and the Z-axis pointing downward.

Figure 3.9. Equilibrium flight (CG at ®). (Folland Gnat: the 1960s, United Kingdom – world’s smallest fighter air­craft. Fuselage length = 9.68 m, span =

Подпись: DRAGПодпись: THRUSTAircraft Motion and Forces7.32 m, height = 2.93 m)

2. Wind-axes system, FW, also has the origin (gimballed) at the CG and the X-axis aligned with the relative direction of airflow to the aircraft and points forward. The Y – and Z-axes follow the righthanded system. Wind axes vary, correspond­ing to the airflow velocity vector relative to the aircraft.

3. Inertial axes, FI, fixed on the Earth. For speed and altitudes below Mach 3 and 100,000 ft, respectively, the Earth can be considered flat and not rotating, with little error, so the origin of the inertial axes is pegged to the ground. Conve­niently, the X-axis points north and the Y-axis east, making the Z-axis point vertically downward in a righthanded system.

In a body-fixed coordinate system, FB, the components are as follows:

Linear velocities: U along X-axis (+ve forward)

V along Y-axis (+ve right)

W about Z-axis (+ve down)

Angular velocities: p about X-axis, known as roll (+ve )

q about Y-axis, known as pitch (+ve nose up) r about Z-axis, known as yaw (+ve )

Angular acceleration: p about X-axis, known as roll rate (+ve)

q about Y-axis, known as pitch rate (+ve nose up) r about Z-axis, known as yaw rate (+ve)

In a wind-axes system, FW, the components are as follows:

Linear velocities: V along X-axis (+ve forward)

Linear accelerations: V along X-axis (+ve forward)

and so on.

If the parameters of one coordinate system are known, then the parameters in another coordinate system can be found through the transformation relationship.

Flow Past Aerofoil

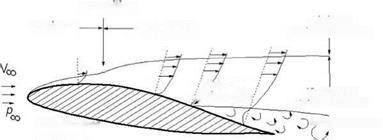
A typical airflow past an aerofoil is shown in Figure 3.6; it is an extension of the dia­gram of flow over a flat plate (see Figure 3.4). In Figure 3.7, the front curvature of the aerofoil causes the flow to accelerate, with the associated drop in pressure, until it reaches the point of inflection on the upper surface of the aerofoil. This is known as a region of favorable pressure gradient because the lower pressure downstream favors airflow. Past the inflection point, airflow starts to decelerate, recovering the pressure (i. e., flow in an adverse pressure gradient) that was lost while accelerat­ing. For inviscid flow, it would reach the trailing edge, regaining the original free streamflow velocity and pressure condition. In reality, the viscous effect depletes flow energy, preventing it from regaining the original level of pressure. Along the aerofoil surface, airflow is depleting its energy due to friction (i. e., the viscous effect) of the aerofoil surface.

The result of a loss of energy while flowing past the aerofoil surface is apparent in adverse pressure gradient – it is like climbing uphill. A point may be reached where there is not enough flow energy left to encounter the adverse nature of the downstream pressure rise – the flow then leaves the surface to adjust to what nature allows. Where the flow leaves the surface is called the point of separation, and it is critical information for aircraft design. When separation happens over a large part of the aerofoil, it is said that the aerofoil has stalled because it has lost the intended pressure field. Generally, it happens on the upper surface; in a stalled condition, there is a loss of low-pressure distribution and, therefore, a loss of lift, as described in Section 3.6. This is an undesirable situation for an aircraft in flight. There is a minimum speed below which stalling will occur in every winged aircraft. The speed at which an aircraft stalls is known as the stalling speed, Vstall. At stall, an aircraft cannot maintain altitude and can even become dangerous to fly; obviously, stalling should be avoided.

For a typical surface finish, the magnitude of skin-friction drag depends on the nature of the airflow. Below Recrit, laminar flow has a lower skin friction coefficient, Cf, and, therefore, a lower friction (i. e., lower drag). The aerofoil LE starts with a low Re and rapidly reaches Recrit to become turbulent. Aerofoil designers must shape the aerofoil LE to maintain laminar flow as much as possible.

Aircraft surface contamination is an inescapable operational problem that degrades surface smoothness, making it more difficult to maintain laminar flow. As a result, Recrit advances closer to the LE. For high-subsonic flight speed (high Re), the laminar flow region is so small that flow is considered fully turbulent.

This section points out that designers should maintain laminar flow as much as possible over the wetted surface, especially at the wing LE. As mentioned previ­ously, gliders – which operate at a lower Re – offer a better possibility to deploy an aerofoil with laminar-flow characteristics. The low annual utilization in private usage favors the use of composite material, which provides the finest surface finish. However, although the commercial transport wing may show the promise of partial

Figure 3.8. Six degrees of freedom in body axes FB

Flow Past Aerofoillaminar flow at the LE, the reality of an operational environment at high utilization does not guarantee adherence to the laminar flow. For safety reasons, it would be appropriate for the governmental certifying agencies to examine conservatively the benefits of partial laminar flow. This book considers the fully turbulent flow to start from the LE of any surface of a high-subsonic aircraft.

Airflow Behavior: Laminar and Turbulent

Understanding the role of the viscosity of air is important to aircraft designers. The simplification of considering air as inviscid may simplify mathematics, but it does not represent the reality of design. Inviscid fluid does not exist, yet it provides much useful information rather quickly. Subsequently, the inviscid results are improvised. To incorporate the real effects of viscosity, designs must be tested to substantiate theoretical results.

The fact that airflow can offer resistance due to viscosity has been understood for a long time. Navier in France and Stokes in England independently arrived at the same mathematical formulation; their equation for momentum conservation embedding the viscous effect is known as the Navier-Stokes equation. It is a non­linear partial differential equation still unsolved analytically except for some simple body shapes. In 1904, Ludwig Prandtl presented a flow model that made the solu­tion of viscous-flow problems easier [2]. He demonstrated by experiment that the viscous effect of flow is realized only within a small thickness layer over the contact surface boundary; the rest of the flow remains unaffected. This small thickness layer is called the boundary layer (Figure 3.3). Today, numerical methods (i. e., CFD) can address viscous problems to a great extent.

Airflow Behavior: Laminar and Turbulent. Boundary layer over a flat plate

Подпись: Figure 3.3

Подпись: Free stream velocity, U.
Airflow Behavior: Laminar and Turbulent
Подпись: Transition
Подпись: Laminar
Подпись: at Re

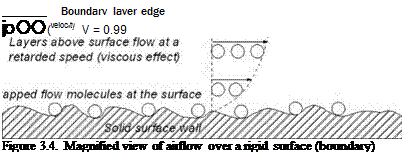
The best way to model a continuum (i. e., densely packed) airflow is to consider the medium to be composed of very fine spheres of molecular scale (i. e., diameter 3 x 10⁻⁸ cm and intermolecular space 3 x 10⁻⁶ cm). Like sand, these spheres flow one over another, offering friction in between while colliding with one another. Air flowing over a rigid surface (i. e., acting as a flow boundary) will adhere to it, losing velocity; that is, there is a depletion of kinetic energy of the air molecules as they are trapped on the surface, regardless of how polished it may be. On a molecular scale, the surface looks like the crevices shown in Figure 3.4, with air molecules trapped within to stagnation. The contact air layer with the surface adheres and it is known as the “no-slip” condition. The next layer above the stagnated no-slip layer slips over it – and, of course, as it moves away from the surface, it will gradually reach the airflow velocity. The pattern within the boundary layer flow depends on how fast it is flowing.

Here is a good place to define the parameter called the Reynolds Number (Re). Re is a useful and powerful parameter – it provides information on the flow status with the interacting body involved:

Re = (pTO U^l )/цто (3.16)

= (density x velocity x length)/coefficient of viscosity = (inertia force)/(viscous force)

where = coefficient of viscosity.

Подпись: Boundary layer edge jо О О (veloc'ty V = 0.99 Figure 3.4. Magnified view of airflow over a rigid surface (boundary)

Free steam velocity,

Figure 3.5. Viscous effect of air on a flat plate
Airflow Behavior: Laminar and TurbulentIt represents the degree of skin friction depending on the property of the fluid. The subscript infinity, to, indicates the condition (i. e., undisturbed infinite distance ahead of the object). Re is a grouped parameter, which reflects the effect of each constituent variable, whether they vary alone or together. Therefore, for a given flow, characteristic length, l, is the only variable in Re. Re increases along the length. In an ideal flow (i. e., inviscid approximation), Re becomes infinity – not much infor­mation is conveyed beyond that. However, in real flow with viscosity, it provides vital information: for example, on the nature of flow (turbulent or laminar), on sep­aration, and on many other characteristics.

Figure 3.3 describes a boundary layer of airflow over a flat surface (i. e., plate) aligned to the flow direction (i. e., X axis). Initially, when the flow encounters the flat plate at the leading edge (LE), it develops a boundary layer that keeps grow­ing thicker until it arrives at a critical length, when flow characteristics then make a transition and the profile thickness suddenly increases. The friction effect starts at the LE and flows downstream in an orderly manner, maintaining the velocity incre­ments of each layer as it moves away from the surface – much like a sliding deck of cards (in lamina). This type of flow is called a laminar flow. Surface skin-friction depletes the flow energy transmitted through the layers until at a certain distance (i. e., critical point) from the LE, flow can no longer hold an orderly pattern in lam­ina, breaking down and creating turbulence. The boundary layer thickness is shown as S at a height where 99% of the free streamflow velocity is attained.

The region where the transition occurs is called the critical point. It occurs at a predictable distance from the LE lcrit, having a critical Re of Recrit at that point. At this distance along the plate, the nature of the flow makes the transition from laminar to turbulent flow, when eddies of the fluid mass randomly cross the layers. Through mixing between the layers, the higher energy of the upper layers ener­gizes the lower layers. The physics of turbulence that can be exploited to improve performance (e. g., dents on a golf ball forces a laminar flow to a turbulent flow) is explained later.

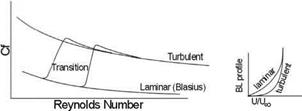
With turbulent mixing, the boundary layer profile changes to a steeper veloc­ity gradient and there is a sudden increase in thickness, as shown in Figure 3.5. For each kind of flow situation, there is a Recrit. As it progresses downstream of lcrit, the turbulent flow in the boundary layer is steadily losing its kinetic energy to overcome resistance offered by the sticky surface. If the plate is long enough, then a point may be reached where further loss of flow energy would fail to negotiate the surface con­straint and would leave the surface as a separated flow (Figure 3.6 shows separation on an aerofoil). Separation also can occur early in the laminar flow.

The extent of velocity gradient, du/dy, at the boundary surface indicates the tangential nature of the frictional force; hence, it is shear force. At the surface where

Airflow Behavior: Laminar and Turbulent

(a) Inviscid flow (p1=p2) (b) Viscous flow (p1 > p2) (c) Dented surface (p1 > p2)

Figure 3.6. Airflow past aerofoil

u = 0, du/dy is the velocity gradient of the flow at that point. If F is the shear force on the surface area, A, is due to friction in fluid, then shear stress is expressed as follows:

F / A = t = ^(du/dy), (3.17)

where л is the coefficient of viscosity = 1.789 x 10⁻⁵kg/ms or Ns/m2 (1g/ms = 1 poise) for air at sea level ISA. Kinematic viscosity, v = ЛP m2/s (1 m2/s = 104 stokes), where p is density of fluid. The measure of the frictional shear stress is expressed as a coefficient of friction, Cf, at the point:

coefficient of friction, Cf = T/qm, (3.18)

where qTO = 1 pV2 = dynamic head at the point.

The difference of du/dy between laminar and turbulent flow is shown in Fig­ure 3.6a; the latter has a steeper gradient – hence, it has a higher Cf as shown in Figure 3.6b. The up arrow indicates increase and vice versa for incompressible flow, temp лі, which reads as viscosity decreases with a rise in temperature, and for compressible flow, tempi лі.

The pressure gradient along the flat plate gives dp/dx = 0. Airflow over the curved surfaces (i. e., 3D surface) accelerates or decelerates depending on which side of the curve the flow is negotiating. It results in a pressure field variation inverse to the velocity variation (dp/dx = 0).

Extensive experimental investigations on the local skin friction coefficient, Cf, on a 2D flat plate are available for a wide range of Res (the typical trend is shown in Figure 3.5). The overall coefficient of skin friction over a 3D surface is expressed as CF and is higher than the 2D flat plate. Cf increases from laminar to turbulent flow, as can be seen from the increased boundary layer thickness. In general, CF is computed semi-empirically from the flat plate Cf (see Chapter 9).

To explain the physics of drag, the classical example of flow past a sphere is shown in Figure 3.6. A sphere in inviscid flow will have no drag (Figure 3.6a) because it has no skin friction and there is no pressure difference between the front and aft ends, there is nothing to prevent the flow from negotiating the surface curvature. Diametrically opposite to the front stagnation point is a rear stagnation point, equat­ing forces on the opposite sides. This ideal situation does not exist in nature but can provide important information.
Airflow Behavior: Laminar and Turbulent Airflow Behavior: Laminar and Turbulent Airflow Behavior: Laminar and Turbulent

Airflow Behavior: Laminar and TurbulentTransition

Figure 3.7. Flow past a sphere

In the case of a real fluid with viscosity, the physics changes nature of offer­ing drag as a combination of skin friction and the pressure difference between fore and aft of the sphere. At low Re, the low-energy laminar flow near the surface of the smooth sphere (Figure 3.6b) separates early, creating a large wake in which the static pressure cannot recover to its initial value at the front of the sphere. The pressure at the front is now higher at the stagnation area, resulting in a pressure difference that appears as pressure drag. It would be beneficial if the flow was made turbu­lent by denting the sphere surface (Figure 3.6c). In this case, high-energy flow from the upper layers mixes randomly with flow near the surface, reenergizing it. This enables the flow to overcome the spheres curvature and adhere to a greater extent, thereby reducing the wake. Therefore, a reduction of pressure drag compensates for the increase in skin-friction drag (i. e., Cf increases from laminar to turbulent flow). This concept is applied to golf-ball design (i. e., low Re velocity and small physical dimension). The dented golf ball would go farther than an equivalent smooth golf ball due to reduced drag. Therefore:

drag = skin friction drag + pressure drag (3.19)

The situation changes drastically for a body at high Re (i. e., high velocity and/or large physical dimension; e. g., an aircraft wing or even a golf ball hit at a very high speed that would require more than any human effort) when flow is turbulent almost from the LE. A streamlined aerofoil shape does not have the highly steep surface curvature of a golf ball; therefore, separation occurs very late, resulting in a thin wake. Therefore, pressure drag is low. The dominant contribution to drag comes from skin friction, which can be reduced if the flow retains laminarization over more surface area (although it is not applicable to a golf ball). Laminar aerofoils have been developed to retain laminar-flow characteristics over a relatively large part of the aerofoil. These aerofoils are more suitable for low-speed operation (i. e., Re higher than the golf-ball application) such as gliders and have the added benefit of a very smooth surface made of composite materials.

Clearly, the drag of a body depends on its profile – that is, how much wake it cre­ates. The blunter the body, the greater the wake size will be; it is for this reason that aircraft components are streamlined. This type of drag is purely viscous-dependent and is termed profile drag. In general, in aircraft applications, it is also called parasite drag, as explained in Chapter 9.

Scientists have been able to model the random pattern of turbulent flow using statistical methods. However, at the edges of the boundary layer, the physics is
unpredictable. This makes accurate statistical modeling difficult, with eddy patterns at the edge extremely unsteady and the flow pattern varying significantly. It is clear why the subject needs extensive treatment (see [2]).

Fundamental Equations

Some elementary yet important equations are listed herein. Readers must be able to derive them and appreciate the physics of each term for intelligent application

See Symbols and Abbreviations, this volume, pp. xix-xxvii.

to aircraft design. The equations are not derived herein – readers may refer to any introductory aerodynamic textbook for their derivation.

In a flowing fluid, an identifiable physical boundary defined as control volume (CV) (see Figure 10.11) can be chosen to describe mathematically the flow charac­teristics. A CV can be of any shape but the suitable CVs confine several streamlines like well-arranged “spaghetti in a box” in which the ends continue along the stream­line, crossing both cover ends but not the four sides. The conservative laws within the CV for steady flow (independent of time, t) that are valid for both inviscid incom­pressible and compressible flow are provided herein. These can be equated between two stations (e. g., Stations 1 and 2) of a streamline. Inviscid (i. e., ideal) flow under­going a process without any heat transfer is called the isentropic process. During the conceptual study phase, all external flow processes related to aircraft aerodynamics are considered isentropic, making the mathematics simpler. (Combustion in engines is an internal process.)

Newton’s law: applied force, F = mass x acceleration = rate of change of momentum

From kinetics, force = pressure x area

and work = force x distance

Therefore, energy (i. e., rate of work) for the unit mass flow rate m is as follows:

energy = force x (distance/time) = pressure x area x velocity = pAV

mass conservation: mass flow rate m = pAV = constant (3.3)

Momentum conservation: dp = – pVdV (known as Euler’s equation) (3.4)

With viscous terms, it becomes the Navier-Stokes equation. However, friction forces offered by the aircraft body can be accounted for in the inviscid-flow equation as a separate term:

Подпись:1 2

energy conservation: Cp T + 2 V = constant

Fundamental Equations Подпись: (3.6) (3.7) (3.8) (3.9)

When velocity is stagnated to zero (e. g., in the hole of a Pitot tube), then the follow­ing equations can be derived for the isentropic process. The subscript t represents the stagnation property, which is also known as the “total” condition. The equations represent point properties – that is, valid at any point of a streamline (y stands for the ratio of specific heats and M for the Mach number):

The conservation equations yield many other significant equations. In any stream­line of a flow process, the conservation laws exchange pressure energy with the
kinetic energy. In other words, if the velocity at a point is increased, then the pres­sure at that point falls and vice versa (i. e., Bernoulli’s and Euler’s equations). Fol­lowing are a few more important equations. At stagnation, the total pressure, pt, is given.

Bernoulli’s equation: For incompressible isentropic flow,

р/р + V2 /2 = constant = pt (3.10)

Clearly, at any point, if the velocity is increased, then the pressure will fall to maintain conservation. This is the crux of lift generation: The upper surface has lower pressure than the lower surface.

Подпись: (Pt - P) P Подпись: + 1 Подпись: Y-1 Y Подпись: (Y - 1)V2 la2 Подпись: (3.11)

Euler’s equation: For compressible isentropic flow,

There are other important relations using thermodynamic properties, as follows.

From the gas laws (combining Charles’s law and Boyle’s law), the equation for the state of gas for the unit mass is pv = RT, where for air:

R = 287 J/kgK

(3.12)

Cp – Cv = Randy = Cp/Cv

(3.13)

From the energy equation, total temperature:

T T, T(Y – 1)V2 T| V2 t 2 RTy 2CP

(3.14)

Mach number = V/a, where a = speed of sound and

a = Y RT = (dp/dp)isentropic

(3.15)

Introduction

Aircraft conceptual design starts with shaping an aircraft, finalizing geometric details through aerodynamic considerations in a multidisciplinary manner (see Sec­tion 2.3) to arrive at the technology level to be adopted. In the early days, aerody­namic considerations dictated aircraft design; gradually, other branches of science and engineering gained equal importance.

All fluids have some form of viscosity (see Section 3.5). Air has a relatively low viscosity, but it is sufficiently high to account for its effects. Mathematical model­ing of viscosity is considerably more difficult than if the flow is idealized to have no viscosity (i. e., inviscid); then, simplification can obtain rapid results for important information. For scientific and technological convenience, all matter can be classi­fied as shown in Chart 3.1.

This book is concerned with air (gas) flow. Air is compressible and its effect is realized when it is flowing. Aircraft design requires an understanding of both incompressible and compressible fluids. Nature is conservative (other than nuclear physics) in which mass, momentum, and energy are conserved.

Aerodynamic forces of lift and drag (see Section 3.9) are the resultant compo­nents of the pressure field around an aircraft. Aircraft designers seek to obtain the maximum possible lift-to-drag ratio (i. e., a measure of minimum fuel burn) for an efficient design (this simple statement is complex enough to configure, as will be

observed throughout the coursework). Aircraft stability and control are the result of harnessing these aerodynamic forces. Aircraft control is applied through the use of aerodynamic forces modulated by the control surfaces (e. g., elevator, rudder, and aileron). In fact, the sizing of all aerodynamic surfaces should lead to meeting the requirements for the full flight envelope without sacrificing safety.

To continue with sustained flight, an aircraft requires a lifting surface in the form of a plane – hence, aeroplane (the term aircraft is used synonymously in this book). The secret of lift generation is in the sectional characteristics (i. e., aerofoil) of the lifting surface that serve as wings, similar to birds. This chapter explains how the differential pressure between the upper and lower surfaces of the wing is the lift that sustains the aircraft weight. Details of aerofoil characteristics and the role of empennage that comprises the lifting surfaces are explained as well. The stability and control of an aircraft are aerodynamic-dependent and discussed in Chapter 12.

Minimizing the drag of an aircraft is one of the main obligations of aerodynami – cists. Viscosity contributes to approximately two-thirds of the total subsonic aircraft drag. The effect of viscosity is apparent in the wake of an aircraft as disturbed airflow behind the body. Its thickness and intensity are indications of the extent of drag and can be measured. One way to reduce aircraft drag is to shape the body such that it will result in a thinner wake. The general approach is to make the body in a teardrop shape with the aft end closing gradually, as compared to the blunter front-end shape for subsonic flow. (Behavior in a supersonic flow is different but it is still prefer­able for the aft end to close gradually.) The smooth contouring of teardrop shap­ing is called streamlining, which follows the natural airflow lines around the aircraft body – it is for this reason that aircraft have attractive smooth contour lines. Stream­lining is synonymous with speed and its aerodynamic influence in shaping is revealed in any object in a relative moving airflow (e. g., boats and automobiles).

New aircraft designers need to know about the interacting media – that is, the air (i. e., atmosphere). The following sections address atmosphere and the behavior of air interacting with a moving body.

IntroductionViscosity (m/s)

1.0

Introduction Introduction

Density – kg/m

Подпись: Temperature (K)

I 300

Speed of sound (m/s)

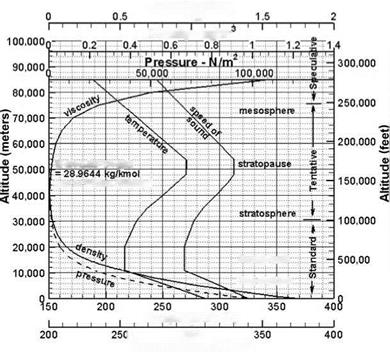
Figure 3.1. Atmosphere (see Appendix B for accurate values)

3.2 Atmosphere

Knowledge of the atmosphere is an integral part of design – the design of an aircraft is a result of interaction with the surrounding air. The atmosphere, in the classical definition up to 40-kilometer (km) altitude, is dense (continuum): Its homogeneous constituent gases are nitrogen (78%), oxygen (21%), and others (1%). After sub­stantial data generation, a consensus was reached to obtain the ISA [1], which is in static condition and follows hydrostatic relations. Appendix B includes an ISA table with up to 20-km altitudes, which is sufficient for this book because all air­craft (except rocket-powered special-purpose aircraft – e. g., space plane) described would be flying below 20 km. Linear interpolation of properties may be carried out between low altitudes. At sea level, the standard condition gives the following prop­erties:

pressure = 101,325 N/m2 (14.7 lb/in2) temperature = 288.16°K (518.69°R) viscosity = 1.789 x 10⁻⁵ m/s (5.872 x 10⁻⁵ ft/s) acceleration due to gravity = 9.81 m/s2 (32.2 ft/s2)

In reality, an ISA day is difficult to find; nevertheless, it is used to standardize air­craft performance to a reference condition for assessment and comparison. With altitude gain, the pressure decreases, which can be expressed through the use of hydrostatic equations. However, temperature behaves strangely: It decreases lin­early up to 11 km at a lapse rate of 6.5°K/km, then holds constant at 216.66°K until it reaches 20 km, at which it starts increasing linearly at a rate of 4.7°K/km up to
47 km. The 11-km altitude is called the tropopause; below the tropopause is the troposphere and above it is the stratosphere, extending up to 47 km. Figure 3.1 shows the typical variation of atmospheric properties with altitude. The ISA is up to 100,000-ft altitude. From 100,000- to 250,000-ft altitude, the atmospheric data are currently considered tentative. Above a 250,000-ft altitude, variations in atmo­spheric data are speculative.

Typical atmospheric stratification (based primarily on temperature variation) is as follows (the applications in this book do not exceed 100,000 ft [«30.5 km]):

Подпись: Troposphere: Tropopause: Stratosphere: Stratopause: Mesosphere: Mesopause: Thermosphere: Ionosphere: Exosphere: up to 11 km (36,089 ft)

11 km (36,089 ft)

from 20 to 47 km (65,600 to 154,300 ft)

47 km (154,300 ft) from 54 to 90 km 90 km

from 100 to 550 km (can extend and overlap with

ionosphere)

from 550 to 10,000 km

above 10,000 km

In the absence of the ISA table, the following hydrostatics equations give the related properties for the given altitude, h, in meters. Pressure decreases with alti­tude increase, obeying hydrostatic law; however, atmospheric temperature variation with altitude is influenced by natural phenomenon.

Temperature, T, in °K = 288.15 – (0.0065 x h) up to 11,000 m altitude (in the troposphere) and thereafter constant at 216.66°K until it reaches 25,000 m.

Above 25,000 m, use T in °K = 216.66 + (0.0047 x h) up to 47,000 m altitude (in the stratosphere).

101.325 Подпись:Подпись:Подпись:x (T/288.16)(g/0’°065R)

101.325 x e(gh/RT)

1.225 x (T/288.16)(g/00065R)-1

1.225 x e-(gh/RT)

Kinematic viscosity

v inm2/s = 1.46 x 10 5 x e(gh/RT)

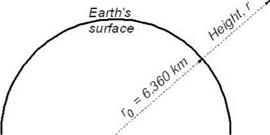
Acceleration due to gravity is inversely proportional to the square of the radius (average radius r0 = 6,360 km) from the center of the Earth. If r is the altitude of an aircraft from the Earth’s surface, then it is at a distance (r0 + r) from the center of the Earth. Figure 3.2 shows schematically the aircraft distance from the center of the Earth.

Подпись: g = g0 Introduction Подпись: 2 Подпись: (3.2)

Then, acceleration due to gravity, g, at height r is expressed as:

where g0 is the acceleration due to gravity at sea level (i. e., surface).

For terrestrial flights, r is much less than r0; there is less than a 1% change in g up to 30 km; hence, g is kept invariant at the sea level value of 9.81 m/s2 for aircraft

Figure 3.2. Aircraft distance from the center of the Earth

Introductionapplications. The small error arising from keeping g constant results in geopoten­tial altitude that is slightly lower than the geometric altitude. This book uses the geometric altitude from the ISA table.

As mentioned previously, an aircraft rarely encounters the ISA. Wind circu­lation over the globe is always occurring. Surface wind current such as doldrums (i. e., slow winds in equatorial regions), trade winds (i. e., predictable wind currents blowing from subtropical to tropical zones), westerlies (i. e., winds blowing in the temperate zone), and polar easterlies (i. e., year-round cold winds blowing in the polar regions) are well known. In addition, there are characteristic winds in typical zones – for example, monsoon storms; wind-tunneling effects of strong winds blow­ing in valleys and ravines in mountainous and hilly regions; steady up and down drafts at hill slopes; and daily coastal breezes. At higher altitudes, these winds have an effect. Storms, twisters, and cyclones are hazardous winds that must be avoided. There are more complex wind phenomena such as wind-shear, high-altitude jet streams, and vertical gusts. Some of the disturbances are not easily detectable, such as clear air turbulence (CAT). Humidity in the atmosphere is also a factor to be con­sidered. The air-route safety standards have been improved systematically through round-the-clock surveillance and reporting. In addition, modern aircraft are fitted with weather radars to avoid flight paths through disturbed areas. Flight has never been safer apart from manmade hazards. This book addresses only an ISA day, with the exception of gust load, which is addressed in Chapter 5 for structural integrity affecting aircraft weights.

Aircraft design must also consider specific nonstandard conditions. On a hot day, the density of air decreases and aircraft performance degradation will take place as a result of lowered engine power. Certification authorities (i. e., FAA and CAA) require that aircraft demonstrate the ability to perform as predicted in hot and cold weather and in gusty wind. The certification process also includes checks on the ability of the environmental control system (ECS) (e. g., anti-icing/de-icing, and air-conditioning) to cope with extreme temperatures. In this book, performance degradation on a non-ISA day is not addressed. The procedure to address nonstan­dard atmospheres is identical with the computation using the ISA conditions, except that the atmospheric data are different.

Aerodynamic Considerations

3.1 Подпись: 3Overview

This chapter is concerned with the aerodynamic information required at the concep­tual design stage of a new aircraft design project. It provides details that influence shaping and other design considerations and defines the various parameters integral to configuring aircraft mould lines. Any object moving through air interacts with the medium at each point of the wetted (i. e., exposed) surface, creating a pressure field around the aircraft body. An important part of aircraft design is to exploit this pressure field by shaping its geometry to arrive at the desired performance of the vehicle, including shaping to generate lifting surfaces, to accommodate payload, to house a suitable engine in the nacelle, and to tailor control surfaces. Making an air­craft streamlined also makes it looks elegant.

Aeronautical engineering schools offer a series of aerodynamic courses, starting with the fundamentals and progressing toward the cutting edge. It is assumed that readers of this book have been exposed to aerodynamic fundamentals; if so, then readers may browse through this chapter for review and then move on to the next chapter. Presented herein is a brief compilation of applied aerodynamics without detailed theory beyond what is necessary. Many excellent textbooks are available in the public domain for reference. Because the subject is so mature, some nearly half­century-old introductory aerodynamics books still serve the purpose of this course; however, more recent books relate better to current examples.

3.1.1 What Is to Be Learned?

This chapter covers the following topics:

Подпись:Introduction to aerodynamics Atmosphere through which aircraft flies Useful equations

Airflow behavior past a body; viscosity and boundary layer con­cepts introduced to explain drag Aircraft motion and the forces acting on it Aerofoil definition and classification

Definition of relevant aerodynamic coefficients (e. g., CL, CD)

Lift generation, aerodynamic center, and center of pressure Types of stall

Подпись:Comparison of aerofoils and selection of appropriate choice Introduction to high-lift devices Transonic effects (area rule)

Wing aerodynamics (3D geometry)

Aspect ratio correction (2D to 3D)

Wing planform reference area definition, dihedral angle Mean aerodynamic chord Compressibility effect Wing stall and twist

Influence of wing area and span on aerodynamics Finalizing wing design parameters Empennage, tail volume definition, canard Fuselage

Undercarriage (see Chapter 7)

Nacelle and intake Speed and dive brakes

3.1.2 Coursework Content

The information in this chapter is essential for designers. Coursework is postponed until Chapter 6 (except for the mock market survey in Chapter 2). Readers should return to Chapters 2 through 5 to extract information necessary to configure the aircraft in Chapter 6.

Coursework Procedures

The coursework task is to conduct a mock market study. The instructor divides the class into groups of four or five students who will work as a team (see the Road Map of the Book, which gives the typical allotted time). However, how the class is conducted is at the instructor’s discretion.

Step 1: The instructor decides which class of aircraft will be used for the design project. Students will have input but the instructor ultimately explains why a certain aircraft is chosen. Designing a conventional civil or a military trainer aircraft is appropriate for undergraduate introductory work. In this book, a Bizjet and an AJT aircraft design are used.

Step 2: The instructor discusses each suggestion, discarding the impractical and coalescing the feasible. The instructor will add anything that is missing, with explanations.

Step 3: Each team must submit a scaled, three-view sketch of the proposed design. There will be differences in the various configurations. CAD is recommended.

Step 4: The instructor discusses each configuration, tailoring the shape, with explanation, to a workable shape. Each team works on its revised con­figuration; preferably, the class will work with just one design.

Coursework Procedures

Airworthiness Requirements

From the days of barnstorming and stunt-flying in the 1910s, it became obvi­ous that commercial interests had the potential to short-circuit safety considera­tions. Government agencies quickly stepped in to safeguard people’s security and safety without deliberately harming commercial interests. Safety standards were developed through multilateral discussions, which continue even today. Western countries developed and published thorough and systematic rules – these are in the public domain (see relevant Web sites). In civil applications, they are FAR for the United States [8] and CS (EASA) for Europe. They are quite similar and may even­tually merge into one agency. The author’s preference is to work with the estab­lished FAR; pertinent FARs are cited when used in the text and examples. FAR documentation for certification has branched out into many specialist categories, as shown in Table 2.3.

Table 2.4 provides definitions for general, normal, and transport categories of aviation.

Table 2.4. Aircraft categories

Aircraft types

General

Normal

Transport

MTOW (lbs)

Less than 12,500

Less than 12,500

More than 12,500

No. of engines

0 or more

More than 1

More than 1

Type of engine

All types

Propeller only

All types

Flight crew

1

2

2

Cabin crew

None

None up to 19 PAX

None up to 19 PAX

Maximum no. of occupants

10

23

Unrestricted

Maximum operating altitude

25,000 ft

25,000 ft

Unrestricted

Note:

MTOW = maximum takeoff weight PAX = passengers

In military applications, the standards are Milspecs (U. S.) and Defense Stan­dard 970 (previously AvP 970) (U. K.); they are different in some places.

Since 2004, in the United States, new sets of airworthiness requirements came into force for light-aircraft (LA) designs and have eased certification procedures and litigation laws, rejuvenating the industry in the sector. Europe also has a similar approach but its regulations differ to an extent. Small/light aircraft and microlight types have different certification standards not discussed in this book.