Our heavyweight helicopter equal in the world does not have
In Rostov started production of the most load-lifting rotary-wing car The Russian holding «Helicopt[...]

Everything about aircrafts and helicopters. News and events in aviation worldwide. Civil, transportation, military helicopters and airplanes.

Everything about aircrafts and helicopters. News and events in aviation worldwide. Civil, transportation, military helicopters and airplanes.

Everything about aircrafts and helicopters. News and events in aviation worldwide. Civil, transportation, military helicopters and airplanes.

Everything about aircrafts and helicopters. News and events in aviation worldwide. Civil, transportation, military helicopters and airplanes.


When analyzing a natural flyer’s aerodynamic performance, an important parameter is the ratio between the forward velocity and the flapping velocity, which is expressed in terms of the reduced frequency k,
where f, c, and Uref are, respectively, the flapping frequency, the mean chord length, and the reference velocity – in this case the flyer’s forward flight velocity. Unsteady effects increase as flapping frequency decreases, and therefore, depending on the forward velocity, different techniques have been devised to calculate the forces acting on a specific species.
In slow forward flight, both reduced frequency and wing-beat amplitude tend to be high, resulting in highly unsteady flow structures. In accordance with the Lifting Line Theory [64], the lift on a wing is related to the strength of the bound vortex. The trailing vortices (the tip vortices) are of the same circulation magnitude as the bound vortex. At the beginning or end of the downstroke, when the flapping velocity changes direction, a transverse vortex (starting or stopping vortex) is produced at the trailing edge, and according to Kelvin’s circulation theorem, these two transverse vortices connect the two tip vortices and result in the shedding of a vortex ring. Some flyers (for example, doves) make use of the clap-and-fling mechanism to generate the starting vortex and by this means reduce the delay in building up maximum lift during the first part of the downstroke. This mechanism is highlighted in Chapter 3.
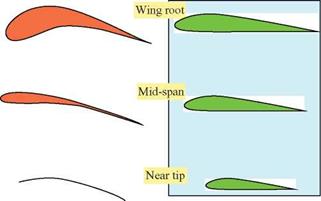
In fast forward flight, the reduced frequency and the wing-beat amplitude tend to be low, and the wake consists of a pair of continuous undulating vortex tubes – or line vortices – approximately behind the wingtips. In such cases, it is not unusual for the outer part of the wing to be folded so that it aligns with the free-stream direction
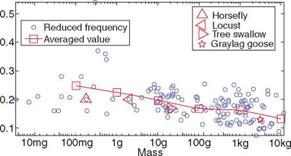
Figure 1.24. Mass versus reduced frequency for birds and insects.
![]()
 (to reduce drag); when this occurs only the arm wing contributes to aerodynamic lift during the upstroke.
To evaluate flying animals’ lift and thrust, either unsteady or quasi-steady methods can be used depending on the magnitude of the reduced frequency. Early work by Ellington [65] showed that quasi-steady analysis substantially under-predicts the aerodynamic force needed to sustain the insect weight. As discussed in Chapters 3 and 4, much recent flapping wing research has focused on the understanding of unsteady aerodynamic mechanisms resulting from the wing movement. Figure 1.24 shows the correlation between a flyer’s mass and the reduced frequency. The data are based on those reported by Azuma [24] and Pennycuick [59], aided by the cruising – velocity estimate documented by Tennekes [29]. Overall, the reduced frequency decreases as the size and mass grow, indicating that small flyers are more unsteady in their flight than large flyers. Although this figure does not explain how they use this unsteadiness, it does indicate that unsteadiness plays a critical role in small flyers’ movement.
To quantify the lift and thrust generated by the flapping motion requires more sophisticated tools. However, we can understand the role of the unsteady effects by examining the relationship between the forward velocity and the flapping velocity in terms of the reduced frequency. It is also noted that different sections of the wing function differently in force generation. This concept can be better understood by introducing the relative flow velocity (Ur), defined as
Ur = U + Uf + w, (1-20)
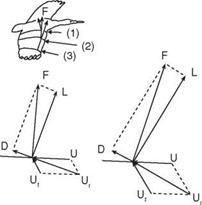
where U is the forward velocity of the bird, Uf the flapping velocity, and wi the downwash (induced) velocity. The relative velocity determines the aerodynamic forces on the wing. For fast forward flight, the downwash velocity is small and can be largely neglected. As the wingspan increases, Uf increases and changes direction; consequently, the magnitude and direction on Ur change as well. Since Ur determines the resulting aerodynamic force F acting on each wing section along the span, F also changes in magnitude and direction. The changes can be seen in Figure 1.25.
It is commonly held that during the downstroke the inner part of the wing produces lift and drag, while the outer part produces lift and thrust. The net aerodynamic force produced by the wings during the downstroke is directed upward and forward, providing both lift and thrust. To obtain this favorable force distribution, the wings have to be twisted. By twisting the wings an optimal relative velocity can be
Figure 1.25. Velocity-vector diagram at different wingspan locations for fast forward flight. Here, the lift and drag are defined based on the effective velocity combining forward and local flapping velocities. For the entire vehicle, the lift is defined to be normal to the forward velocity (U) (i. e., in the vertical direction), and drag or thrust in the horizontal direction. According to the resulting force vector F illustrated here, drag of the vehicle is generated by the inner wing, and thrust of the vehicle is generated by the outer wing.
![]()
![]()
![]()

![]()
![]() obtained at each wing section throughout the wing stroke. Since the relative velocity determines the direction of the resultant aerodynamic force, this force is directed backward at the wing root and gradually turned forward when moving along the wingspan. At the wingtip region, the resultant aerodynamic force points toward the forward direction, giving both lift and thrust.
obtained at each wing section throughout the wing stroke. Since the relative velocity determines the direction of the resultant aerodynamic force, this force is directed backward at the wing root and gradually turned forward when moving along the wingspan. At the wingtip region, the resultant aerodynamic force points toward the forward direction, giving both lift and thrust.
Flying animals employ different mechanisms for various missions such as takeoff, landing, or gliding. Even during forward flight, they change their wing and body movements while flying through a range of speeds. Tobalske and Dial [8] analyzed high-speed (60 Hz) videotapes of black-billed magpies (Pica pica) flying at speeds of 4-14 m/s and of pigeons (Columbia livia) flying at 6-20 m/s in a wind tunnel. Pigeons have higher wing loading and higher aspect ratio wings compared with magpies. Both species alternate phases of steady-speed flight with phases of acceleration and deceleration, particularly at intermediate flight speeds. The birds modulate their wing-beat kinematics among these phases and frequently exhibit non-flapping phases while decelerating. During steady-speed flight, wing-beat frequency does not change appreciably with horizontal flight speed. Instead, with increasing flight speed the body angle relative to the horizontal decreases, thereby illustrating that the dominant function of wing flapping changes from weight support at slow speeds to positive thrust at fast speeds. Pigeons progressively flex their wings during glides as flight speed increases but never perform bounding. For magpies, the wingspan during glides does not vary with flight speed, but the percentage of bounding among non-flapping intervals increases with speed from 10-14 m/s. The use of non-flapping wing postures seems to be related to the gaits used during flapping and to the aspect ratio of the wings.
In general, the outer wing is mainly responsible for generating weight support and thrust, largely on the downstroke (see Fig. 1.26). For most birds, force generation is usually minimized on the upstroke to prevent excessive negative thrust. Furthermore, the shallow undulation of the inner wing areas cannot significantly contribute to thrust production (see Fig. 1.27a). However, the forces exerted on the inner wings can be used for weight support throughout the cycle without much penalty (see Fig. 1.27).
 |
Figure 1.26. Condor in fast flapping flight [66]. (a) Schematic of resultant forces acting on an outer or an inner wing during up – and downstrokes. (b) Asymmetric strokes of a pigeon in slow flight [67].
An alternative method to gliding and soaring that is used by many biological flyers to produce lift and thrust is flapping wing flight. The similarities between the aerodynamics of a flapping wing and that of a rotary wing, although limited, illustrate a few key ideas. For example, the rotors of a helicopter rotate about the central shaft continuously, while the relative flow around the rotors produces lift. Likewise, a flapping wing rotates, swings in an arc around its shoulder joint, and reverses direction every half-stroke. Helicopters and biological flyers also use similar techniques to accelerate from hovering to forward flight. Helicopters tilt the rotational plane of rotors from horizontal to forward. The steeper the tilt of the rotor, the faster the helicopter accelerates. Biological flyers also tilt their flapping stroke plane: down and forward on the downstroke, and up and backward on the upstroke. To fly faster, biological flyers make the stroke more vertical by increasing the up-and-down amplitude of the movements. When biological flyers decrease their speed, they tend to flap their wings more horizontally, similar to the way helicopters change the angle of the rotors.
Birds, bats, and insects apply a variety of different flapping patterns in hovering and in forward flight to generate lift and thrust. Larger birds have relatively simple wingtip paths. For example, an oval tip path is often associated with albatrosses (see Fig. 1.23). Smaller flyers exhibit more complicated flapping patterns. Figure 1.23 illustrates the highly curved tip paths of a locust and a fruit fly, the figure-eight
![Подпись: Figure 1.23. Wingtip paths relative to the body for a variety of flyers, as indicated by arrows. (a) albatross, fast gait; (b) pigeon, slow gait; (c) horseshoe bat, fast flight; (d) horseshoe bat, slow gait; (e) blow fly; (f) locust; (g) June Beetle; (h) fruit fly. From Alexander [22].](/img/3131/image043_4.gif) |
pattern of a pigeon (see Fig. 1.23b), and the more complicated paths of June Beetles and blowflies.
1.3.1 Gliding and Soaring
Flying animals usually flap their wings to generate both lift and thrust. But if they stop flapping and keep their wings stretched out, their wings will actively produce lift, not thrust. When this happens, we call them gliders. Thrust can then be produced by gravitational force while an animal descends. In addition to bats and larger birds, gliders can also be found among fish, amphibians, reptiles, and mammals.
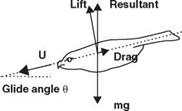
To maintain level flight, a flying animal must produce both lift and thrust to balance the gravity force, in the vertical direction, and the drag, in the horizontal direction, respectively. Because gliding occurs with no active thrust production, an animal always resorts to the gravity force to overcome the drag. In gliding, the animal tilts its direction of motion slightly downward relative to the air that it moves through. When the animal tilts downward, the resulting angle between the motion direction and the air becomes the gliding angle. The gliding angle directly controls the lift-to – drag ratio. The higher this ratio, the shallower the glide becomes. Recall from a basic fluid dynamics class that the lift-to-drag ratio increases with the Reynolds number, a parameter proportional to animal size and flight speed. Large flying animals fly at high Reynolds numbers and have a large lift-to-drag ratio. For example, a Wandering
Figure 1.21. Force balance of gliding [63].
 Albatross, with a wing span more than 3 m, has a reported lift-to-drag ratio of 19, whereas the fruit fly, which has a span of 6 mm, has a ratio of 1.8 [22]. If the animal has a low lift-to-drag ratio, it must glide (if it can) with a considerable increase in glide angle. For example, a lizard (the genus Draco) from Southeast Asia has a lift – to-drag ratio of 1.7 and glides at an angle of 30°, whereas a North American flying squirrel glides at the angle of about 18° to 26° with a lift-to-drag ratio of 2 or 3 [22].
Whereas gliding animals take a downward tilt to acquire gravity-powered flight, many birds can ascend without flapping their wings. This is called soaring. Instead of using gravity, soaring uses energy in the atmosphere, such as rising air currents [22].
Consider a gliding flyer at an angle в relative to the free-stream (see Fig. 1.21). The lift and drag are perpendicular and parallel to the flyer’s inclination axis, while the gravitational force is invariant for our purpose. It is known that good bird flyers often attain a maximum glide ratio of 10 to 15 (в about 5°), whereas Wandering Albatrosses record 23 (в = 2.5°). Using the planform area S and the lift coefficient CL,
1
L = 2 pSU2Cl = mg cos в « mg (as в is small) (1-17)
By measuring m, S, and U, the lift coefficient is found to be typically < 1. Maximum CL (about 1.5) occurs at minimum glide speed, when the bird starts to flap its wings just before they stall. One can also estimate the glide speeds as a function of flyer sizes:
Table 1.5 summarizes gliding characteristics of selected natural flyers, showing that the glide speed is indeed well correlated with the square root of the wing loading,
|
Table 1.5. Glide characteristics of selected flyers, showing that the glide speed is generally proportional to (wing loading)1/2 Wing loading (N/m2) Glide speed (m/s)
|
 |
 |
51 km/hr
Figure 1.22. Variable span gliders: wing morphing to accommodate gliding speed [29].
W/S. Furthermore, statistically, as shown in Table 1.5, for most birds, except hummingbirds, the planform area is S a m0’72 and the wing loading is W/S a m028, which result in the glide speed: U a m014.
Because lift (L) is proportional to flight speed squared, birds control their speed by varying S and hence the wing loading (W/S). This enables the bird to adjust the speed range so that the wings operate at an optimal AoA at all speeds. To complement the trends highlighted in Figure 1.13, Figure 1.22 illustrates such trends for a falcon and a pigeon under varied flight conditions.
The main function of wing bones is to transmit force to the external environment during flight. This force cannot, however, be too high because of the risk for bone or muscle failure. These limitations, along with the amount of power available from flight muscles, settle the upper and lower limits of wing-beat frequency for flapping animals [59]-[61]. Based on the insight into the wing-beat or flapping frequency, it is possible to estimate the power output from a bird’s flight muscles and achieve an estimation of the power required for flying. According to Pennycuick [62], this means we can estimate the maximum wing-beat frequency /w, max for geometrically similar animals, as shown in the following discussion. Because the force Fm exerted by a muscle is assumed to be proportional to the cross-sectional area of its attachment, we get
Fn « S — l2. (1-8)
Pennycuick [62] assumes that the stresses in muscles and bones are constant and that the torque acting about the center of rotation of the proximal end of the limb can be expressed as
![]()
Jt = Fml.
The mass of the limb is denoted by mlimb and it is assumed that the limb has a uniform density. The muscle in action has an angular acceleration, which can be determined as
* = і — l5 – o-n)
From Eq. (1-11) it is easy to determine the stroke time scale T, and with the frequency f — T-1, we get
A relation between the body mass m and the maximum wing-beat frequency fw max can also be derived:
fw, max ^ T-1 ~ I-1 ~ m-1/3. (1-13)
With the assumption of geometric similarity, this is the upper limit of the flapping frequency. For the lower flapping-frequency limit, which is the case for most birds in slow forward flight or hovering, the induced velocity w,, – the airflow speed in the wake right beneath the animal – dominates. Still, the weight W of the flyer must be balanced by the lift L so that, referring to Eq. (1-1), we obtain the following relation for the induced velocity wi:
W = L = 2pwSCl * w = Щ. a-14)
The angular velocity of the wings can be dimensionally expressed as
![]() ы ~ w,/I.
ы ~ w,/I.
With Eqs. (1-3), (1-4), and (1-15), we obtain the final expression for the lower flapping limit as
Because of these two physical limits, animal flight has an upper and lower bound for the flapping frequency.
Norberg [4] reports that there are greater variations between groups of animals in wing area than in wingspan. The departure from the geometrical relation is obvious, which is shown in Table 1.3. As for wingspan, hummingbirds have the largest deviation from the geometrical relation. They seem to have a larger wing area for a given body mass than do birds in general. Based on the variation of the wing area for different groups of birds, Greenewalt [55] subdivides birds into different classes or “models.” His model offers the following correlations:
|
Table 1.4. Weight, wing area, wing loading, and airspeeds for various seabirds assumed to be geometrically similar
Source: Data originally compiled by Tennekes [29]. |
In general, for both human-made and natural flyers, the agility and maneuverability improve with a smaller AR. High AR wing flyers, such as an albatross and the U-2, are excellent flyers for steady-state forward flight, but are not suitable for fast course changes.
Another consideration is that the induced drag, which is caused by the lift, tends to decrease with higher AR. Obviously, the minimum induced drag is obtained with an infinitely long wing. Similarly, for steady forward flight, with a large AR, the lift-to-drag ratio (L/D) or the so-called glide ratio increases with an increasing AR. The largest AR for birds is found among species that typically spend a substantial portion of their time in soaring instead of flapping flight. A typical example is the wandering albatross (Diomeda exulans), which has an aspect ratio of about 15. As noted by Tennekes [29], the glide ratio for the wandering albatross is around 20. Human engineering can now offer a sailplane with a glide ratio of around 60.
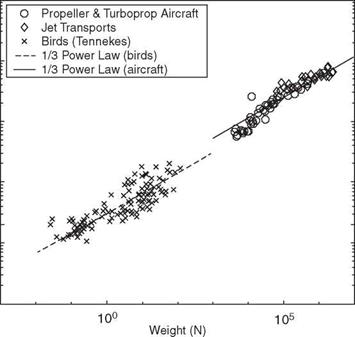
The concept of geometric similarity can help relate different physical quantities by means of the dimensional argument. Under the assumption of geometric similarity, Figure 1.20 correlates wing loading with the weight of a vehicle. For example, the wing loading is proportional to the one-third power of the weight as shown later, if the aerodynamic parameters remain unchanged (which is not true, as is discussed in detail). If flyers are assumed to be geometrically similar, the weight W, lift L, and mass m for unaccelerated level flight, can be expressed with respect to a characteristic length l (e. g., chord length (c), mean chord length (cm), or wing length (R)) as
W = L = mg. (1-3)
The wing area and flyer’s weight are expressed as
S – l2, W – l3. (1-4)
Then the wing loading can also be expressed as
W = kxW1/3, (1-5)
where k1 is a constant to be determined empirically. Liu [57] shows that a suitable value of k1 is 53 and 30.6 for aircraft and birds, respectively. The correlation is shown in Figure 1.20.
 |
2 Wingspan
When studying flapping animals, parameters of interest are often related to the body mass m of the animal. Using the dimensional argument method and assuming geometric similarity for the animals considered, one can determine a relation between the wingspan and mass. Collecting data from Tennekes [29] for birds ranging from a 0.026-N black-chinned hummingbird to a 116-N mute swan, and data for propeller/turboprop aircraft and jet transports published by Jackson [58] covering a broad spectrum of aircraft from a 1500-N ultralight to a 1800-kN Boeing 747-400, Liu [57] suggests that, over a large range of the weight, birds and aircraft basically follow the power law:
l = 1.654m1/3 (aircraft); l = 1.704m1/3 (birds). (1-6)
When studying natural flyers, it is insightful to assess the effects of different parameters, such as wing area and wing span, on the flight characteristics based on the dimensional analysis [4] [29] [52]-[54]; this analysis presents very interesting correlations that can be used to summarize the various scaling laws ranging from birds and insects to aircraft. Tennekes [29] considered the relations between cruising speed, weight, and wing loading and established The Great Flight Diagram. The diagram is shown in Figure 1.19.
|
Pigeon wing Conventional airplane wing
Figure 1.18. Comparison of cross-sectional shapes of a pigeon wing and a conventional transport airplane wing. The pigeon wing exhibits noticeably more variations in camber and thickness along the spanwise direction. |
With technical advancement, the MAV dimensions, wing loading, and speed will continue to decrease, moving toward the lower left corner in Figure 1.19. From Figure 1.19 one can compare and correlate relations between species with a pronounced difference in size. For example, the small fruit fly (Drosophila melanogaster) can be compared to the Boeing 747, which weighs about 500 billion times more. By using scaling analysis, one can predict how a parameter, such as wingspan, varies with another parameter, such as the body mass, for natural flyers in general or specific animal groups.
As an illustration, consider the balance between lift (L) and weight (W) during steady-state flight,
1
L = W = 2 pU 2SCl. (1-1)
From Eq. (1-1) it is possible to get an understanding of how wing area (S), air speed (U), density (p), and wing loading (W/S) are connected. Wing area (S): The wing area for a flight vehicle is often defined as the area projected when the wing is seen from above, and usually it includes the contribution from the “wing area” inside the fuselage. Airspeed (U): The air speed is defined as the forward velocity for the flight vehicle. Given a particular AoA, a twofold increase in speed will result in a fourfold increase in lift. Density (p): For cases of interest to bird and insect flight, the density of the air is basically unchanged, because birds fly within a narrow altitude near sea level. In general, a decrease of density due to an increase in altitude will decrease the lift.
From Eq. (1-1), it is clear that the cruising speed depends on the wing loading (W/S):
W1
у = 2 PU 2Cl . (1-2)
Equation (1-2) shows that the greater a flyer’s wing loading, the faster it has to fly. Some of the relations between body mass and parameters connected to birds
|
Table 1.3. Power functions of wing dimensions and flight parameters against body mass m
Source: Originally compiled by Norberg[4], Greenewalt [55], and Rayner [56]. |
are shown in Table 1.3. Figure 1.19 offers a correlation between sizes and speeds, and Table 1.3 summarizes expanded correlations. More details are discussed in the following sections.
While flapping, birds systematically twist their wings to produce aerodynamic effects in ways similar to that of the ailerons on the wings of conventional airplanes. Specifically, one wing is twisted downward (pronated) to reduce the angle of attack (AoA)
 |
[51].
and corresponding lift, while the other wing is twisted upward (supinated) to increase lift. With different degrees of twisting between wings, a bird is able to roll [1]. For a bird to be able to deform and twist its wings, an adaptation in the skeletal and muscular systems is required. The key features that seem desirable are modification of camber and flexing of the wing planform between upstroke and downstroke, twisting, area expansion and contraction, and transverse bending. To perform these functions, birds have a bone structure in their wings similar to the one in a human arm or a bat wing, as shown in Figure 1.17. Despite these similarities birds have more demanding muscle and bone movement in their wings during flight than a human arm is capable of making. Figure 1.18 compares the cross-sectional shapes of a pigeon wing and a conventional transport airplane wing. To a noticeable extent, the pigeon wing exhibits a greater number of variations in camber and thickness along the span.
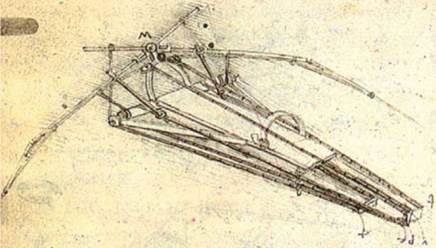
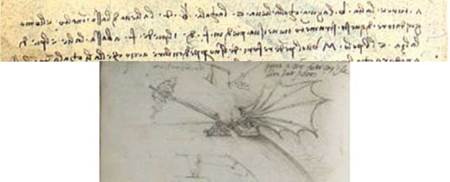
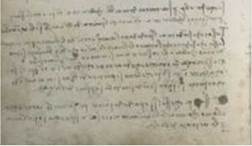
Bird, bat, and insect flight has fascinated humans for many centuries. As enthusiastically observed by Dial [1], most species of animals fly. Based on his acute observation of how birds fly, Leonardo da Vinci conceptualized flying machines, which can be seen in documents such as the Codex on the Flight of Birds, published circa 1505 [2]; some illustrations of his work are shown in Figure 1.1. Otto Lilienthal was among the most dedicated and successful creators of flying machines at the dawn of human flight. He designed and demonstrated many hang gliders (see Fig. 1.2). Unfortunately, Lilienthal lacked sufficient knowledge of the science of flight and was killed in a fatal fall. For those who wish to explore in greater detail the history and the technology of early flight, John Anderson’s Inventing Flight [3] offers interesting and well – documented information. Of course, there are ample records of humankind’s interest in natural flyers from the artistic angle. Figure 1.3 shows four examples: (Figure 1.3a) decorative art done about 2,500 years ago, in China’s Warring Period; (Figure 1.3b) a bronze crane model uncovered from the First Emperor’s grave, who died in 210 BC; a pair of bas-reliefs (Figure 1.3c, d) uncovered from the Assyrian palace in today’s Iraq, dated back to the 8th century BC; (Figure 1.3e) a stone sculpture of a standing owl from the Shang Dynasty, China, created in the 12th century BC or earlier!
There are nearly a million species of flying insects, and of the non-insects, another 13,000 warm-blooded vertebrate species (including mammals, about 9,000 species of birds, and 1,000 species of bats) take to the skies. In their ability to maneuver a body efficiently through space, birds, bats, and insects represent one of nature’s finest locomotion experiments. Although aeronautical technology has advanced rapidly over the past 100 years, nature’s flying machines, which have evolved over 150 million years, are still impressive. Considering that humans move at top speeds of 3-4 body lengths per second, a race horse runs approximately 7 body lengths per second, a cheetah accomplishes 18 body lengths per second [4], and a supersonic aircraft such as the SR-71 “Blackbird” traveling near Mach 3 (~900 m/s) covers about 32 body lengths per second, it is remarkable that a Common Pigeon (Columba livia) frequently attains speeds of 22.4 m/s, which converts to 75 body lengths per second. A European Starling (Sturnus vulgaris) is capable of flying at 120 body lengths per second, and various species of swifts are even faster, flying more than 140 body lengths per second. Whereas the roll rate of highly aerobatic aircraft (e. g., A-4 Skyhawk) is approximately 720°/s, a Barn Swallow (Hirundo rustics) has a roll
|
|
|
|
|
|
|
Figure 1.1. A drawing of a design for a flying machine by Leonardo da Vinci (c. 1488). This machine was an ornithopter, with flapping wings similar to a bird, first presented in his Codex on the Flight of Birds circa 1505 [2]. |
 |
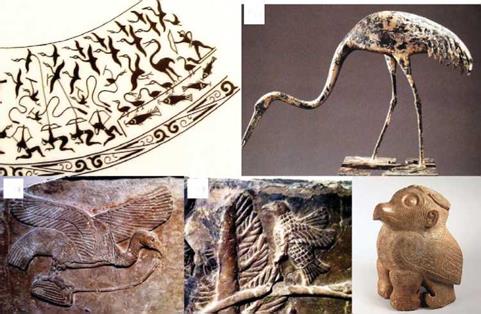 Figure 1.3. Birds recorded in early human history: (a) design of a wine vessel, early Warring period (475-early fourth century BC), China (Shanghai Museum, Shanghai); (b) a bronze crane-eating fish, uncovered inside the First Emperor’s grave site, Xian, China (Museum of Emperor QinShihuang, Xian); (c, d) Assyrian bas-reliefs, circa eighth century BC (British Museum, London); (e) Stone sculpture of a standing owl, Shang Dynasty, China, around the 12th century BC or earlier (Academia Sinica, Taipei).
|
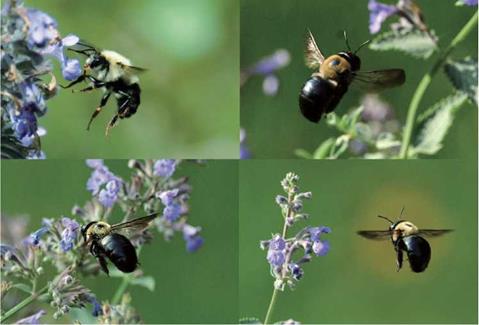
Figure 1.4. According to the simplified static aerodynamics, bumblebees were proclaimed to be unfit to fly. |
rate in excess of 5,000°/s. The maximum positive G-force permitted in most general aviation aircraft is 4-5 G, and select military aircraft withstand 8-10 G. However, many birds routinely experience positive G-forces in excess of 10 G and up to 14 G. Such superior maneuvering and flight characteristics are primarily because of the “scaling laws” with respect to a vehicle’s size, as well as intuitive but highly developed sensing, navigation, and control capabilities. As McMasters and Henderson put it, humans fly commercially or recreationally, but animals fly professionally [5].
Compared to vehicles with flapping wings, conventional airplanes with fixed wings are relatively simple; the forward motion relative to the air causes the wings to generate lift, with the thrust being produced by the engine via either propellers or exhaust gas. However, in biological flight the wings not only move forward relative to the air but they also flap up and down, plunge, and sweep [1] [4] [6]-[8], so that both lift and thrust can be generated and balanced in accordance with the instantaneous flight task. Aymar [9] and Storer [10] provide early photographs and some general observations. Although in the early days of flight studies, much of the analysis of flapping wing aerodynamics was based on an analogy to the fixed-wing counterpart, it was known that this approach encountered qualitative difficulties, especially when the size of a flyer became smaller, as in small birds, small bats, and insect regimes. In 1934, Antoine Magnan, an entomologist, discussed an analysis by Andre Sainte- Lague, an engineer, that whereas the lift generated by wings can adequately support an aircraft to stay aloft, the same is not true at equivalent speeds of a bee [11]. In other words, an airplane the size of a bee, moving as slowly as a bee, should not be able to fly [12]. Yet, of course, bumblebees, shown in Figure 1.4, can fly.
This example illustrates in simple fashion the implied conclusion – that the theory of fixed-wing aerodynamics cannot explain certain critical aspects of
|
Figure 1.5. The instantaneous flapping wing patterns can sometimes look reasonable to be analogous to stationary wings under a series of quasi-statically defined conditions. |
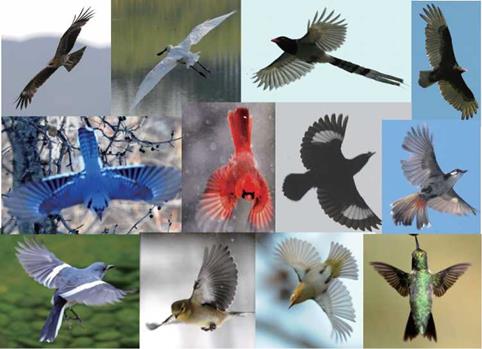
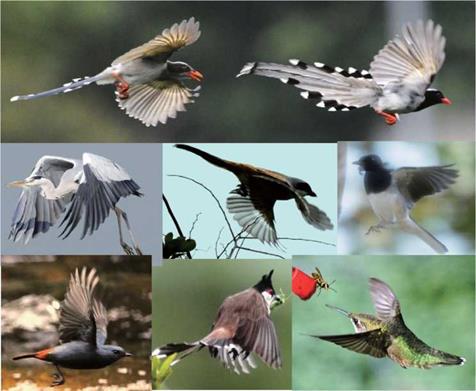
flapping wing aerodynamics. The aforementioned framework of fixed wings essentially considers flapping wing dynamics as a series of “snapshots” (as illustrated by Fig. 1.5), neglecting the influence of the aerodynamics and wing motion at an earlier moment on the aerodynamics at a later time, based on the so-called quasi-steady approach. In reality, a small flyer can often benefit from manipulating unsteady fluid flows using flapping wing aerodynamics. A rich variety of natural flyers, as depicted in Figure 1.6, can be observed to characterize the instantaneous flapping wing motions. Depending on the real-time flight requirements, these complex motions and wing shapes generate the desirable lift and thrust in different flight environments.
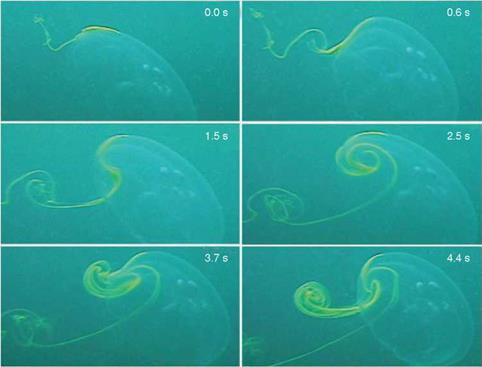
As another example, Franco et al. [13] investigated fluid-structure interactions (FSIs) seen in jellyfish. They reported aperiodic flow despite the relative simplicity of a jellyfish’s body shape and motion, as shown in Figure 1.7. Muscle contraction reduces the volume of the subumbrellar cavity (i. e., the region underneath its umbrella-shaped body), resulting in a net downward flux of fluid. The motion of the lower margin of the bell generates vortex rings of opposite rotational sense during the contraction and relaxation phases of the swimming cycle. Franco et al. [13] observed that these vortices act to entrain fluid from above the animal into the subumbrel – lar cavity, where the feeding and sensory apparatuses of the animal are located. Furthermore, despite the approximate periodicity of the swimming motion, inspection of the flow created by the animal indicates that it is indeed aperiodic in time. Because the animal does not swim at a constant velocity, a periodic flow cannot be constructed by any Galilean transformation of frame. Instantaneous streamlines of the flow field, measured by Franco et al. [13] using digital particle image velocimetry,
|
Figure 1.6. In reality, the instantaneous flapping wing patterns are very complicated. Depending on the real-time flight requirements, necessary lift and thrust are generated by dynamic mechanisms resulting from unsteady wing movement and shape changes. |
|
Figure 1.7. Dye visualization of jellyfish vortex wake. Time series shows vortices of clockwise and counterclockwise rotation sense generated during the contraction and relaxation phases of the swimming cycle, respectively. Bell diameter is 10 cm. Images from Franco et al. [13]. |
|
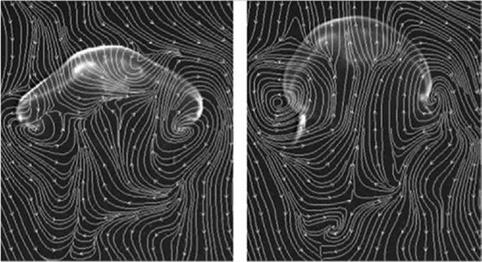
Figure 1.8. Instantaneous streamlines of flow around a jellyfish as it swims vertically. Left: End of relaxation phase of swimming cycle. Right: End of contraction phase of swimming cycle. Bell diameter is 10 cm. Images from Franco et al. [13]. |
indicate local entrainment of fluid from above the animal into the subumbrellar cavity during the entire swimming cycle. Simultaneously, as shown in Figure 1.8, a net downward momentum flux propels the animal forward. This study illustrates that (i) the flow field and force generation processes are highly time dependent and cannot be described based on a simple quasi-steady framework without substantial corrections, and that (ii) the movement and shape deformation of the body influence animal locomotion in major ways.
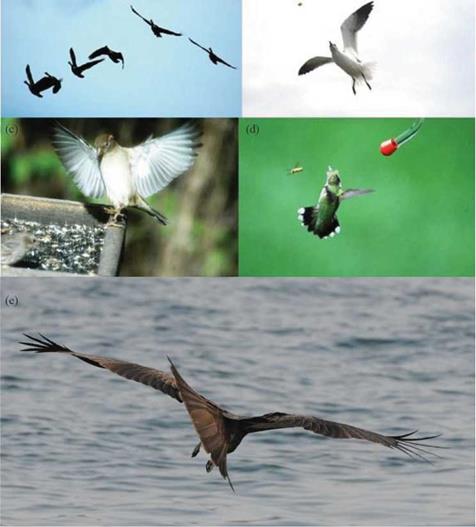
In addition to generating the aerodynamic forces, flapping wings can also significantly enhance the maneuverability of a flyer. Figure 1.9 illustrates several maneuvering characteristics of biological flyers; these capabilities are difficult to mimic by human-made machines. By combining flapping motion, wing deformation, body contour, and tail adjustment, natural flyers can track targets precisely at amazing speeds. Another issue of interest is the weight of the wings relative to the total animal weight. As summarized in Table 1.1, bat wings, depending on the species, are close to 20 percent of the wing-to-total bat weight. The wings of other natural flyers, as shown in Table 1.2, including large birds such as osprey and vultures, account for 20 percent or more of their body weight. Many butterflies (such as Scarce Swallowtail, Large White) also have relatively heavy wings, around 15 to 25 percent of body weight. The wings of a Small Heath, a small, yellow-orange butterfly that flies close to the ground, are about 5 percent of its body weight. Bees, wasps, flies, and the like all have very light wings, typically less than 1 percent of their body weight.
Heavier wings require more energy to flap; nevertheless their larger inertia enables the flyers to make turns within one or two flapping periods. Those with a higher wing-to-body mass ratio and moment of inertia, such as bats and butterflies, are more maneuverable, capable of making abrupt changes of trajectories within a time comparable to that of a flapping cycle. However, they pay a penalty for this ability because a heavier wing consumes more energy while flapping. Many small
|
(a) (b)
Figure 1.9. Maneuvering capabilities of natural flyers: (a) Canadian Geese’s response to wind gust; (b) speed control and target tracking of a seagull; (c) precision touchdown of a finch; (d) a hummingbird defending itself against a bee; (e) the asymmetric movement of wings and tail of a Black Kite while hunting. |
flyers such as hummingbirds and insects (with many butterflies as a noticeable exception) tend to have much faster flapping time scales than their bodies’ response time scale. For the higher wing-to-body mass ratio group, with the flapping and body response time scales being comparable, the flyer’s flight dynamics and control need to be closely linked to the instantaneous aerodynamics, because the time history of the flapping wing aerodynamics directly affects a flyer’s performance characteristics. For the lower wing-to-body mass ratio group, whose flapping time scales are significantly shorter than their bodies’ response time scale, the lift, drag, and thrust variations during the flapping cycle tend to be smoothed out over the entire flight flapping cycles.
|
Table 1.1. Mass of wing and body, and wing dimensions for eight species of bats. With relatively heavier wings, bats can maneuver and make a turn within a stroke or two. On the other hand, they have to work harder to flap
Free-Tailed Bat (Otomops martiensseni) |
Notes: mb is body mass, mw is wing mass (total), b is wingspan, S is wing area (total), and AR is aspect ratio. Note the body mass is computed by the subtraction of the total wing mass from the total mass.
Source: [47].
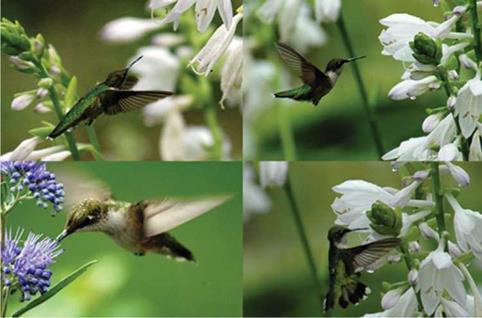
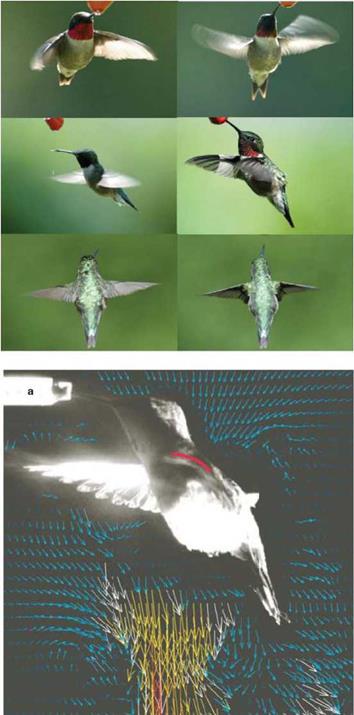
However, this feature does not mean that the flapping wing aerodynamics of small flyers can simply be considered as quasi-steady. As is discussed in detail in Chapter 3, the time history of the wing motion is often important to flapping wing aerodynamics. Figure 1.10 shows hummingbirds conducting highly difficult and precise flight control. As illustrated in Figure 1.11, in which several photos highlight the flapping pattern along with a flow field illustration from Warrick et al. [14], hummingbird wing motion exhibits a figure-eight pattern and is highly adaptive to accommodate the challenges posed by wind gust, target tracking, and mitigation of potential interference and threat.
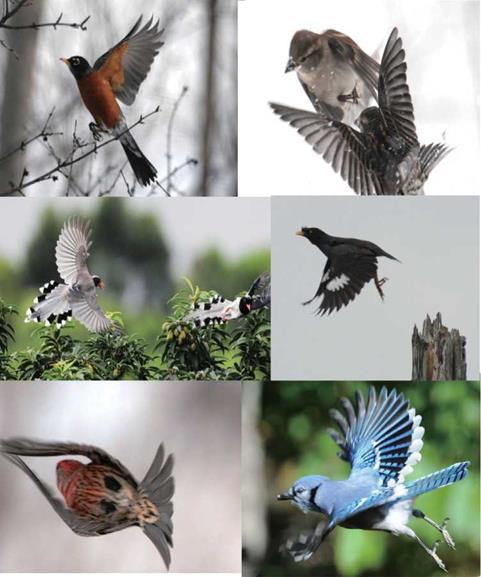
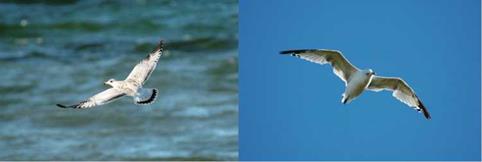
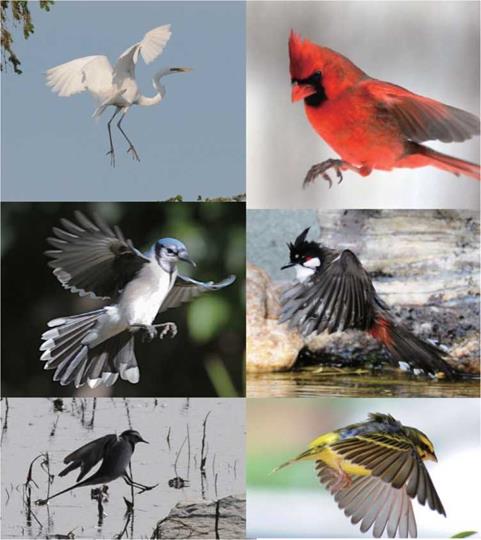
Natural flyers synchronize their wings, body, legs, and tail to perform many tasks. As shown in Figure 1.12, they can take off on water, from land, and off a tree, exhibiting varied and sophisticated patterns. While gliding, as shown in Figure 1.13, they flex their wings to control their speed and direction. On landing, as depicted in Figure 1.14, birds use wing-tail combinations to correct flight trajectory and to adjust for the location of the available landing area. If they need to slow down and adjust the detailed flight trajectory, they fully expand their wings to increase drag and reduce speed; otherwise, they simply fold their wings to reduce lift without slowing down.
|
Table 1.2. Mass of wing and body, and wing dimensions for some insects [48] and birds [49]. With lighter wings, which results in time scale differences between the wing movement and the body movement, flyers such as bumblebees need to flap a number of times before being able to make turns
Source: Insects [48] and birds [49]. |
|
Figure 1.10. Natural flyers can track a target precisely and instantaneously. Shown here are hummingbirds using flapping wings, contoured body, and tail adjustment to conduct flight control. |
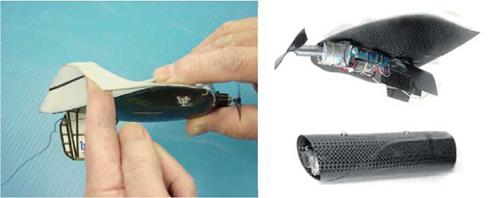
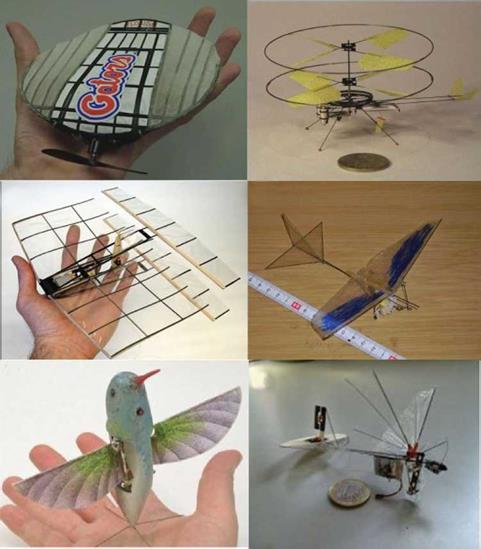
Since the late 1990s, micro air vehicles (MAVs) have attracted substantial and growing interest in the engineering and science community. An MAV is defined as a vehicle with a maximal dimension of 15 cm or less, which is comparable to the size of small birds or bats, and with a flight speed of 10-20 m/s [15]. Equipped with a video camera or a sensor, MAVs can perform surveillance and reconnaissance, targeting, and biochemical sensing at remote or otherwise hazardous locations. With the rapid progress made in structural and material technologies, miniaturization of power plants, communication, visualization, and control devices, numerous groups have developed successful MAVs. In the process, many MAV concepts, based on the fixed wing, rotary wing, and flapping wing, have been investigated [16]. Figure 1.15a shows an inventive 15-cm MAV design by Ifju et al. [17] that uses a fixed, flexible wing concept. Figure 1.15b shows a rotary wing MAV with 8.5-cm rotary diameter designed by Muren (http://www. proxflyer. com). Figure 1.15c shows a biplane MAV designed by Jones and Platzer [18], which uses a hybrid flapping-fixed-wing design, with the flapping wing generating thrust and the fixed wing producing necessary lift. Figure 1.15d shows an MAV by Kawamura et al. [19] that relies on a flapping wing to generate both lift and thrust and possesses some flight control capabilities. Figure 1.15e shows a 16.5-cm MAV recently developed by AeroVironment (http://www. avinc. com/), which uses a hummingbird-like flapping wing design. It can hover for eight minutes without external power, fly forward with a speed of 4.9 m/s, return to hover, and then withstand a 2 m/s wind gust from the side without drifting more than 1 meter. Figure 1.15f shows a recently developed 10-cm and 3- gram flapping wing MAV (http://www. delfly. nl/?site=diii&menu=home&lang=en). It can carry a small camera and 1-gram battery and fly up to 5 m/s for 3 minutes. As
|
|
Figure 1.12. During takeoff, natural flyers display larger flapping amplitudes, wider and larger wing and tail surfaces, and springing. The level of coordination between wing, tail, and body is remarkable. |
|
Figure 1.13. Birds such as seagulls glide while flexing their wings to adjust their speed as well as to control their direction. |
|
Figure 1.14. While landing, birds use various options. They may fold their wings to reduce the lift if the flight speed is appropriate and there are no environmental disturbances such as wind gust. They also often deliberately stall their fully stretched wings on final approach, maximizing drag to obtain quick deceleration and not being concerned about lift during the final stage of flight. |
demonstrated by the U. S. Defense Advanced Research Projects Agency (DARPA), there is substantial interest in developing and using MAVs with robust “perch and stare” capabilities that can take off without external assistance. There are a number of possible candidates, including the aforementioned flapping-wing-based vehicles and rotorcraft such as quad-rotors [20].
Figure 1.16 highlights detailed vehicle characteristics of flexible wing MAVs designed by Ifju and co-workers. The various international MAV competition venues, initiated by the University of Florida and now widespread globally, have substantially encouraged the development of MAVs. The MAVs operate in the low
![]()
 (e)
(e)
Figure 1.15. Representative MAVs: (a) flexible fixed wing [17]; (b) small-sized rotary wing (http://www. proxflyer. com); (c) hybrid flapping-fixed wing, with the fixed wing used for lift and the flapping wing for thrust [18]; (d) flapping wing for both lift and thrust [19]; (e) hummingbird-inspired robotic Nano Air Vehicle (http://www. avinc. com/); and (f) a 5-cm wingspan flapping wing MAV (http://www. delfly. nl/?site=diii&menu=home&lang=en).
Reynolds number (characterizing the relative importance between inertia and viscous effects of the fluid) and, compared to large manned flight vehicles, experience unfavorable aerodynamic characteristics, such as low lift-to-drag ratio [21]. However, the MAVs’ small geometric dimensions result in favorable scaling characteristics, such as reduced stall speed and better structural survivability.
General references offering broad accounts of biological flight, including geometric scaling laws, power, and morphology, as well as simplified modeling, can be found in Alexander [22] [23], Azuma [24], Biewener [25], Brodsky [26], Dudley [27], Grodnitsky [28], Norberg [4], Tennekes [29], Videler et al. [30], Vogel [31],
|
(а) (Ъ) Figure 1.16. The flexible-wing MAVs (a) can benefit from passive shape adaptation in accordance with instantaneous aerodynamic loading and (b) can be packed very easily based on need. (Courtesy Peter Ifju). |
Ward-Smith [32], Dalton [33], Pringle [34], Henderson [35], and Floreano et al. [36]. The symposia volumes edited by Wu et al. [37], Pedley [38], and Maddock et al. [39] offer multiple aspects of biological flight as well as swimming. Lighthill [40], Wu [41], Childress [42], and Maxworthy [43] discuss swimming and flying primarily from analytical viewpoints with simplified problem definitions. Finally, the standard texts by Anderson [44], Katz and Plotkin [45], and Shevell [46] present basic knowledge of human-made aerodynamics relevant to both biological and human – made MAVs.
In the following chapters, we offer an introductory and simplified, concept – based framework on the lift – and thrust-generation mechanisms of flapping wing vehicles. Specifically, we present the scaling laws related to the mechanics and energetics of avian flight. Then, we use simple mechanics to describe gliding, forward, and hovering flight, as well as drag and power related to avian flight. The different power components are first presented separately and then summed together, giving the total power required for hovering and forward flight. The results of these different power calculations can be summarized in the form of power curves. The analyses are based on the quasi-steady approach, neglecting the time history of the wing motion. This approach, although incomplete in certain important aspects (such as coupled and multi-scale mechanics between wing and fluid and between wing and body and tail, shape deformation, and the time history of force generation), can offer useful insights into some of the important and basic issues related to flapping wing flight. More detailed and critical discussions accounting for unsteady fluid physics and fluid-structure interactions are presented in later chapters.
Low Reynolds number aerodynamics is important for a number of natural and man-made flyers. Birds, bats, and insects have been of interest to biologists for years, and active study in the aerospace engineering community has been increasing rapidly. Part of the reason is the advent of micro air vehicles (MAVs). With a maximal dimension of 15 cm and nominal flight speeds around 10 m/s, MAVs are capable of performing missions such as environmental monitoring, surveillance, and assessment in hostile environments. In contrast to civilian transport and many military flight vehicles, these small flyers operate in the low Reynolds number regime of 105 or lower. It is well established that the aerodynamic characteristics, such as the lift-to-drag ratio of a flight vehicle, change considerably between the low and high Reynolds number regimes. In particular, flow separation and laminar – turbulent transition can result in substantial change in effective airfoil shape and reduce aerodynamic performance. Since these flyers are lightweight and operate at low speeds, they are sensitive to wind gusts. Furthermore, their wing structures are flexible and tend to deform during flight. Consequently, the aero/fluid and structural dynamics of these flyers are closely linked to each other, making the entire flight vehicle difficult to analyze.
The primary focus of this book is on the aerodynamics associated with fixed and flapping wings. Chapter 1 offers a general introduction to low Reynolds flight vehicles, including both biological flyers and MAVs, followed by a summary of the scaling laws that relate the aerodynamics and flight characteristics to a flyer’s sizing on the basis of simple geometric and dynamics analyses. Chapter 2 examines the aerodynamics of fixed, rigid wings. Both two – and three-dimensional airfoils with typically low aspect ratio wings are considered. Chapter 3 examines structural flexibility within the context of fixed wing aerodynamics. The implications of laminar-turbulent transition, multiple time scales, airfoil shapes, angles-of-attack, stall margin, structural flexibility, and time-dependent fluid and structural dynamics are highlighted.
Unsteady flapping wing aerodynamics is presented in Chapter 4. In particular, the interplay between flapping kinematics and key dimensionless parameters such as the Reynolds number, Strouhal number, and reduced frequency is examined. The various unsteady lift enhancement mechanisms are also addressed, including leading-edge vortex, rapid pitch-up and rotational circulation, wake capture, and clap-and-fling.
The materials presented in this book are based on our own research, existing literature, and communications with colleagues. At different stages, we have benefited from collaborations and interactions with colleagues: Drs. Peter Ifju, David Jenkins, Rick Lind, Raphael Haftka, Roberto Albertani, and Bruce Carroll of the University of Florida; Drs. Luis Bernal, Carlos Cesnik, and Peretz Friedmann of the University of Michigan; Drs. Michael Ol, Miguel Visbal, and Gregg Abate, and Mr. Johnny Evers of the Air Force Research Laboratory; Dr. Ismet Gursul of the University of Bath; Dr. Charles Ellington of Cambridge University; Dr. Keiji Kawachi of the University of Tokyo; Mr. Hikaru Aono of Chiba University; Dr. Mao Sun of the Beijing University of Aeronautics and Astronautics. In particular, we have followed the flight vehicle development efforts of Dr. Peter Ifju and his group and enjoyed the synergy between us.
MAV and biological flight is now an active and well-integrated research area, attracting participation from a wide range of talents and specialties. The complementary perspectives of researchers with different training and backgrounds enable us to develop new biological insight, mathematical models, physical interpretation, experimental techniques, and design concepts.
Thinking back to the time we started our own endeavor a little more than ten years ago, substantial progress has taken place, and there is every expectation that significantly more will occur in the foreseeable future. We look forward to it!
Wei Shyy, Yongsheng Lian, and Jian Tang Dragos Viieru Ann Arbor, Michigan, U. S.A.
Hao Liu Chiba, Japan December 31, 2006