In the design of rotor blade sections there is an a priori case for following the lead given by fixed-wing aircraft. It could be said, for instance, that the use of supercritical aerofoil sections for postponing the drag-rise Mach number is as valid an objective for the advancing blade of a rotor as for the wing of a high-subsonic transport aircraft. Or again, the use of blade camber to enhance maximum lift may be as valuable for the retreating blade as for a fixed wing approaching stall. Having accepted, say, this latter principle, there remains the problem of adapting it to the helicopter environment: this requires focused research, and substantial progress has been achieved.
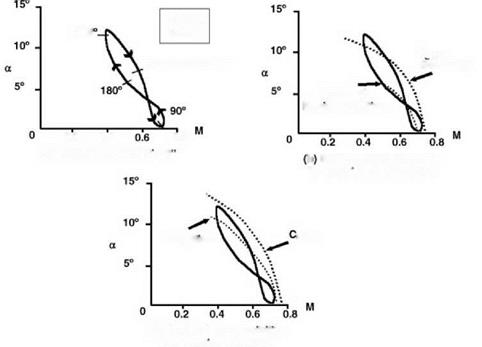
The widely ranging conditions of incidence and Mach number experienced by a rotor blade in forward flight are conveniently illustrated by a ‘figure-of-eight’ diagram (sometimes called
Basic Helicopter Aerodynamics, Third Edition. John Seddon and Simon Newman. © 2011 John Wiley & Sons, Ltd. Published 2011 by John Wiley & Sons, Ltd.

 0.2 0.4
Boundaries – N АСА 0012
 Drag Rise
(c) Stall & Compressibility
Boundaries – PL 9615
Figure 6.1 Figure-of-eight diagrams for a typical blade
sausage plots) (Figure 6.1a) which plots these conditions for a particular station on the blade near the tip (x = 0.91 in the case shown) at a specified value of ц. (In essence, a spanwise section of the blade is taken around a complete revolution and the various aerodynamic quantities recorded.) The hovering condition would be represented by a single point: as ц is increased the figure of eight expands, extending into regions of higher a (or CL) and higher Mach number (M).
Plotting on such a diagram the a-M loci of CL Max and MD (the drag-rise Mach number) for a particular blade section, these being obtained independently, as for example by twodimensional section tests in a wind tunnel, will give an indication of whether either blade stall or drag divergence will be encountered in the rotor at the particular level of ц. Effectively, the figure-of-eight plot tracks a particular location of a rotor blade around one complete rotation of the rotor. This will highlight instances where the aerofoil section crosses over boundaries such as drag rise and stall. The example in Figure 6.1b relates to a symmetrical, 12% thick, NACA 0012 section. It is seen that the retreating-blade loop passes well into the stalled region and the advancing-blade loop likewise into the drag-rise region.
NACA 0012 was the standard choice for helicopter blade sections over many years. It is symmetric and is expressed mathematically. The function gives the section the following features:
• a parabolic nose shape of given radius;
• a specified thickness/chord ratio with maximum thickness at a specified chordwise location;
• the trailing edge has a given thickness and included angle.
Modern aerofoil sections embodying camber to increase maximum lift have been developed in various series, of which the ‘VR’ Series in the USA and the ‘96’ Series in the UK are examples. Results for a 9615 section – the basis for the Westland Lynx blade – are shown in Figure 6.1c. The figure of eight now lies wholly within the CL Max locus, confirming an improvement in lift performance. Additionally the high-Mach-number drag rise now affects a much reduced portion of the retreating-blade loop, and the advancing-blade loop not at all, so a reduction in power requirement can be expected. It should be borne in mind that any improvement in thrust capability will automatically incur an increase in induced and climb power.
The evidence, though necessary, is not of itself sufficient, however. To ensure acceptability of the cambered section for the helicopter environment, additional aspects of a major character need to be considered. One is the question of section pitching moments. The use of camber introduces a nose-down CM0 (pitching moment at zero lift), which has an adverse effect on loads in the control system. A gain in CL Max must therefore be considered in conjunction with the amount of CM0 produced. One way of controlling the latter is by the use of reflex camber over the rear of a profile. Wilby [1] gives comparative results for a number of section shapes of the ‘96’ Series, tested in a wind tunnel under two-dimensional steady-flow conditions.
A selection of his results appears in Figure 6.2, from which we can see that the more spectacular gains in CL Max (30-40%) tend to be associated with more adverse pitching
|
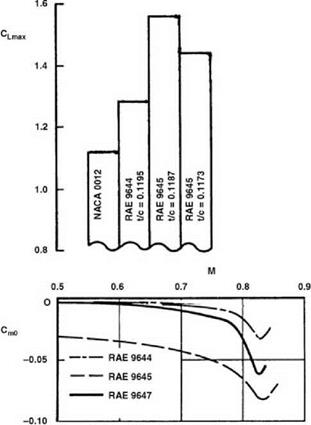
Figure 6.2 Comparison of CL Max and CM0 for various blade section profiles (after Wilby)
|
|
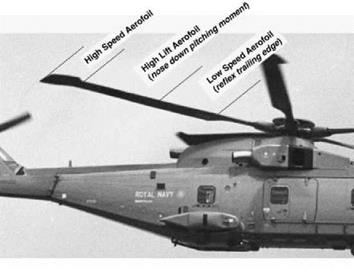
Figure 6.3 Spanwise variation of the aerofoil sections on the Merlin main rotor blade
|
moments, especially above a Mach number of approximately 0.75, which would apply on the advancing side of a rotor. Generally, therefore, compromises must be sought through much careful section shaping and testing. Moreover, while aiming to improve blade lift performance for the retreating sector, care must be taken to see that the profile drag is not increased, either at low CL and high Mach number for the advancing sector, or at moderate CL and moderate Mach number for the fore and aft sectors which in a balanced forward flight condition will carry the main thrust load. Figure 6.3 shows the variation of aerofoil sections on the BERP blade fitted to the fifth pre-prototype (PP5) EH101 aircraft. Each section is specifically designed for the particular incidence/Mach number ranges that it will experience.
While static testing of this nature is very useful in a comparative sense, it cannot be relied upon to give an accurate final value of CL Max, because the stall of a rotor blade in action is known to be dynamic in character, owing to the changes in incidence occurring as the blade passes through the retreating sector. Farren [2] recorded, as long ago as 1935, that when an aerofoil is changing incidence, the stalling angle and CL Max may be different from those occurring under static conditions. Carta [3] in 1960 reported oscillation tests on a wing with 0012 section suggesting that this dynamic situation would apply in a helicopter context. Figure 6.4 shows a typical result of Carta’s tests. When the aerofoil was oscillated through 6° on either side of 12° incidence (just above the static stalling angle), with a representative rotor frequency, a hysteresis loop in lift coefficient was obtained, in which the maximum CL reached during incidence increase was about 30% higher than the static level.
Many subsequent researchers, among them Ham [4], McCroskey [5], Johnson and Ham [6] and Beddoes [7], have contributed to the provision of data and the evolution of theoretical treatments on dynamic stall and in the process have revealed the physical nature of the flow, which is of intrinsic interest. As blade incidence increases beyond the static stall point, flow reversals are observed in the upper surface boundary layer – but for a time these are not transmitted to the outside potential flow. Consequently the lift continues to increase with incidence. Eventually, flow separation develops at the leading edge (or it may be behind
|
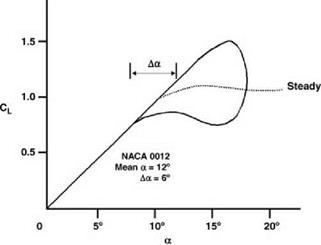
Figure 6.4 Lift hysteresis for oscillating blade (after Carta)
|
a recompression shock close to the leading edge), creating a transverse vortex which begins to travel downstream. As the vortex rolls back along the upper surface into the mid-chord region, lift continues to be generated but a large nose-down pitching moment develops owing to the redistribution of upper surface pressure. The passage of the vortex beyond the trailing edge results in a major breakdown of flow. Finally, when the incidence falls below the static stall angle as the blade approaches the rear of the disc, the flow reattaches at the leading edge and normal linear lift characteristics are re-established. The important consideration is that the aerodynamic influences with increasing incidence are not matched with the following reduction in incidence. This is the basis for the hysteretic effects seen in oscillating aerofoils.
Some further results for the RAE 9647 aerofoil section are shown in Figure 6.5, in this case from blade oscillation tests over four different incidence ranges. As the range is moved up the incidence scale, the hysteresis loop develops in normal force coefficient (representing CL) and the pitching moment ‘break’ comes into play. In practice it is the latter which limits the rotor thrust, by reason of the large fluctuations in pitch control loads and in blade torsional vibrations which are triggered. It is of interest to note that in the results shown, the normal coefficient reached at the point of pitching moment break is about 1.8. Considerably higher values may in fact be attained; however, it is to be noted that this value on the retreating blade is not particularly important in itself, since what matters more is the amount of lift produced by the other blades in the fore and aft sectors, where in a balanced rotor the major contributions to thrust are made.
Initially, one saw a situation on blade section design still capable of further development. The emphasis was placed on improving the lift capability of the retreating blade. As the aspect of fuel economy in helicopter flight gains in importance, the incentive grows to reduce blade profile drag, particularly for the advancing sector. In this area there are probably improvements to be had by following the lead given by fixed-wing aircraft in the use of so-called supercritical wing sections. A further comment putting the incentive into context is made in Chapter 7. What is now under scrutiny is the influence of efficiency. This is a result of the perceived need to conserve energy resources and the aeroelastic behaviour of a blade is now being used to
|
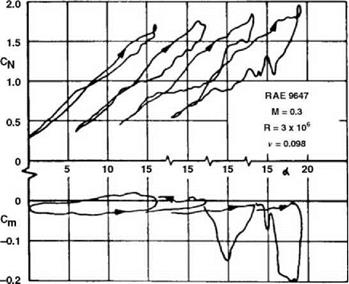
Figure 6.5 Development of lift hysteresis and pitching moment break as incidence range is raised (after Wilby)
|
improve performance and to reduce both fuel consumption and vibratory influences. The initial aeroelastic effects are passive in nature; however, the research direction is now directed towards active aerodynamic techniques such as blade morphing and tip blowing. This allows blade camber to be adjusted in a live environment and to control the nature and strength of the tip vortex.
 (c) Vertical motion


 0.2 0.4


 1
1
