Category BASIC HELICOPTER AERODYNAMICS

Blade Element Theory

5.1.2 Factors Involved

An exposition of blade element theory follows the same broad lines as used for hover (Chapter 3), taking into account, however, the extra complexities involved in forward flight. We begin by introducing the additional factors which enter into a forward flight condition.

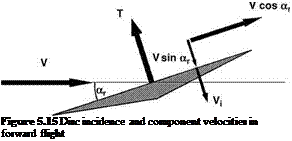
Figure 5.15 shows a side view of the rotor disc – strictly a shallow cone as we have already seen. Motion is to the left and is assumed horizontal; that is to say, without a climb component. The plane enclosing the edge of the disc – the tip-path plane (TPP) – makes an angle ar with the oncoming stream direction. ar is reckoned positively downwards since that is the natural direction of tilt needed to obtain a forward component of the thrust necessary to maintain forward flight. We shall use small-angle approximations as required. The flight velocity V has components Vcos ar and V sin ar along and normal to the TPP. The advance ratio is given by:

Подпись:V cos ar V

OR ‘ OR

as used previously. The total inflow through the rotor is the sum of V sin ar and Vi, the thrust- related induced velocity.

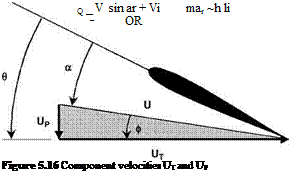
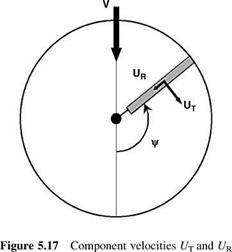
Referring to Figure 5.16, the resultant velocity U at a blade section is now a function of rotor rotation (i. e. rotor azimuth), helicopter forward speed, induced velocity and blade flapping motion. Components of U in the plane of the rotor rotation are UTand UP; additionally, because of the forward speed factor there is a spanwise component UR, shown in Figure 5.17. Components UT and UR are readily defined; to first order these are:

UT = Or + V sin C (5.35)

Ur = V cos C (5.36)

or, in non-dimensional form:

Подпись:

Подпись: Figure 5.15 Disc incidence and component velocities in forward flight

uT = x + m sin c uR = m cos c

Подпись: (5.39)

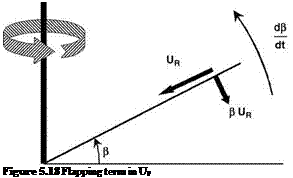
The component UP has three terms, non-dimensionally, as follows: 1. The inflow factor:

2. A component of uR normal to the blade, which for a flapping angle b relative to the reference plane is seen (Figure 5.18) to be fiuR or:

b • m cos C (5.40)

3.

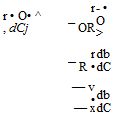
A component resulting from the angular motion about the flapping hinge; at station r along the span, this is:

db_ db dC

Подпись: (5.41)

Подпись: Figure 5.18 Flapping term in UP

dt dC dt

– r• O. db

— r O dC

Подпись: 1 OR Подпись: r • O• ^ r - • O > , dCj — OR r db — R • dC — v • db — x dC Подпись: db dC Подпись: (5.42)

when non-dimensionalising with respect to tip speed this becomes:

Thus, combining these terms together,

Подпись: (5.43)Up — l A bm cos C A x •

For small angles the resultant velocity U may be approximated by UT. The blade angle of incidence may be written as:

a — в—ф — в – — — в – — (5.44)

Ut Ut

Note that whereas the values of в and ф depend upon the choice of reference plane, the actual blade incidence a does not, so the expression (в — uP/uT) is independent of the reference plane used.

Blade Vortex Interaction

As concerns a detailed analysis of the rotor wake, corresponding to that outlined in Chapter 2 for the hover, the complication introduced by forward flight comes down to the fact that at a given radial position, the blade incidence, and hence the circulation, varies widely around the azimuth. Each change of circulation results in a counter vortex being shed into the wake and since the change is a circumferential one, the vortex line in this case lies in the spanwise direction. This system of ‘shed’ vortices is now additional to the ‘trailing’ vortex system arising, as in hover, from the spanwise variations in circulation.

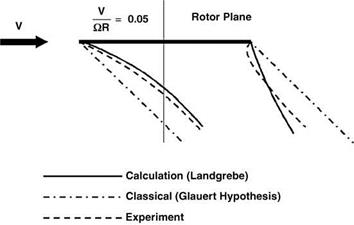
Undeterred by such multiplicity of complication, the modern computer, guided by skilled workers among whom pioneers include Miller, Piziali and Landgrebe, is still capable of providing solutions and indeed building year upon year. The power of the modern computer is releasing rotor analysis from restrictions which were necessary in the past to achieve a realistic result. An example from Landgrebe’s calculations shows in Figure 5.14 a theoretical wake boundary at low advance ratio, compared with experiment by smoke visualization and also with the Glauert momentum theory solution. The numerical solution and the experimental evidence agree well; momentum theory gives a much less accurate picture. A feature to note is that the boundary at the front of the disc lies close to the disc. This is illustrated in Figure 1.22c. At a higher advance ratio, more representative of forward flight, this feature and the general sweeping back of the wake would be much more marked.

This brief reference to what is a large subject in itself will suffice for the purposes of the present book. Extended descriptions can be found in the standard textbooks.

Figure 5.14 Wake boundaries at low advance ratio (after Landgrebe)

Wake Analysis

5.1.1 Geometry of the Rotor Flow

5.1.1.1 Sweep Angle

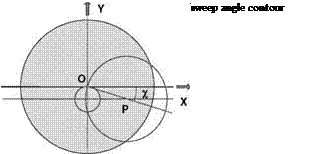
The combination of rotation and forward speed makes the local inflow distribution across a helicopter rotor disc complex. One aspect is the angle of inflow at a given point of a rotor blade at a given azimuth angle; that is, the sweep angle. This section derives, in closed form, the equation defining the sweep angle contours.

Derivation of Contours

The rotor dimension is normalized to a unit radius. Also, the velocity components are normalized on the rotor tip speed. A general point of a rotor blade is at a normalized radius of (xRAD) and azimuth angle (C).

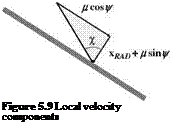
The velocity components defining the local sweep angle are shown in Figure 5.9.

From the figure, the sweep angle is defined by:

Подпись: (5.24)

Подпись: Figure 5.9 Local velocity components

m cos C

tan w =

XrAD + m sin C

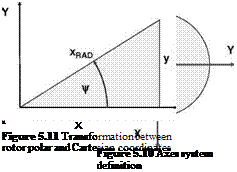
In order to determine the contour equations we use the following axes system (see Figure 5.10): the X axis (abscissa) lies in the incident airflow due to forward speed, that is over the tail, and they axis (ordinate) lies to starboard. With this axis system, the relationship between the normalized rotor radius (xRAD) and the azimuth angle (C) is as shown in Figure 5.11.

The transformation equations are:

XRAD = J X2 + У2

Подпись:cos C = X/XRAD sin C = У/XRAD

Substituting (5.25) into (5.24) and clearing fractions gives:

y x

xrad + m———— m • cot w——

xRAD xRAD

hence:

x2+y2—m • cot w • x + my = 0 The equation of a general circle is given by:

Подпись: X2 + y2 + 2gx + 2fy + c = 0

where the centre of the circle is:

(—-f)

and the radius is:

Vg2 +f2—c

From (5.27)-(5.29), the circle has centre:

(m-w-—m)

and radius: which reduces to:

csc w

Geometrical Construction

This can be shown geometrically as in Figure 5.12.

The construction begins with drawing a line parallel to the flight direction (x) positioned at the distance of half the advance ratio; this is in fact passing through the centre of the reverse flow region. A second line is constructed from the origin (O, the centre of the rotor) at an angle to the
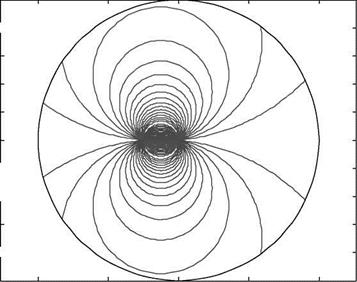
abscissa equal to the sweep angle contour required (w). This intersects the first construction line at point P. Using P as the centre and OP the radius, a circle is drawn. The part of this circle within the rotor disc (the unit circle) is the required contour. An example of these contours is shown in Figure 5.13 for an advance ratio of 0.25.

Examination of the equation governing the sweep angle contours enables the following conclusions to be made:

• The sweep angle contour is a circle.

• The zero angle contour is the advancing blade (C = 90°) and the retreating blade (C = 270°).

Подпись: |j. = 0.25 - Sweep Angles - -85 (5°) 85°Подпись: -1Подпись: -0.5Подпись: 0.5Подпись: 0Подпись: 1Подпись: Figure 5.13 Sweep angle contours

1

0.8 – 0.6 0.4 0.2 0

-0.2 -0.4 -0.6 -0.8 – -1

• The 90o contour is the periphery of the reverse flow region.

• All the contours pass within the reverse flow region. The sweep angle remains the same, but the flow direction is completely reversed.

Descending Forward Flight

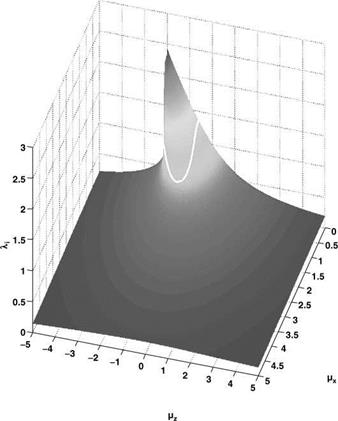
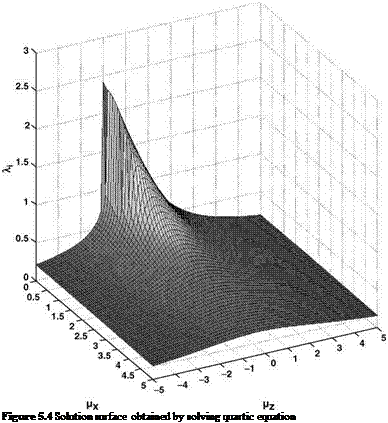
As can be seen in Figure 5.4, the majority of the surface is the same as Figure 5.3; however, the main difference is in the vortex ring state region of moderate descent with low to zero forward flight speed. Here the solution experiences a rapid jump in value – which, in fact, is not totally incorrect. Perhaps the most significant error in character is the fact that a steady value of induced velocity is indicated – the theory defines this – but, as already discussed, this is not the case in reality. We therefore need to define a region dividing those flight conditions which can be handled sensibly by actuator disc theory (ADT) and those which require a different approach. This requires the introduction of a vortex ring state boundary. This will be governed by the ability of the rotor to clear the vorticity which is being generated at the rotor disc.

So if we consider the overall advance ratio:

then that is the total normalized velocity through the rotor disc and will be the main influence in carrying the vorticity away. Work conducted on this topic by Newman et al. [2] defined this velocity to have a critical value, whence the boundary perimeter is defined by:

Подпись: (5.14)

Подпись: Figure 5.4 Solution surface obtained by solving quartic equation

mCRIT — J mX2 + (^Z + ^i)

This formula assumes that the forward and vertical velocities are completely efficient in disposing of this vorticity. However, consultation of the flow visualization of Drees [3] by Perry [4], showed that the forward velocity component does not operate with perfect efficiency. In addition, Brand [5] proposed a similar adjustment to the total vertical component. The revised boundary definition now becomes:

Подпись: li Подпись: (5.16)

which can be rearranged to give:

Подпись: (5.17)

If we now substitute (5.16) in (5.7) we obtain:

k2
yW2 (k2 ki) + mcRiT2

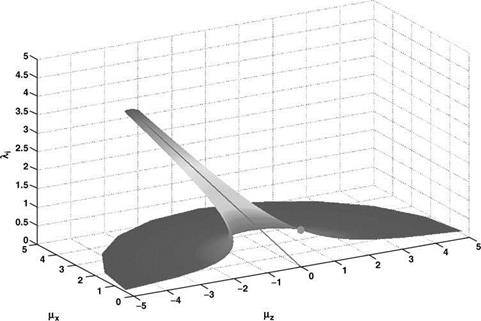
Hence, for a given value of /tCRIT and "x the values of mz and 1i, the boundary point, can be defined using (5.16) and (5.17).

Using the following values:

mcRiT — 0.74

k1 — 0.65 (5.18)

k2 — 0.9

the boundary is as shown in Figure 5.5.

As can be seen, the boundary hangs – like a necklace – around the area of concern. Having established the boundary, outside of which ADT can be sensibly used, the situation within the boundary needs comment. This is the region where the flow is dominated by vorticity and where a much more detailed theory needs to be used. Alternatively, which was the way initially used, experimental data can be introduced. Both experiment and more detailed analysis (see e. g. Bramwell’s Chapter 4) confirm that the Glauert proposal works well.

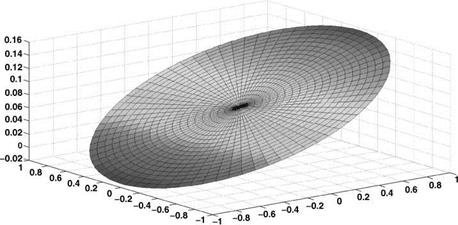
In practice the induced velocity cannot be expected to be constant over the area of the disc. Standard aerofoil theory would suggest an upwash at the leading edge and a greater-than – mean downwash at the trailing edge. To allow for a variation of this kind, Glauert proposed a second formula:

Vi(x, C) — Vi0(1+Ex cos C) (5.19)

where Vio is the value at the centre, taken to be that given by (5.3), x is the non-dimensional radius from the centre and C is the azimuth angle. If the constant E is chosen to be greater than 1.0 (typically 1.2), the formula gives a negative value, that is an upwash, at the leading edge (C — 180°). Equation 5.19 is often used as an input to numerical methods.

Figure 5.5 Solution surface and proposed VRS boundary

A plot of this profile, with E having the value 1.2, is shown in Figure 5.6.

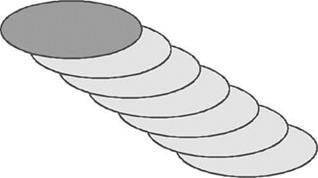
The plot is an inclined plane; note the negative values at the front of the disc. A justification for this downwash model can be found in examining a more detailed model using vortex rings, if they are positioned in an inclined stack, as shown in Figure 5.7.

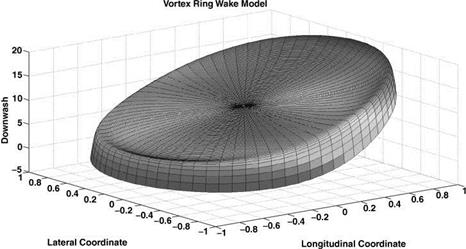
The resulting downwash variation is shown in Figure 5.8. As can be seen, the planar nature is shown within the central part of the disc and a negative value is predicted at the front of the disc. The ridge of the distribution in a region close to the disc edge is a local effect attributed to the vortex ring closest to the rotor disc.

More elaborate treatments of the non-uniform induced velocity in forward flight have been devised, among which one of the foremost is the method of Mangler and Squire [6]. Described at length by Bramwell (p. 127ff.), this method has shown satisfactory agreement with controlled experiments and is stated to be very useful in rotor calculations.

Reverting to the Glauert formula for uniform induced velocity, Equation 5.3, the induced power is:

T 2

2pA^JvX+(Vz+Vi )2
GlauertWake Model


Подпись: Downwash

which at normal forward flight speeds becomes approximately:

Подпись: Pi = TVi =T 2

2pAV

Подпись: (5.21)= T (T ) —

A 2rV

Tw = 2pV

that is, directly proportional to the disc loading w.

Figure 5.7 Stack of pennies visualization of vortex ring geometry


Figure 5.8 Vortex ring geometry, downwash variation

In non-dimensional terms the first equality of (5.20) is simply:

CPi = li • Ct (5.22)

where 1i is Vi/OR. It will be useful for the forward flight case to adopt a suffix ‘i’ for that part of the total induced flow which is due to the thrust-dependent induced velocity Vi, as distinct from a part due to the forward velocity V.

As with hover, a practical approximation to allow for the effect of non-uniformity in Vi and other smaller correction factors is obtained by applying an empirical factor k such that:

Cpi = ki • li • Ct (5.23)

The value of ki in forward flight is somewhat higher than that in hover, say 1.20 compared with the formerly suggested 1.15 (Section 3.6). Countering this, however, the induced velocity is seen in Figure 5.5 to become quite small even at moderate forward speeds: it will duly emerge that CPi is then much smaller than other components of the total power requirement.

Rotor Aerodynamics in Forward Flight

The aerodynamic situation in forward flight is complex. Numerical methods have largely taken over the task of evaluation but an analytical treatment, using simplifying assumptions, is valuable for providing a basic understanding of rotor behaviour. Such a treatment is the subject of this present chapter. The mechanisms of the previous chapter affect essentially the details of blade element theory. Before turning to that, however, it is useful to examine briefly what can be made of momentum theory, which as has been said is principally a theory for hover and axial flight; also it may be asked to what situations one is led in considering a more detailed wake analysis under forward flight conditions.

5.1 Momentum Theory

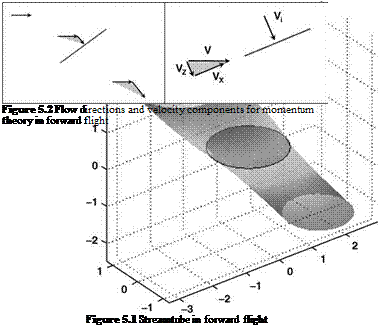
As the rotor begins to attain forward flight speed, the velocity of the air entering the rotor will increase as the forward flight speed combines with the sum of the induced velocity and any axial flight speed. In addition, it will approach the rotor disc at an inclined angle, hence any development of the actuator disc theory to include forward flight must address these issues. The type of streamtube shape seen in forward flight with an actuator disc is shown in Figure 5.1.

The modelling of the actuator disc theory into forward flight was addressed by Glauert [1] who devised a scheme which was based on the following:

• The concept of the streamtube is adopted.

• The area presented to the airflow for mass flow calculations is the whole disc area. This ensures the method is consistent with lifting line theory for a rectangular wing. In this case, the area for momentum calculations is a circle with the wing as diameter.

• The induced velocity is normal to the disc plane.

• The induced velocity in the far wake is twice that at the rotor disc – as in axial flight – and is also normal to the disc plane.

Basic Helicopter Aerodynamics, Third Edition. John Seddon and Simon Newman. © 2011 John Wiley & Sons, Ltd. Published 2011 by John Wiley & Sons, Ltd.

The velocities of the air through the streamtube are shown in Figure 5.2.

Expressing all velocities relative to the rotor:

• Far upstream, the airflow is horizontal.

• At the rotor disc, the induced velocity is added (vectorially) to the forward flight velocity.

• Far downstream, twice the induced velocity is added (vectorially) to the forward flight velocity.

With the notation of Figure 5.2, and noting the second statement of the scheme, the mass flow into the rotor disc is given by:

Подпись: (5.1)

pAy/vX+(VZ+Vi )2

This gives the rate of change of momentum normal to the rotor disc as:

m/vX +(VZ+Vi)2 • 2Vi

This must equal the rotor thrust, so we find the following expression:

T 1

Vi


(5.2)


(5.3)


2pA ^v|+(VZ+Vi)2

This equation can be normalized so that advance ratio components are used:

T 1 1

1 —


2rA Vt v^X+c^Z+^i)2

CT 1

J mX + (mZ+^i )2


(5.4)


The thrust coefficient dependence can be incorporated by normalizing the advance ratio components and the induced velocity by the hover induced velocity 1i0:


10 — /|f


(5.5)


that is:


(5.6)


1i0


(5.7)


which can be recast as:

Figure 5.3 Solution surface for actuator disc theory

Hence, for a given value of downwash, that is in a given plane parallel to the base (mX, mZ) plane, Equation 5.8 defines a circle:

Centre ) (—mz, 0)

P H – 1 (5-9)

Radius

li

The surface defined by (5.8) is shown in Figure 5.3.

The figure shows both the basic shape of axial flight and the effect of forward flight. As the forward flight velocity increases, the problems of moderate descent rate diminish and eventually disappear. The figure shows the mathematical results of the theory, but in reality the effect of forward speed is of providing a second mechanism for the rotor to clear the vorticity forming at the rotor disc.

The usual situation is of wanting to determine the value of the downwash from the advance ratio components and the rotor thrust. This means solving Equation 5.7, if we assume that we are working with normalized values of velocity.

This can be solved in two ways. Firstly it can be viewed as an iterative scheme, where an initial guess at a value of li is substituted into the right-hand side of (5.7) which gives a revised value. This has been shown to work well for high speeds where the mX term dominates. However, at low speeds, the calculation can take a large number of iterations to converge on a value to a sensible degree of accuracy. In hover, the routine will never converge – unless the

correct solution is used at the outset. A modification to the method was devised by Hansford who re-expressed (5.7) as:

li


0


(5.10)


This is now the solution for the root of a function of (1i) that is equal to zero – and invoking Newton-Raphson. This gives the following iterative scheme:

Подпись: li ( li(5.11)

The calculation is more complicated but convergence is achieved efficiently over the entire speed range.

Подпись: 10 Подпись: (5.12) Подпись: — 4 — 3 / 2 2  — li + 2mz • li + (mx + mz ) • l Подпись: -v- 2

Equation 5.10 can be squared and rearranged to give:

This is a quartic which gives four solutions. These comprise a complex conjugate pair, which can be discarded. The two real solutions are of opposite sign. As the induced velocity is always taken to be positive, the negative value can also be discarded. Hence the real positive solution is the one that should be used. This calculation has been performed over a range of values for mx and mz and the results are shown in Figure 5.4.

Testing Procedures

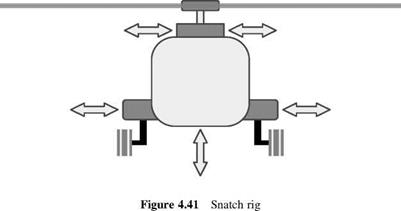
When a new helicopter design has been built to the first prototype stage it is usual to verify that it is not susceptible to ground resonance. In the past, the airframe was stripped to a minimum all-up weight. This uses the result that the lighter the helicopter, the greater the ground resonance vibration. The aircraft is then installed in a rig – known as a snatch rig – which attaches cables to strong points on the airframe. The rotor is gradually increased in speed and the pilot applies a cyclic pitch input to trigger flapping and hence lagging motion of the blades. The behaviour of the aircraft is then monitored for any sign of instability. This is repeated over a rotor speed range and also a range of collective pitch values so that the effect of reduced undercarriage load can be ascertained. Should instability be anticipated, the cables are pulled tight by a set of actuators such as hydraulic jacks. This causes the natural frequency of the fuselage to be raised moving the aircraft clear of the regressive lag mode. A schematic of a typical snatch rig is shown in Figure 4.41. The arrows show possible attachments to the airframe.

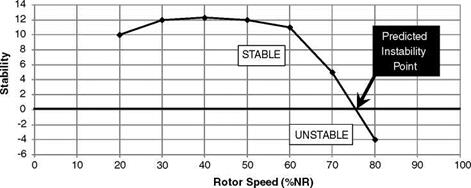
Prediction techniques and instrumentation have improved significantly since then and a helicopter can be cleared for ground resonance by monitoring the timewise fuselage and/or rotor blade motion directly. This information can be analysed very rapidly giving the condition of the helicopter in terms of ground resonance stability. The results will then

Figure 4.42 Example plot of locating incipient ground resonance

give the stability variation with respect to rotor speed. Figure 4.42 shows a possible variation and the behaviour of the curve approaching the axis gives an indication of an incipient instability.

References

1. Saunders, G. H. (1975) Dynamics of Helicopter Flight, John Wiley & Sons, Inc.

2. Coleman, R. P. and Feingold, A. M.(1958) Theory of self-excited mechanical oscillations of helicopter rotors with hinged blades, NACA Report TN-1351.

. Simple Analysis with Fuselage Motion

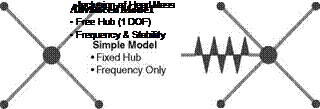
The analysis of a simple model – see Figure 4.33 – can only measure the natural frequencies of the rotor. This is perfectly adequate if the rotor speed values capable of inducing a resonance are required. It cannot give any indication of the damping necessary to suppress any instability. A full 5/6 degree of freedom (DOF) model must be used for the most exacting calculations;

Table 4.1 Ground resonance input parameter values

Parameter

MATLAB variable name

Value

Static rotor lag frequency (rad/s)

wl0

15.22

Fuselage frequency (rad/s)

wy

12

Lag hinge offset (m)

e

1.22

Rotor radius (m)

r

6.4

Blade mass (kg)

bladm

24.80

Number of blades

nblad

4

Fuselage mass (kg)

fusm

500

however, a single degree of freedom model, as shown in Figure 4.33, can provide very useful insight into the manner in which the rotor lag and fuselage frequency and damping values influence the stability of the overall vehicle.

The numerical values of the various parameters are presented in Table 4.1.

From these data the following results are presented.

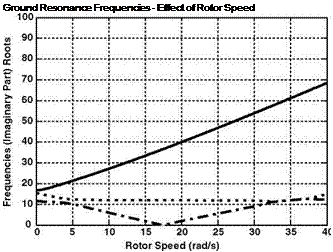
Подпись: Ground Resonance Frequencies - Effect of Rotor Speed

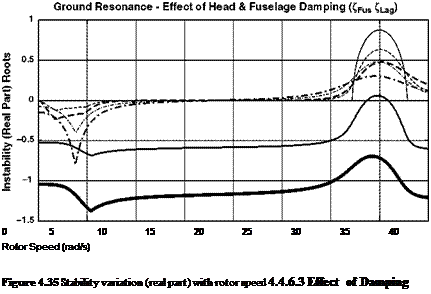
Figure 4.34 shows the frequency variation of the overall system with rotor speed. The shape of the graphs is very similar to those of the simple model. However, there are important differences. Firstly, at the low rotor speed values the graphs show an interesting behaviour in that they seem to exchange characteristics. This is a common situation when two uncoupled systems (in this case the blade lagging and the fuselage motion) are connected. The second, and more important, observation is the two regressing modes in the region of 35rad/s rotor speed. They coalesce, which cannot happen in a simple analysis of frequency only. Consulting Figure 4.35 shows that an undamped system displays instability (positive real part) for this rotor speed range. It is neutrally damped at other rotor speeds.

Подпись: 0 5 10 15 20 25 30 35 40 Rotor Speed (rad/s) Figure 4.35 Stability variation (real part) with rotor speed 4.4.6.3 Effect of Damping
Подпись: — 0 0 — 5 0 — 0 5 — 5 5 -■10 0 -•0 10 — 10 10

There is therefore a potential instability which must be suppressed. This usually is accom­plished by adding damping and, while it is possible to incorporate this damping in several parts of the airframe, in order to fully suppress ground resonance, certain requirements must be met.

To see the effect, a range of damping is applied to the rotor head and the fuselage via the undercarriage.

Figure 4.35 also shows the effect of adding damping to the rotor lag (legend right-hand column) and the fuselage (legend left-hand column). If damping is added to either the rotor or the fuselage while leaving the other undamped, instability remains. If the damping is applied to both rotor and fuselage, then elimination of the instability can be achieved. This result is predicted in Coleman and Feingold [2] where they express this situation thus. If ZFUS is the damping ratio for the fuselage and Crot is that for the rotor then the following condition must apply for stability:

Cfus • Crot > h > 0 (444)

The product of the two damping values must be positive, which cannot be achieved if one is undamped. Therefore damping must be applied evenly, which is not always convenient.

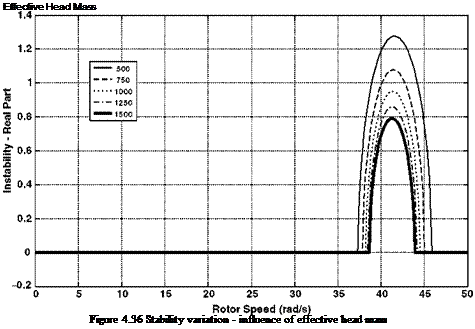
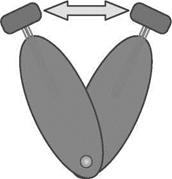
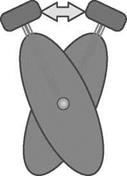
With reference to Figure 4.36, the influence of the rotor head mass can be seen. For the simple model, the rotor head was fixed and, therefore, the fuselage could take no part in the motion and thus was isolated from the rotor. Now the rotor can move laterally, the fuselage is included in the motion, and the effect can be expressed via the effective head mass. The analysis of the system was carried out using an energy-based method. Therefore the fuselage must be included via its kinetic energy. This calls into play the manner in which the fuselage moves. If the fuselage motion is considered to be in roll only, then the motion about the CG will be a combination of sway and roll angle. It will have, therefore, a point about which it is effectively rotating. This point will govern the interaction between the fuselage dynamics and the rotor blade lag motion. Figure 4.36 shows that the lower the value of the effective head mass, the more unstable the ground resonance motion. Figure 4.37 shows two situations where the rotation centre is placed low or high on the fuselage. For a given rotation amount, the low centre gives more head

Подпись: Effective Head Mass Figure 4.36 Stability variation - influence of effective head mass
movement. If the head mass is to reflect the kinetic energy of the complete aircraft then the situation with greater head motion will give rise to a lower value of effective head mass. Also the greater head motion will encourage the interaction between the blade lagging and the motion of the fuselage on its undercarriage. Hence the lower head mass can be expected to give a greater amount of feedback and thus a more unstable condition can be predicted.

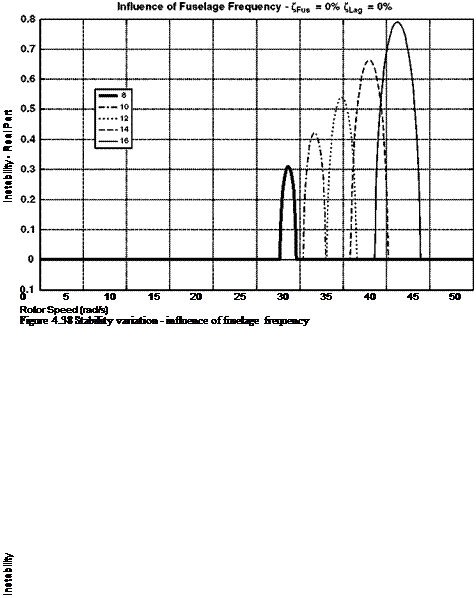
Figure 4.38 shows the effect of fuselage frequency giving more instability for the higher values.

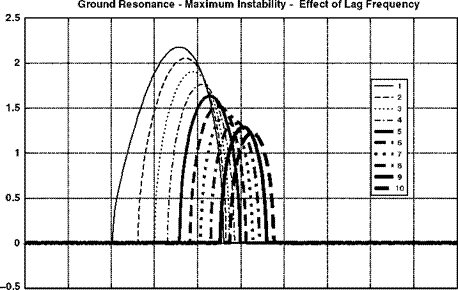
Figure 4.39 shows the effect of blade lag frequency and the higher values of lag stiffness giving the more stable condition. Therefore, a semi-rigid rotor system will require smaller amounts of damping to ensure stability.

Low Rotation Point

Greater Head Movement

High Rotation Point

Smaller Head Movement


0 5 10 15 20 25 30 35 40 45 50

Rotor Speed


0.8

Подпись:Подпись:Подпись:Подпись: 8Подпись:Подпись:Подпись:0.6

0.4

0.2

0

-0.2

1-0.4

-0.6

-0.8

-1

-1.2

0

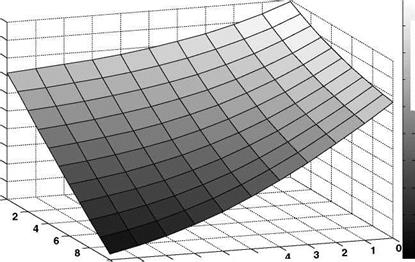
Figure 4.40 is a surface plot showing the effect on the stability of the aircraft for a range of lag and fuselage damping values. The shape of the surface is another illustration of the law defined in Equation 4.14.

Blade Flexibility

The previous discussion has considered the rotor blades as rigid structurally but attached to the rotor hub by free hinges or flexures. In reality, the blades possess flexibility and can distort from the rigid straight shape adopted so far. The very significant tension under which the blades are subjected maintains an essentially straight shape but the complexities of the aerodynamic environment in which the blades operate will trigger elastic bending. How the blades do this is not appropriate for an introductory text. However, the blade natural modes are often used as a basis to define blade flexing and can be considered as separate for flap, lag and torsion (uncoupled modes) or when all three motions occur together (coupled modes). The torsion is of major importance for the KMax and Seasprite helicopters where this bending of the blades is used in rotor control – as previously discussed. The modal behaviour of the blades is closely involved in their design and, in the past, coupling of modes has been avoided. Modern blade development is now using blade modes, with their flap, lag and torsion components to enhance the aerodynamic performance. This use of favourable blade structural characteristics is known as ‘aeroelastic tailoring’.

4.1.2 Ground Resonance

The provision of individual blade lag hinges means that the rotor head will now become more complicated, will require extra maintenance and will add to the weight and drag of the rotor

head assembly. These are readily deduced; however, there is a dynamic implication of the blades moving in a lagwise sense. Firstly that the Coriolis effect connects the blade flapping and lagging motions. This can result in the two types of blade motion coupling together with implications for vibration and mechanical integrity. In addition, it is possible for the motion of the blades in lag to differ from blade to blade. If this should happen then the rotor, including blades, will have a CG which does not lie at the centre of the rotor. This will cause the generation of vibratory forces but also can cause a significant difficulty if the aircraft is sitting on the ground. The undercarriage will have an axial stiffness since it must compress on landing and therefore act as a spring. The stiffness of the undercarriage will allow the airframe itself to be able to vibrate at a frequency determined by the undercarriage stiffness and the appropriate moment of inertia of the airframe itself. We now have the situation of an oscillatory force being generated by the uneven blade lag motion, across the number of blades, acting on a system (the aircraft sitting on its undercarriage) which has its own natural frequencies. This is the classic combination which can result in a resonant condition if the forcing frequency closely approaches a natural frequency. In the case of a helicopter this can result in ground resonance which is a potentially devastating phenomenon and for which all new aircraft types are assessed before flight clearance is given.

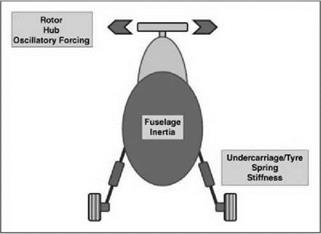
Figure 4.28 shows the basic features governing the natural frequency of the aircraft on the ground and the forcing derived from uneven blade lag motion. Should the forcing frequency at the rotor head be close to the natural frequency of the fuselage rocking on its undercarriage, a resonant condition can occur.

The undercarriage of a helicopter can be of many forms and Figure 4.28 shows an example. The strut consists of a spring and damper, and this is directly connected to the wheel and tyre unit. The latter has spring and damping properties due to the tyre inflation. The spring contributes to the fuselage frequency while the damping is present to suppress any potential ground resonance. The suppression of ground resonance is crucial and will be discussed later in this chapter.

Figure 4.29 Simple model of ground resonance 4.4.6.1 Simple Analysis of the Problem – Rotor Only

The analysis of ground resonance can encompass a wide degree of complexity. The simplest model is to concentrate on the rotor alone and focus on the position of the CG. A further simplification is made where each blade is modelled by a concentrated mass joined to the lag hinge by a weightless rod. This is effectively viewing the individual blade mass centres.

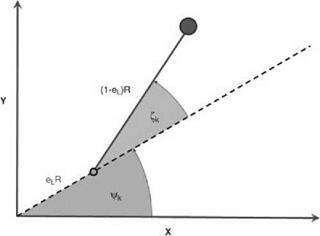
The rotor/blade layout is shown in Figure 4.29.

The figure shows a single blade (of index k) where the rotor head (and the appropriate lag hinge) itself is at an azimuth angle of Ck. The blade itself is placed in a leading (forward lag) position with angle zk.

The blade lag motion is then defined by:

Zk = Cocos IzCk (4-12)

which represents simple harmonic motion (SHM) of maximum amplitude z0 and circular frequency Af, relative to the rotor speed.

Substituting this lag behaviour into the position of the blade masses, the centre of mass of the N blades can be calculated. The analysis is relatively straightforward and produces a result which, if interpreted as a single mass, shows a motion which can be described as tracing the petals of a flower – see Figure 4.30.

While this explains the CG motion, it is not helpful, so rather than the motion of one specific mass, the result can be interpreted as the motion of two equal masses. The values of radial location and circular frequency is shown in the following table:

Mass 1

Mass 2

Mass

mN

mN

Radial location

rgf0 S

2N’S +1

rgf0 S

2N’S-1

Circular frequency

(Af + 1)O

(AC-1)Q

Подпись: (4.13)S = sin[(1z ± 1)p]

±! sin[(1c ± 1)n/N

The variation of the S terms with non-dimensional lag frequency is shown in Figure 4.31. The frequency which is greater than the rotor speed is known as progressive, indicating that the mass is rotating, relative to the rotor, in the direction of rotor rotation. The other is known as regressive since it moves against the rotor direction.

Figure 4.32 shows the result for the case of a normalized lag hinge offset of 0.1. The rotor has four blades and the two masses are circles at 2 and 8 o’clock. The overall rotor CG is the circle in between and, since the two masses are equal, it lies at their mid-point.

Lag Frequency

The blade lag motion is under the influence of centrifugal force – not unlike blade flapping motion; however, the moment arms of these two degrees of freedom are very different (see Figure 4.26).

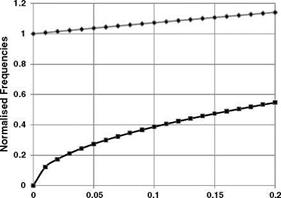
Since the restoring moment arm is considerably smaller for lag motion compared with flap, it is the case that the natural lag frequency is smaller than the flapping frequency for the same hinge offset from the main rotor shaft. The two frequencies (normalized on the rotor speed) are:

where e is the hinge offset normalized on the rotor radius. The variation of these frequencies with hinge offset is shown in Figure 4.27.

Flap

Lag


Normalised Hinge Offset (e)


Figure 4.27 Variation of flap and lag frequencies


The first point to note is that the flapping frequency is always greater than unity with a zero offset giving exactly unity. This allows for a zero flapping hinge offset as seen with a teetering rotor. However, the lag frequency is below unity and equals zero for a zero hinge offset. This means that there must always be an offset for the lag hinge otherwise the rotor will not turn with the shaft. The fact that the lag frequency is less than unity opens the possibility of the helicopter suffering from a phenomenon called ground resonance. The reason for this is explained in section (4.4.6) of this chapter.

Coriolis Acceleration

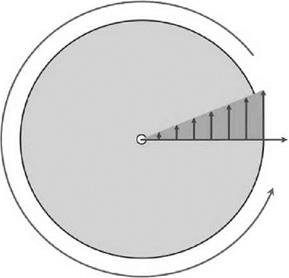
With reference to Figure 4.21, we have a circular disc on which is a radial direction rotating with it. The rotation will impart a velocity in a direction perpendicular to the radial direction (the tangential direction).

This velocity increases as the distance from the disc centre increases, so any point moving along the radial line (and remaining on that line) must acquire this increasing tangential velocity as it moves outwards from the disc centre. Obviously, if the movement is radially inwards towards the disc centre, this tangential velocity must decrease. We therefore have the situation where a rotating system causes a radial movement to acquire a velocity in a tangential direction which changes in magnitude – that is, an acceleration. This is the principle of the Coriolis acceleration.

Now, such acceleration will require the application of an appropriate force in the tangential direction. In many circumstances, such a force is not present and so the motion cannot remain on the line. In fact it will drift off in the opposite direction.

Coriolis can be found in many situations, one of which is the rotating winds found with depressions across the world.

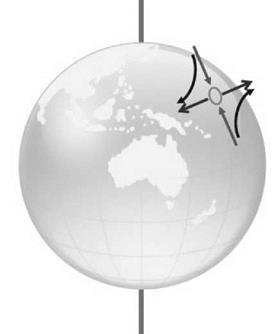
Figure 4.22 shows the Earth with a region of low pressure whereby the air is moving towards it. The low pressure lies in the northern hemisphere and the inward movement of air in the direction towards the North Pole will be moving in towards the axis of the Earth’s rotation. This will be subject to the Coriolis effect and since there is no force, the air will move in an easterly direction. Conversely, a wind moving away from the North Pole will be subject to a movement

Figure 4.21 Rotating system

Figure 4.23 Blade flapping hinge

in a westerly direction. In this way a rotating flow will be generated. This gives the characteristic anticlockwise rotation around a low-pressure region in the northern hemisphere with the opposite rotation direction found in the southern hemisphere.

Figure 4.23 shows the typical flapping motion of a rotor blade. The rotation of the blade about the flapping hinge gives any point of the blade a motion which is radially inwards and outwards, depending on the blade position and its flapping motion. In fact an analysis of this situation shows that the Coriolis effect is proportional to the product of the flapping angle and the flapping rate, that is:

Coriolis / bb (4-10)

The normal condition for a rotor is with the rotor in a coned position upon which flapping oscillations are superimposed. This means that the Coriolis effect will be more pronounced for a rotor with a high coning angle.

It can now be seen that the flapping motion of a rotor blade generates a distribution of Coriolis forces on the blade, along its length, which combine to give an overall moment about an axis parallel to the rotor shaft (see Figure 4.23).

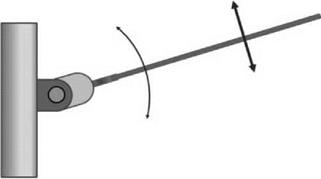
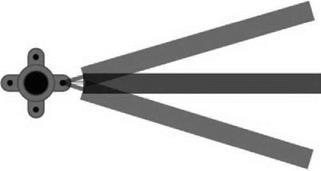
This will place a vibratory moment on the rotor hub structure which must be avoided. This can be achieved by allowing the blade to rotate in the rotor plane itself by installing a suitable hinge mechanism. This blade motion is termed lagging (Figure 4.24) and the instantaneous

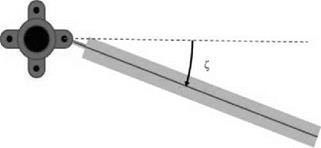
Figure 4.25 Definition of blade lag angle

blade position away from directly outwards is called the lag angle (see Figure 4.25) and is usually given the symbol Z.