Category Basics of Aero – thermodynamics

Summary of the Results of the Chapter in View of Flight-Vehicle Design

Regarding the design of hypersonic vehicles, we note that the approximations and proportionalities derived in the preceding sub-sections imply with regard to the thermal state of the surface in the case of radiation cooling (see also Section 7.3):

— The thermal state of the surface, i. e., the surface (wall) temperature Tw « Tra and the temperature gradient dT/dngw, respectively the heat flux in the gas at the wall qgw, of radiation-cooled surfaces depend on the flight speed vTO, respectively the flight Mach number MTO, and the flight altitude H. They all are functions of the location on the vehicle surface.

— It depends on the flight trajectory of the vehicle and on the structure and materials concept, whether the thermal state of the surface can be

considered as quasi-steady phenomenon or must be treated as unsteady phenomenon.

— The efficiency of radiation cooling increases with decreasing flight unit Reynolds number, and hence increasing boundary layer thickness, because qgw decreases with increasing boundary-layer thickness. In general radia­tion cooling becomes more efficient with increasing flight altitude.

— The radiation-adiabatic temperature—in contrast to the adiabatic tempe­rature—changes appreciably in main-flow direction (e. g., along the air­frame). It decreases strongly with laminar, and less strongly with turbulent flow, according to the growth of the related characteristic boundary-layer thicknesses. These are for laminar flow the boundary-layer thickness, and for turbulent flow the thickness of the viscous sub-layer [18].

— The radiation-adiabatic temperature is significantly lower than the adi­abatic temperature. The actual wall temperature in general is near the radiation-adiabatic temperature, depending somewhat on the structure and materials concept, and the actual trajectory part. Therefore the radiation-adiabatic temperature must be taken as wall temperature es­timate in vehicle design rather than the adiabatic or any other mean tem­perature. On low trajectory segments possibly a thermal reversal must be taken in account.

— The state of the boundary layer, laminar or turbulent, affects much stronger the radiation-adiabatic temperature than the adiabatic temperature.

— The turbulent skin-friction is much higher on radiation-cooled surfaces than on adiabatic surfaces (in general it is the higher the colder the surface is), the laminar skin friction is not as strongly affected by the surface temperature.

— At flight vehicles at angle of attack significant differentials of the wall temperature occur between windward side and leeward side, according to the different boundary-layer thicknesses there.

— At attachment lines radiation cooling leads to hot-spot situations (attach­ment-line heating), at separation lines the opposite is observed (cold-spot situations) [18].

1.4 Problems

Problem 3.1. Find from eq. (3.2) with the assumption of perfect gas the total temperature Tt as function of TTO, 7, MTO.

Problem 3.2. An infinitely thin flat plate as highly simplified vehicle flies with zero angle of attack with v= 1 km/s at 30 km altitude. Determine the total temperature Tt, and the recovery temperatures Tr for laminar and turbulent boundary-layer flow. Take 7 =1.4 and the Prandtl number Pr at 600 K, Sub-Section 4.2.3.

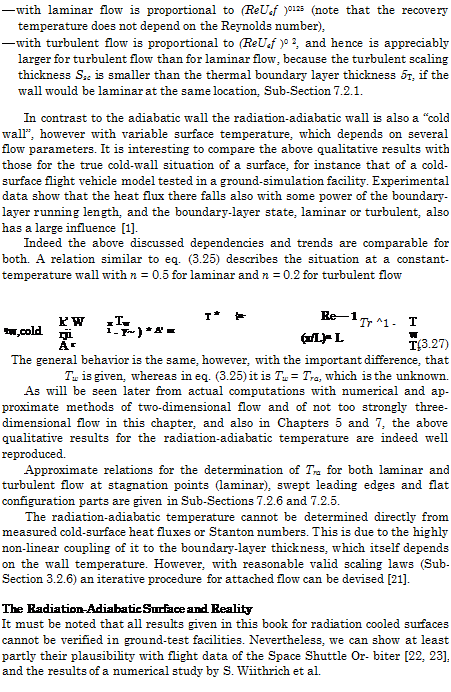
Problem 3.3. Check for laminar flow the behavior of Tw(x/L) = Tra(x/L) at Mж = 15.7 in Fig. 3.3.

Problem 3.4. Check for turbulent flow with n = 0.2 (exponent in the re­lation for the turbulent scaling thickness, Sub-Section 7.2.1) the behavior of Tw(x/L) = Tra(x/L) at Мж = 5.22 in Fig. 3.3.

Problem 3.5. If at 60.56 km altitude, Fig. 3.3, the Space Shuttle Orbiter would fly at Мж = 17, what would the wall temperature approximately be at x/L = 0.5?

Problem 3.6. If at 60.56 km altitude, Fig. 3.3, the Space Shuttle Orbiter would fly at Мж = 14, what would the wall temperature approximately be at x/L = 0.5?

Problem 3.7. Treat problems 3.5 and 3.6 by using the scaling law eq. (3.34). For high Mach numbers the recovery temperature approximately has the proportionality Tt ж M2. What is approximately the proportionality of the radiation-adiabatic temperature? Determine with the scaling law the ratios Tra, M^=i7/Tra, M^=i5.7 and Tra, Mxl=u/Tra, Mxl=i5.7. How is the agreement with the numbers found in the problems 3.5 and 3.6?

Problem 3.8. Show that at low altitudes radiation cooling looses its efficiency.

The Computed Radiation-Adiabatic Temperature Field

We discuss now only the Navier-Stokes solution for the larger wing with L = 14 m. Fig. 3.21 gives an overview of the results on the lower and the upper surface. On the left-hand sides of the figure the radiation heat flux (qrad) distributions are shown, and on the right-hand sides the radiation-adiabatic temperature (Tra) distributions. Unfortunately the color scales are not the same in the two parts a) and b) of the picture. For quantitative data at the two locations x/L = 0.14 and x/L = 0.99 see Fig. 3.24.

We concentrate on the distributions of the radiation-adiabatic tempera­tures on the right-hand sides. Part a) of Fig. 3.21 shows on the lower side of the wing the almost parallel flow between the primary attachment lines. The radiation adiabatic temperature reduces in downstream direction as ex­pected. On the larger portion of the lower side it lies around 800 K (see also Fig. 3.22). Along the primary attachment line attachment-line heating en­sues with a nearly constant temperature of approximately 1,100 K. This is a hot-spot situation.

On the upper side, part b), along the leading edge we also see a nearly constant temperature of about 1,050 K. This high temperature is due to the small boundary-layer thickness, which is a result of the strong expansion of the flow around the leading edge. At the primary separation line the tem­perature drops fast and a real cold-spot situation develops. The secondary attachment line seems to taper off at about 40 per cent body length. Possi­bly a tertiary vortex would develop, if the wing length would be increased (non-conical behavior). At the secondary separation line again a cold-spot situation, however weaker than that at the primary separation line, devel­ops. The tertiary attachment line shows the expected attachment-line heat­ing with an almost constant temperature of approximately 650 K along the upper symmetry line.

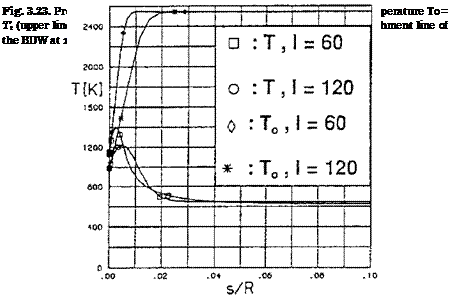
Fig. 3.22 displays the temperature distribution along the upper and the lower symmetry line of the wing. Note that the abscissa is given with the computation-grid parameter i. The inset shows its correspondence to x/L. The temperature at the windward side is typically higher than that at the leeward side. We will come back to this temperature differential. The kink in the windward-side curve at i « 26 seems to be due to the curvature jump of the surface there (see Fig. 3.15). In the leeward-side curve the effect is not visible. The temperature at the leeward-side symmetry line is almost

Подпись: Heat flux < kJ/(e*m**2)> Teroperatur < К > Fig. 3.21. Computed skin-friction lines, and distributions of the surface radiation heat flux qrad (left) and the radiation-adiabatic surface temperature Tra (right) at a) the lower (windward) side, and b) the upper (leeward) side of the BDW [34].
constant with approximately 650 K. At the windward side we find only very approximately the flat-plate behavior suggested by eq. (3.20), i. e., the drop of Ta ж (x/L)-0-5. This is due to the up to x/L « 0.34 first slightly convergent and then divergent skin-friction line pattern at the windward symmetry line, Fig. 3.16.

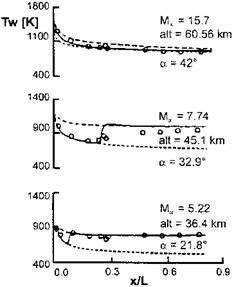
A look at the temperature profiles of the primary attachment line in di­rection nearly normal to the surface at x/L = 0.14 and 0.99 shows very steep gradients of both the static temperature (T)—dT/dngw—and the to­tal temperature (Tt)—dTt/dngw—, Fig. 3.23. The total temperature of the

The Computed Radiation-Adiabatic Temperature Field

Fig. 3.22. Computed distribution of the radiation-adiabatic surface temperature Tra at the windward (A) and the leeward (*) symmetry line of the BDW (I is the surface parameter) [34].

free-stream is Tt = 2,542.35 K. The curves for the total temperature indicate a thicker boundary layer at the aft location. The curves for the static tem­perature seem to indicate a thinner boundary layer there. Fig. 3.16 shows more or less an infinite-swept wing situation at the primary attachment lines (the leading-edge radius is constant).

The contradictory data may be due to the fact, that the data are taken from a coordinate line, which is not a locally monoclinic line [18]. In any case the behavior of the static temperature near to the wall supports the assump­tion made in eq. (3.15) regarding the appropriate characteristic length of the laminar boundary layer (A = St) for the analysis of the radiation-adiabatic temperature. However, since no computation was made with an adiabatic wall, no information is available about the recovery temperature at the at­tachment line. Eq. (3.7) for the recovery temperature is approximately valid only for flat surfaces. At attachment and separation lines strong departures can be observed from the data found with that equation [18], so that it is only of restricted value here.

In Fig. 3.24 we present results of a scaling of the distribution of the radiation-adiabatic temperature at the two locations x/L = 0.14 and 0.99.

For the purpose of scaling a Navier-Stokes solution was made also for the wing with a length L = 4.67 m. All other parameters were the same, so that the scaling relation (3.33) can be reduced, with n = 0.5, and Tri = Tr2, to

1

The Computed Radiation-Adiabatic Temperature Field

Tral

Tra2

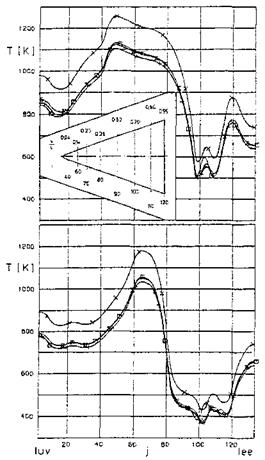
The results in Fig. 3.24 are given in the computation-grid parameter space j, Fig. 3.15. At the left side of the abscissa (“luv”) we are on the lower symmetry line (windward side) (j = 2), at j = 70 at the leading edge, and at the right hand side (“lee”) on the upper symmetry line (leeward side) (j = 134).

The general pattern of the temperature distributions is discussed in the following, while taking into account also the patterns of the skin-friction lines in Figs. 3.16 to 3.18. At the lower symmetry line lies a weak relative maximum, followed by a plateau, which has a large width at x/L = 0.99, and a small one at x/L = 0.14. The smallness of the latter is due to the fact, that the primary attachment line lies at a constant distance from the leading edge. This is also the reason, why the temperature maximum (attachment­line heating) on it lies at approximately j = 48 and in the aft location x/L = 0.99 at j = 65.

At the leeward side again we have a small plateau at the first location and a wide one at the second. Around j = 100 we see the cold-spot situation at the primary separation line, followed by the hot-spot situation at the secondary attachment line. This attachment line lies in the forward location at j « 105

The Computed Radiation-Adiabatic Temperature Field

Fig. 3.24. Scaling of radiation-adiabatic surface temperatures at x/L = 0.14 (upper part of the figure) and x/L = 0.99 (lower part of the figure) of the BDW [34]. x: numerical solution for L = 4.67 m, □: numerical solution for L = 14 m, V: result of scaling with eq. (3.42), +: results of scaling with modified eq. (3.42). Lower symmetry line: j = 2, leading edge: j = 70, upper symmetry line: j = 134.

and in the aft location at j « 110. The cold-spot situation in the secondary separation line follows at j « 110 at the forward location, and in the aft location, despite its off-tapering, at j « 117. At the second location the hot­spot situation at the tertiary attachment line in the leeward-side symmetry line is well discernible. In the first location a hot-spot situation lies at j = 120 with a temperature distinctly higher than that in the symmetry line.

The reason for that is not fully clear. In Fig. 3.21 (and also in Fig. 3.18) we see that the skin-friction lines in that region bend very strongly out of the tertiary attachment line. Also a local maximum is discernible in the radiation heat flux parallel and close to the symmetry line. A cross-flow shock in that area, if it is sufficiently oblique, see Section 6.6, would lead to a thinning of the boundary layer downstream of it. Most probably this is the cause for the phenomenon, since the temperature level in the symmetry line there is already that found at x/L = 0.99.

The scaling with eq. (3.42) for design purposes would give very good results. Almost all phenomena are at least qualitatively and quantitatively well reproduced. At the leeward side small differences can be seen regarding the location and the magnitude of the cold – and hot-spot situations.

From the qualitative results given in Section 3.2.1 it can be deduced that at a radiation-cooled flight vehicle the radiation-adiabatic surface temper­ature is higher on the windward side than on the leeward side, which is supported by the computed data shown in Figs. 3.22 and 3.24. This tem­perature differential is due to the fact that the boundary layer thickness is smaller on the lower and larger on the upper side of the vehicle.

We demonstrate this with data for an infinitely thin flat plate at angle of attack. For M= 7.15 and a = 15° the ratio of the (constant) unit Reynolds numbers at the leeward (l) side and the windward (w) side is Ref /Reff ~ 0.09. This amounts to a ratio of the boundary-layer thicknesses, without taking into account the surface temperature, of 5i/5W « 3.33. Using the scaling relation (3.35) we find a ratio of the temperatures of the leeward side and the windward side Tra, l/Tra, w « 0.74. Of course we must be careful with a comparison because of the hot – and cold-spot situations at the upper side of the BDW. Nevertheless, when comparing this ratio with the ratio of the computed data at the two stations of the BDW, x/L = 0.14 and x/L = 0.99, or with the ratio of the computed data in Fig. 3.22, we see that this result illustrates fairly well the temperature differentials, which we find on hypersonic vehicles flying at angle of attack.

Topology of the Computed Skin-Friction and Velocity Fields

Before we discuss the computed radiation-adiabatic temperature fields, we need to have a look at the topology of the computed skin-friction field. We do this in order to identify in particular attachment and separation lines, where we expect hot-spot, and cold-spot situations, respectively, Sub-Section 3.2.4. Discussed are the results for the large wing with L = 14 m. The skin – friction line topology at the smaller wing is very similar.

Take first a look at the windward side of the configuration. In Fig. 3.16 we see the classical skin-friction line pattern at the lower side of a delta wing. Because the lower side of the BDW is only approximately flat, the flow

Topology of the Computed Skin-Friction and Velocity Fields

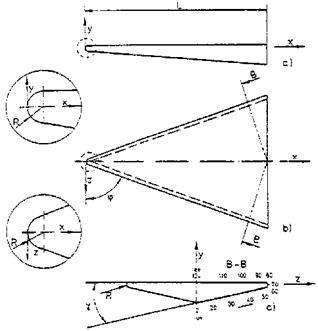
Fig. 3.15. Configuration of the BDW and the employed notation [34].

exhibits a slight three-dimensionality between the two primary attachment lines. These lines themselves are marked by strongly divergent skin-friction lines. The stagnation point, which topologically is a singular point, in this case a nodal point, see, e. g., [18], lies also on the lower side, at about 3 per cent body length. The primary attachment lines are parallel to the leading edges almost from the beginning, i. e., they do not show a conical pattern.

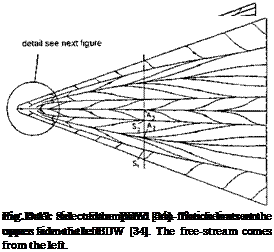
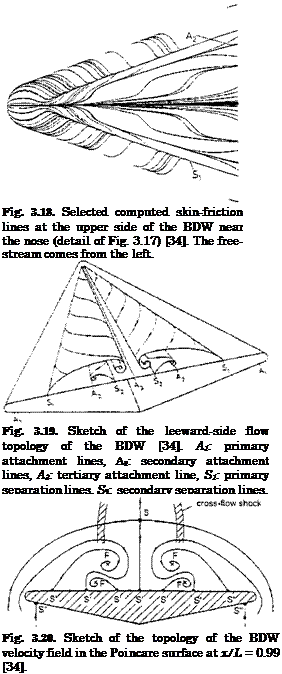
The situation is quite different at the leeward side of the wing, Fig. 3.17. Here we see on the left-hand side (from the leading edge towards the sym­metry line) a succession of separation and attachment lines: the primary separation line Si, the secondary attachment line A2, a secondary separation line S2, and a tertiary attachment line A3. All is mirrored on the right-hand side of the wing. Again a conical pattern is not discernible, except for a small portion near to the nose. However, the secondary separation lines are almost parallel to the single tertiary attachment line along the upper symmetry line of the wing.

Both the primary and the secondary separation are of the type “open separation”, i. e., the separation line does not begin in a singular point on the surface, as was shown first by K. C. Wang [37]. Fig. 3.18 shows this for the primary separation line.

With these surface patterns we can attempt to construct qualitatively the structure of the leeward-side flow field, Fig. 3.19. By marking the points,

Topology of the Computed Skin-Friction and Velocity Fields
where the streamlines of the vortex-feeding layers penetrate a surface normal to the x-axis, one finds the Poincare surface [38], Fig. 3.20. The computed cross-flow shocks are indicated.

Подпись: FN+-FN' Подпись: -(ES'+^Es" + TEs" Подпись: -1, Подпись: (3.41)

In Fig. 3.20 the attachment and separation lines are marked as “half­saddles (S’)” (note that the primary attachment lines are “quarter-saddles (S’")”, because the flow between them is (more or less) two-dimensional. The axes of the primary and the secondary vortices are marked as “focal (F)” points, which are counted as “nodal (N)” points. Finally a “saddle (S)” point is indicated above the wing. This pattern obeys the topological rule (see [18])

and therefore is a valid topology.

Topology of the Computed Skin-Friction and Velocity Fields

Topology of the Computed Skin-Friction and Velocity Fields

Note in particular that at all attachment lines not only the characteris­tic thickness A is small, but that also the attaching streamlines come from the outer inviscid flow and hence carry the original free-stream total en­thalpy. This is in contrast to, for instance, (steady) two-dimensional separa­tion, where the attaching separation layer does not carry the original total enthalpy, if the boundary layer ahead of the separation point is radiation or otherwise cooled.

Configuration and Computation Cases

S. Riedelbauch [34] (see also [35]) studied the aerothermodynamic properties of hypersonic flow past the radiation-cooled surface of a generic configuration (Blunt Delta Wing (BDW) [36]). The configuration is a simple slender delta wing with a blunt nose, Fig. 3.15. Navier-Stokes solutions for perfect gas were performed for flight with the conditions given in Table 3.5.

Table 3.5. Flight parameters of the Blunt Delta Wing [34].

Case

Moo

H [km]

Too [K]

Ac A [1/m]

L [m]

Є

a [°]

1

7.15

30

226.506

2.69-106

14

0.85

15

2

7.15

30

226.506

2.69-106

4.67

0.85

15

Laminar flow was assumed. A surface emissivity coefficient є = 0.85 was chosen. The computations were made with an angle of attack a = 15° for two wing lengths L = 14 m and L = 4.67 m.

Case Study: The Thermal State of the Surface of the Blunt Delta Wing

In this case study we check the qualitative results about the radiation – adiabatic temperature, which we found so far in this chapter, and also the scaling law for laminar flow, by investigating the Navier-Stokes data com­puted for a generic configuration, the Blunt Delta Wing. This configuration is a very strongly simplified RV configuration flying at moderate angle of attack with fully laminar flow. A similar check is made in Sub-Section 7.3 with data computed for a CAV flying at low angle of attack, with laminar and turbulent flow portions.

Some Parametric Considerations of the Radiation-Adiabatic Temperature

We consider finally some general properties of the radiation-adiabatic tem­perature. This done in a very generic way. Neither configurational nor high – temperature real-gas effects are taken into account.

We take eq. (3.25), set for convenience T’2Щ-1 = 1, assume Tra ^ Tr, and write it for Tra in terms only of the emissivity coefficient є, the unit Reynolds number Reu, and the recovery temperature Tr

Tra = C є-0-25^еи)0-25(1-п) T025, (3.36)

with n = 0.5 for laminar flow, and n = 0.2 for turbulent flow.

Assuming further large flight Mach numbers M, we arrive at

Tra = C є-0-25 (Reu)0-25(1-M M0-5. (3.37)

The total differential of Tra has the following terms:

-0.25 Єє-1’25 (Reu)0’25(1-n) M0’5,

Єє-0’25 0.25 (1 – n) (Reu)-(0’75+0’25n) M0’5,

C є-0’25 (Reu)0’25(1-п) 0.5 M-0’5

Some Parametric Considerations of the Radiation-Adiabatic Temperature

For the discussion of these terms we generate a few quantitative data. We chose the trajectory points H = 60.56 km (point 1, laminar flow) and H = 36.4 km (point 2, turbulent flow) from Fig. 3.3 and consider the location x/L = 0.5 on the lower symmetry line, Table 3.4.

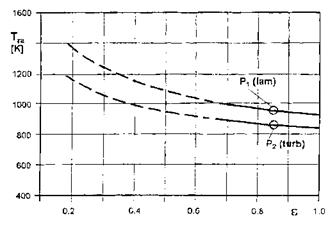
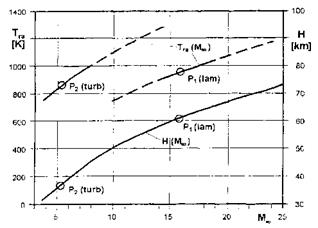
For the two points the respective constants C are determined (note that they have a secondary influence on the slopes of the curves) and the functions Tra of є, Fig. 3.12, ReZ^, Fig. 3.13, and MTO, Fig. 3.14 are found. They are valid in the vicinity of the two points (full lines in the figures). Away from the points they indicate only the trend (broken lines).

We obtain the following results:

Table 3.4. Selected flight parameters (Fig. 3.3) of the Space Shuttle Orbiter [22, 23].

Point

Moo

H [km]

Relo [1/m]

Too [K]

Tra [K] at = 0.5

Boundary layer

1

15.7

60.56

7.64-104

253

960

laminar

2

5.22

36.4

7.99-105

222

860

turbulent

— Tra depends inversely on є0-25 and hence decreases with increasing є, Fig. 3.12, for both laminar (high altitude) and turbulent (low altitude) flow.

Some Parametric Considerations of the Radiation-Adiabatic Temperature

Fig. 3.12. Parametric considerations: Tra at x/L = 0.5 along the lower symmetry line of the Space Shuttle Orbiter as function of the emissivity coefficient є around point 1 (laminar flow) and point 2 (turbulent flow) (see Table 3.4). Full lines: range of validity of the approximation, broken lines: trend extrapolation.

The gradient дТга/дє also decreases with increasing є, eq. (3.38). At large є we find the important result (be careful with the generalization of this result!) that Tra becomes insensitive to changes of є. At є = 0.85 т 0.05, for instance, we find only ATra 10 K at both trajectory points.

— The dependence of Tra on ReU is more complex. Tra increases in any case strongly with increasing Re^, Fig. 3.13, and slightly stronger for turbulent than for laminar flow, reflecting the dependence of the respective charac­teristic boundary-layer thicknesses on the Reynolds number. The gradient dTra/dReu decreases with increasing Reu, eq. (3.39), stronger for laminar than for turbulent flow (note that in Fig. 3.13 not the true dependence on Reu but on Reu(H) is given).

— With increasing M^ we get the expected growth of Tra, Fig. 3.13. The gradient dTra/dM decreases with increasing M, eq. (3.40). The different

Some Parametric Considerations of the Radiation-Adiabatic Temperature

Fig. 3.13. Parametric considerations: Tra at x/L = 0.5 along the lower symmetry line of the Space Shuttle Orbiter as function of the unit Reynolds number Re^ around point 1 (laminar flow) and point 2 (turbulent flow) (see Table 3.4). Full lines: range of validity of the approximation, broken lines: trend extrapolation, H(Reж) is exact.

slopes of the curves are due to the different magnitudes of the constant C in point 1 and 2 (note that in Fig. 3.14 Tra is given as a function of M(H) and not of M).

Some Parametric Considerations of the Radiation-Adiabatic Temperature

Fig. 3.14. Parametric considerations: Tra at x/L = 0.5 on the lower symmetry line of the Space Shuttle Orbiter as function of the Mach number Мж around point 1 (laminar flow) and point 2 (turbulent flow) (see Table 3.4). Full lines: range of validity of the approximation, broken lines: trend extrapolation, H(Мж) is exact.

Scaling of the Radiation-Adiabatic Temperature

The radiation-adiabatic temperature is, in contrast to the recovery tempera­ture, Reynolds number and scale dependent, Sub-Section 3.2.1. Therefore, data from different cases, even with the same total enthalpy, cannot di­rectly be compared. The radiation-adiabatic wall temperature on a small body (wind-tunnel model) would be much larger than that on a large one (real configuration), if all flow parameters are the same. This makes a full simulation in an hypothetical ideal wind tunnel impossible. This holds also for an experimental or demonstrator vehicle, which could be a scaled-down version of the reference concept.

If in design work an input about the distribution of the radiation-adiabatic temperature is quickly needed, a scaling of it from another, already computed case, can be made. Precondition is that the flow topology qualitatively and quantitatively is the same in both cases (geometrical affinity, the same angles of attack and yaw), that it is not too strongly three-dimensional, and that (high-temperature) real-gas effects are similar. In addition, the assumption must be made that the recovery temperature Tr is constant over the entire vehicle surface (flat-plate behavior), although different for laminar and tur­bulent flow portions. This assumption, however, may be violated to a certain extent in reality, but without posing a serious restriction for the use of the following scaling laws.

Подпись: Tral Tra2 Scaling of the Radiation-Adiabatic Temperature Подпись: Tral/Trl) Tral/Trl) Подпись: 1 4 Подпись: (3.33)

If the two different cases 1 and 2 are considered, we obtain with eq. (3.25)

which does not depend on x/L, i. e., it holds for every point on the surface, if Tr if sufficiently constant. Of course the respective portions on the vehicle surface with laminar flow (scaling with n = 0.5) and with turbulent flow (scaling with n = 0.2) must be the same in case 1 and 2. If the flow is fully laminar (RV’s above 40-60 km altitude) this is no problem. At the flight of a vehicle of either vehicle class below that altitude, one must be aware that this should hold at least approximately. If that is not the case, one has to make sure that is does not seriously curtail the result.

1 (ДеГЄ/,ь)і~П L2 Trl

1 {Reref, L)l2 11 ^1 Tr2

Подпись: Tral Tra2 Scaling of the Radiation-Adiabatic Temperature Подпись: 1 4 Подпись: (3.34)

If Tra is small compared to Tr in both cases, eq. (3.33) can be reduced to

Eq. (3.33) can be written in terms of the unit Reynolds number Reu =

pre fvref /M ref •

re/)l " L72 Tr 1 (1 — Tra/Tri)

Scaling of the Radiation-Adiabatic Temperature
Подпись: (3.35)

With the formulations given in Sub-Section 7.2.6 scaling relations can be derived also for stagnation point regions and attachment lines. All relations permit a wide range of parameters to be covered in the scaling process. All can be further reduced like above for unit Reynolds numbers etc.

The parameter variation range of a scaling law of this kind unfortunately cannot be firmly established from first principles. In design work it must be established for each given case before application.

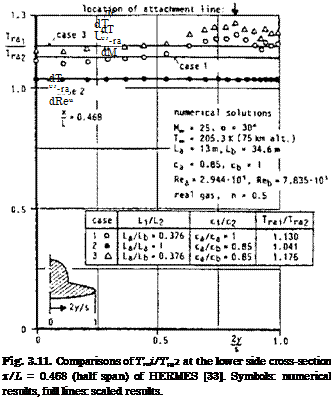
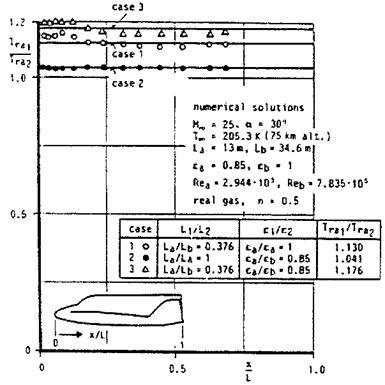
Figs. 3.10 and 3.11 demonstrate scaling—with a slightly modified eq. (3.34)—for the windward side of the HERMES configuration with laminar flow. Three cases were studied [33]. The numerical results were obtained with the coupled Euler/second-order boundary-layer method described in [14]. The flight conditions are given in Table 3.3.

Table 3.3. Flight parameters for the scaling of the radiation-adiabatic temperature at HERMES [33].

H [km]

ТА [K]

Reto [1/m]

a [°]

Boundary layer

25

75

205.3

0.2265-105

30

laminar

Case 1 scales the radiation-adiabatic temperature of HERMES with the original length La = 13 m with that of a HERMES configuration enlarged linearly to Lb = 34.6 m, the length of the Space Shuttle Orbiter. In case 2 a scaling is made on the original HERMES configuration for two different emissivity coefficients ea = 0.85 and eb = 1. In case 3 finally case 1 and case 2 are combined.

Fig. 3.10 shows at the windward side a rather good scaling with somewhat larger deviations in the nose region. There, of course, the simple flat-plate relation eq. (3.25) is only approximately valid. The expected very good scaling for case 2 shows slight deviations in the nose region, which are probably due to the non-linear coupling between the boundary-layer thickness and the radiation-adiabatic temperature.

The scalings in Fig. 3.11 for the lower side cross-section at x/L = 0.468 show larger deviations in the vicinity of the leading edge. Here, at the attach­ment line, which lies well at the lower side of the configuration, the original assumption in the scaling laws of a flat-plate boundary layer introduces larger errors. At an attachment line the flow is highly three-dimensional [18], which will be shown in the case study in Section 3.3.

Scaling of the Radiation-Adiabatic Temperature

Fig. 3.10. Comparisons of Trai/Tra2 at the lower symmetry line of HERMES [33]. Symbols: numerical results, full lines: scaled results.

Non-convex Effects

Up to now radiation cooling on completely convex surfaces was considered.

On real configurations surfaces may at least partly face at each other, which reduces the radiation-cooling effect: the surfaces receive radiation from each other and therefore the cooling effect is partly canceled. We call this a “non­convex effect”. Such effect happens at wing roots, fin roots, between fuselage and winglet etc. In the extreme, in an inlet, in a combustor, but also in a gap of a control surface no radiation cooling is possible at all [2]. However, radiative energy transport may nevertheless play a role in such cases [16].

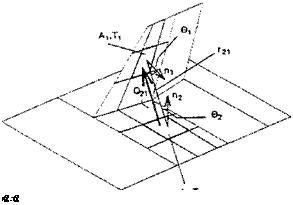
We treat now the reduction of the radiation cooling effect due to non­convex effects following the approach of R. K. Hold and L. Fornasier [29, 30]. It is important to understand that the situation at radiation-cooled aerothermo – dynamic surfaces is different from that at surfaces of, for instance, satellites. Here the (characteristic) thicknesses of the boundary layers of the involved surfaces, which themselves depend to a large extent on their wall tempera­tures, introduce a strong non-linear coupling. This coupling does not exist at satellites. There the heat is simply exchanged without any couplings to flow properties. Nevertheless, the descriptive problems are the same (heat balances, sight lines between surface elements).

Подпись: A2.T2

Consider the situation in Fig. 3.7.

Подпись:The rate of energy Q2 radiated from A2 and acting on Ai is [29]

(3.28)

The surface element Ai absorbs the heat flux

<Zi, ab = -£%. (3.29)

Ai

Note that the absorption coefficient is equal to the emissivity coefficient— Kirchhoff’s law—when radiation is in equilibrium with the surface [17]. This is the case with the radiation-adiabatic surface. The actual flight situation, with a finite, but generally small, heat flux qw into the wall, can be considered as a quasi-equilibrium situation.

With the heat flux emitted from A1

qi, em = svTl, (3.30)

a balance can be made for A1:

Aqi = qi, em + qi, ab = є (vT? – ■ (3-31)

Подпись: єї Подпись: Aqi aTf Подпись: (3.32)

If we treat this equation in analogy to the Stefan-Boltzmann law, a “fic­titious” emissivity coefficient £f can be defined,[24] which in a computation method simply replaces the surface emissivity coefficient є in the radiation wall-boundary condition [29]:

This is the basic formulation of the problem. In [30] it is shown, that actually diffuse reflection must be regarded too in order to get results with high accuracy.

To apply the fictitious emissivity coefficient method with or without dif­fuse reflection, an influence matrix for the whole discretized configuration is to be computed, taking into account the sight lines between the individual surface elements. Because of the coupling of the radiation cooling effect to the boundary-layer thickness (see the discussion above), the fictitious emissivity coefficient must be determined iteratively.

This can easily be done during time-dependent integrations of the Navier – Stokes/RANS equations. With approximate methods or boundary-layer methods, special iteration approaches are necessary. The authors of [29] have devised a General Thermal Radiation (GETHRA) module, which can be in­corporated into any computation scheme. It regards the mentioned diffuse reflection and also “third part” reflections, which may be important in half­cavity situations, like, for instance, the front part of an inlet.

The fictitious emissivity approach is valid for external flow-field applica­tions and high surface-material emissivity coefficients, but can also be em­ployed in computation methods for rocket nozzle flows, TPS gap flows, etc. [3]. It has the advantage that it gives a vivid picture of non-convex effects and not only the plain result. For internal radiation problems, for instance

in combustors, less simplified methods, like the Poljak method etc., see, e. g., [31], should be applied.

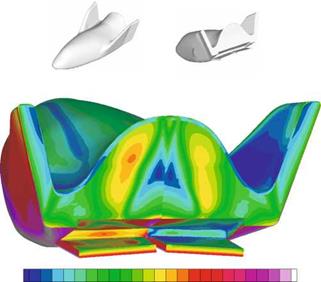
In the following figures we show the computed (Navier-Stokes/RANS equations) distribution of the fictitious emissivity coefficient at a generic sta­bilizer configuration, Fig. 3.7, [30], and the temperature distribution at the afterbody of the X-38 with and without non-convex effects regarded in the computation method [32].[25] The flight parameters are given in Table 3.2, the GETHRA module was employed for both cases.

Table 3.2. Flight parameters for the illustration of non-convex effects.

Case

Moo

H [km]

ReL

L [m]

a [°]

є

Boundary layer

Ref.

Generic config.

7

27

4.3-Ю7

7

-5

0.85

laminar

[30]

X-38

15

54.1

1.52-10®

8.41

40

0.80

turbulent

[32]

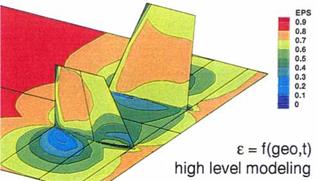
The generic stabilizer configuration has a negative angle of attack in order to generate a bow shock, which does not interfere with the fins. The flow field was computed with a Navier-Stokes method with perfect-gas assumption. Fig. 3.8 shows that due to non-convex effects a reduction of the effective emissivity occurs in particular in the fin-root regions down to £f ~ 0.1. Consequently the radiation-adiabatic temperature (not shown) rises in such regions up to 1,500 K, compared to about 800 K ahead of the fins, where the non-convex effects diminish rapidly.

Non-convex Effects

Fig. 3.8. Non-convex effects: distribution of the fictitious emissivity coefficient £f with high-level modeling at a generic stabilizer configuration [30].

At the X-38 we see a dramatic influence of non-convex effects in the half­cavity which is formed by the upper side of the body flap and the lower side of the fuselage, but also between the winglets and the fuselage, Fig. 3.9. In the half-cavity the fictitious emission coefficient goes down to £f « 0.05 (not shown). Similar low values are reached, although only on small patches, also at the winglets roots. The maximum temperatures in the half-cavity are around 1,200 K, if non-convex effects are regarded and only around 500 K, if they are not regarded. Between the winglets and the fuselage an average rise of approximately 100 K is observed, if non-convex effects are taken into account.

The forces and moments are not affected, which was to be expected be­cause the X-38 as a RV is compressibility-effects dominated, Table 1.1. The situation is quite different in this regard at a CAV, see Fig. 7.11 in Section 7.3.

Non-convex Effects

Twall: 350 450 550 650 750 850 950 1050 1150 1250 1350 1450

Fig. 3.9. Non-convex effects: distribution of the radiation-adiabatic temperature Tra with high-level modeling at the afterbody of the X-38 [32]. Left side with, right side without non-convex effects taken into account.

These examples show that it is very important in hypersonic vehicle de­sign to monitor, and to quantify if necessary, non-convex effects, at least in order to arrive at accurate predictions of thermal loads. However, because thermal-surface effects influence, for instance, the viscous drag, Section 7.1, and other wall-near flow phenomena, they also must be considered in view of
vehicle aerodynamics, in particular regarding CAV’s but also ARV’s in their airbreathing flight mode.

Qualitative Behavior of the Radiation-Adiabatic Temperature on Real Configurations

In the design of hypersonic flight vehicles the qualitative behavior of the radiation-adiabatic temperature on more or less flat surface portions is not the only interesting aspect. The behavior at the vehicle nose and at the lead­ing edges is of particular interest, because on the one hand the boundary layer is very thin in the stagnation-point region and along attachment lines,
and on the other hand nose and leading-edge radii, and leading-edge sweep govern the wave drag of a vehicle.[21]

We consider only the proportionality T/a ж 1/5, and that the boundary – layer thickness 5 is inversely proportional to the square root of the flow ac­celeration (5 ос 1 / pdue/dx, x along the respective surface), Sub-Section 7.2.2. The acceleration due/dx in turn is inversely proportional to the nose or leading-edge radius R, Sub-Section 6.7.2. These observations approximately give the general trends shown in Table 3.1.

Table 3.1. Qualitative dependency of T/a on nose radius R and leading-edge sweep у (у = 0: non-swept case (cylinder)).

Item

8

rp4

-L ra

Spherical nose (spherical stagnation point)

ж s/~R

ж і/OR

Cylinder (two-dimensional stagnation point)

ж s/~R

ж 1/ s/~R

Swept leading edge (laminar), swept cylinder

OC у/r/ л/COS if

їх ^/cos ip/ Or

Not surprisingly the fourth power of the radiation-adiabatic temperature is, like the cold-wall heat flux, inversely proportional to the square root of the nose radius [9], and decreases at a leading edge with increasing sweep. Thick boundary layers, which occur at stagnation areas with large radii, and at leading edges with large sweep (and large radius), lead to large efficiency of surface radiation cooling. This is, with regard to thermal loads, the phe­nomenon, which leads to the blunt shapes of RV’s.

The result for swept leading edges needs a closer inspection. Actually it reflects the behavior of the attachment-line boundary layer. Accordingly it must be generalized, because primary attachment lines move at slender configurations with increasing angle of attack away from the leading edge towards the lower (windward) side of the configuration.[22] Secondary and even tertiary attachment lines occur at the leeward side of a configuration at large angle of attack, together with separation lines [18].

What happens at such lines? At an attachment line, due to the diverging flow pattern, the boundary layer is thinner than that in the vicinity [18], Fig. 3.5. At a separation line, the flow has a converging pattern and hence the tendency is the other way around, Fig. 3.6.

Qualitative Behavior of the Radiation-Adiabatic Temperature on Real Configurations

Fig. 3.5. Pattern of skin-friction lines at an attachment line, A-reduction, Tra- increase, x1 and x2 are the surface-tangential coordinates (all schematically).

Qualitative Behavior of the Radiation-Adiabatic Temperature on Real Configurations

Fig. 3.6. Pattern of skin-friction lines at a separation line, A-increase, Tra-decrease, x1 and x2 are the surface-tangential coordinates (all schematically).

Consequently the characteristic boundary-layer thickness A is reduced at attachment lines, and one has to expect there a rise of the radiation-adiabatic temperature compared to that in the vicinity. Indeed, as will be shown in Section 3.3, a hot-spot situation arises at attachment lines (attachment-line heating), whereas at separation lines the opposite happens, i. e., a cold-spot situation ensues. Attachment-line heating was observed during the first flights of the Space Shuttle Orbiter at the orbital maneuvering system (OMS) pod, and at that time was dubbed “vortex scrubbing”, probably because the re­spective attachment line was changing its location with flight attitude and speed [4]. The A-behavior can be observed in three-dimensional boundary – layer calculations, [18], see also Sub-Section 7.2.1. Finally it is emphasized, that attachment-line heating, like attachment-line laminar-turbulent transi­tion (see Section 8), is connected not only to leading edges, but to the topol­ogy of the skin-friction field of the entire flow-field under consideration.[23]

Local Analysis of Radiation Cooling

For the following simple analysis it is assumed that the continuum approach is valid (for a general introduction to energy transport by thermal radiation see, e. g., E. R.G. Eckert et al. [16], R. B. Bird et al. [17]). Slip effects as well as high-temperature real-gas effects are not regarded. Non-convex effects will be treated later, Sub-Section 3.2.5.

The basic assumption is that of a locally one-dimensional heat-transfer mechanism (see the situation given in Fig. 3.1). This implies the neglect of
changes of the thermal state of the surface in directions tangential to the vehicle surface at the location under consideration. It implies in particular that heat radiation is directed locally normal to and away from the vehicle surface.

The general balance of the heat fluxes vectors is

q — q — q =0. (3.12)

—w —gw —rad, 4 7

Case 1 of the discussion at the end of the preceding section is now the point of departure for our analysis. With the heat flux radiated away from the surface

qrad = £&T4w , (3.13)

where є is the emissivity coefficient (0 А є A 1), and a the Stefan-Boltzmann constant, Appendix B.1, we find

qw qgw V qrad b q |ш V ь(тТ |ш, (3.14)

with kw being the thermal conductivity at the wall, and y the direction normal to the surface.

A finite difference is introduced for the derivative of T, with A being a characteristic length normal to the surface of the boundary layer, i. e., a characteristic boundary-layer thickness [18], and Tr the recovery temperature of the problem. After re-arrangement we find

Подпись:k T T

rpA ^ n, w ± r,, _ 1 ra. s

га~єаА[ Tr >’

Since we wish to identify basic properties only in a qualitative way, we introduce for A simple proportionality relations for two-dimensional flow.

1

(Pr, xRe, XiX)0-5

Подпись: §T 1 / T * �-5(1+“^ 4 C, V/ . ) Подпись: (3.16)

For laminar flow A is assumed to be the thickness 5T of the thermal boundary layer, which we introduce with the lowest-order ansatz, the flat plate (Blasius) boundary layer with reference-temperature extension [19] to compressible flow, eq. (7.100) in Sub-Section 7.2.1:

where Pe^x, Pr^,ReXJ}X are the free-stream Peclet number, the Prandtl number and the Reynolds number, respectively. T* is the reference temper­ature, eq. (7.62), and the exponent of a viscosity power law, eq. (4.14) or eq. (4.15).

For turbulent flow the thickness of the viscous sub-layer is the relevant thickness, Sub-Section 7.2.1: A = Svs. We use here, however, the turbulent scaling thickness Ssc, eq. (7.106), also with reference-temperature extension

We omit now the proportionalities to constant or not strongly varying parameters, assume T* « Tra, and introduce from Section 4.2 the power-law relation for the thermal conductivity: kw ж T/fk, eq. (4.22). With = шь2 = 0.75, and шM = шМ2 = 0.65, eq. (4.15), we see that for laminar flow kw and Tra5(1+lJ^ approximately cancel each other out.

The resulting equations are to be used to explain basic properties of radiation-cooled surfaces, but also to scale the radiation-adiabatic tempera­ture, Sub-Section 3.2.6. Therefore we write for more generality the Reynolds number in terms of reference data: Reref, L = prefuref L/^ref. For CAV’s (slender vehicles flying at low angles of attack) the free-stream data ‘TO’ can be taken as reference data. For RV’s (blunt vehicles flying at large angle of attack), boundary-layer edge data would be the proper choice.

For laminar boundary-layer flow we obtain

If Tra ^ Tr, the equations can be simplified further. We show this only for laminar flow, eq. (3.20):

For turbulent boundary layers we obtain in a similar way, however by assuming for a convenient later generalization of the results in eq. (3.25),

kw/(t*]18(1+и^) « Tr-°.6

and

rp4 1 /ті-0.6 (Д-еге/,ь) ‘8 1 rp г-,

є ro (x/L)0-2 L r[

Подпись: (3.24) < Tr. Подпись:

Подпись: Tra, Tr j’
Подпись: (3.23)

rp4 rp-0.6^£ref) 1 rp _ Tra S

Є r“ (x/L)0-2 L°-2 rl Tr ‘

Of course also these equations can be further simplified, if Tra Eqs. (3.20) and (3.23) are combined to yield

rp4 1 rp2n—l (R’Cref,!,)1 П 1 rp (-і _ Tra,

ro є ro (ж/L)" L rl Tr h

with n = 0.5 for laminar flow, and n = 0.2 for turbulent flow. This can be done for eqs. (3.21), (3.22), and (3.24), too.

It can be argued to employ in the above eqs. (3.20) to (3.25) the total temperature Tt instead of the recovery temperature Tr. However, only using the latter yields, in the frame of the chosen formulation, the expected limiting properties:

(3.26)

With our simple approximations and proportionalities, eqs. (3.15) to (3.25), we find now the qualitative result that the radiation-adiabatic wall temperature Tra on a flat surface approximately

is inversely proportional to the surface emissivity: є 0 25, is inversely proportional to the characteristic boundary-layer thickness A-0’25, with A being either the thickness of the thermal boundary-layer (ST ~ 5fiow), if the flow is laminar, or the turbulent scaling thickness (5sc), if the flow is turbulent,

is proportional to the recovery temperature Tr0 25, and with that in perfect – gas flow proportional to M°.5,

falls with laminar flow with increasing running length: (x/L)-0’125, which is a result, that M. J. Lighthill gave in 1950 [20],

falls with turbulent flow much less strongly with increasing running length:

(x/L)-0’05,

Local Analysis of Radiation Cooling

Local Analysis of Radiation Cooling

[24], of which a selection is given in Fig. 3.3. The appropriateness of the radiation-adiabatic surface as approximation of reality is also supported by these results, at least for RV’s with a thermal protection system like the Space Shuttle Orbiter has.

Local Analysis of Radiation Cooling

Fig. 3.3. The radiation-adiabatic temperature (Tw = Tra) along the windward center line of the Space Shuttle Orbiter [24]. Computed data: M= 15.7: – – – fully catalytic surface, • • • non-catalytic surface, — partially catalytic surface, Mx = 7.74 and Mx = 5.22: – – – fully turbulent, • • • fully laminar, — with transition. Space Shuttle Orbiter flight data: o.

The computations with a coupled Euler/boundary-layer method were made with the laminar-turbulent transition locations taken from flight data, and a surface-emissivity coefficient є = 0.85. Despite the scatter of the flight data in the transition region for M^ = 7.74, we see a rather good agreement of computed and flight data. At the large Mach number the flow is fully lam­inar, surface catalytic recombination appears to be small. At the two lower Mach numbers surface catalytic recombination does not play a role, the flow is more or less in thermo-chemical equilibrium, Chapter 5.

We clearly see for the two smaller flight Mach numbers that the radiation – adiabatic temperature Tra drops much faster for laminar than for turbulent flow, and that indeed behind the transition location Traturb is appreciably larger than Traiam. The level of Tra depends distinctly on the flight Mach number, being highest for the largest Mach number. It should be remembered, that it also depends on the boundary-layer’s unit edge Reynolds number, which depends on both the flight altitude and the angle of attack.

Not shown here are the results from [24] regarding the pressure and the skin-friction coefficient. The former is rather insensitive to both surface cat­alytic recombination and the state (laminar or turbulent) of the boundary layer. The latter at large Mach numbers reacts weakly on surface catalytic re­combination, but at lower Mach numbers, i. e., lower altitudes, strongly on the state of the boundary layer, laminar or turbulent, like the radiation-adiabatic temperature.

Fig. 3.3 tells us also, with all caution, that the radiation-adiabatic surface obviously is a not too bad approximation of reality, at least for the type of thermal protection system employed on the Space Shuttle Orbiter. The measured and the computed temperatures are very close to each other, hence the heat flux into the wall qw must be small.

It has not yet been quantified, how the thermal state of the surface evolves during an actual re-entry flight. It is to be surmised that a weak thermal reversal sets in after the peak heating in approximately 70 km altitude has occurred, page 43. The properties of the TPS, heat conduction—depending on temperature and pressure in the case of the Space Shuttle Orbiter [25]—, and heat capacity, in sum the thermal inertia of the TPS, will play a role. In any case, the thermal reversal appears to be small on a large part of the trajectory. Probably it is becoming large only on the low-speed segment of the latter.

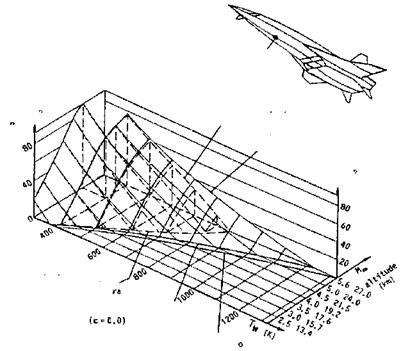
Less is known today regarding airbreathing CAV’s. To get a feeling for the involved heat fluxes and temperatures consider the example in Fig. 3.4, which, however, covers only a small and low Mach number flight span [26].

We look first at the M^-Tw surface at qw =0. The recovery temperature is smaller everywhere than the total temperature. Radiation cooling reduces the temperature at M= 5.6 by approximately 350 K compared to the recovery temperature. At smaller flight Mach numbers, and hence flight altitudes, the radiation cooling loses fast its effectiveness. This is due to the high unit Reynolds numbers, Fig. 2.3, which reduce the boundary layer thickness.

Look now at the qw-Tw surface at M= 5.6. To sustain a wall temper­ature of, for instance, Tw = 1,000 K, a heat flux into the wall of qw « 14 kW/m2 would be necessary without radiation cooling. With radiation cooling the temperature would anyway only be Tra « 870 K. Assume now an actual heat flux into the wall of qw « 10 kW/m2. This is approximately 27 per cent of the radiation heat flux qrad in the case of the radiation-adiabatic surface. This in per cent not so small actual heat flux reduces the wall temperature compared to the radiation adiabatic temperature by AT « 70 K.

We have seen above that the radiation-adiabatic temperature under cer­tain conditions is a conservative estimation of the wall temperature, and that the actual temperature will lie close to it, Tw « Tra. Coupled flow-structure analyses, for instance show, that this in general is true, see, e. g., [27, 28]. We have mentioned above the likelihood of a thermal reversal, and add that also with internal heat transfer mechanisms, for instance transverse radiation cooling through the structure of a control surface to the leeward side of it,
Local Analysis of Radiation Coolingdata point

qw with radiation

qw without radiation

qw{KW/nrO

radiation adiabatic wall temperature T

U »G,85)

recovery temperature Tr

total temperature T

Fig. 3.4. Heat fluxes and temperatures at the lower symmetry line of a hypersonic flight vehicle at different trajectory points (flight Mach number Mю and altitude) [26]. The data point lies 5 m downstream of the vehicle nose. є = 0.85, turbulent flow, approximate method. qw is the heat flux into the wall, T0 = Tt.

[6], Tw > Tra can result. If for the quantification of a given design-critical thermal-surface effect Tra is too crude an approximation, the true Tw must be determined with a multidisciplinary ansatz [2].