Category Basics of Aero – thermodynamics

The Radiation-Adiabatic Vehicle Surface

3.2.1 Introduction: Surface Radiation Cooling

Surface (thermal[17]) radiation cooling of the external vehicle surfaces is the basic cooling mode of high-speed vehicles, either RV’s or CAV’s/ARV’s, op­erating in the Earth atmosphere at speeds below 8 km/s. At these speeds radiation emission and absorption processes of heat in the air-stream past the vehicle can be neglected. Nevertheless, we have a closer look at radiation emission from a bow-shock layer.

Radiative heating by heat emission from the gas in the bow-shock layer due to the high compression and the resulting rise of the gas temperature in that region potentially is the most important source of radiation towards the surface.4 The effect is strongest in the stagnation point region of a body, which can have a rather large extension, if a RV at high angle of attack is considered.

In order to show that shock-layer radiation indeed can be neglected in the flight situations considered here, we compare the ordinary stagnation-point (s) heat flux qgw, s with the heat flux due to shock-layer radiation qrad, s. We employ simple engineering formulas.

11.03- 10[18]

Подпись: qgw,s The Radiation-Adiabatic Vehicle Surface Подпись: (3.9)

For the stagnation-point heat flux of a sphere with radius R a good ap­proximation to the relation of J. A. Fay and F. R. Riddell, [9], is given by R. W. Detra and H. Hidalgo, [10], (see also [11]):

With the nose radius R [m], the speed v[m/s], and the circular orbit velocity vco = 7.95-103 m/s, we get qgw, s [W/cm2].

7.9 • 107 R

^12-5

10[19]У

Подпись: qrad,s Подпись: pSL Подпись: 1.5 Подпись: (3.10)

For the estimation of the radiative heat flux from the shock layer to the body surface we use a formula from [12] for flight speeds v^ 6,000 m/s with the same dimensions as in eq. (3.9)

It is important to note that this shock-layer radiation heat flux, qrad, s, to the blunt-nose surface is directly proportional to the nose radius R, whereas the heat flux in the gas at the wall, qgWyS, is proportional to 1//Д.

Подпись: qrad,s qgw,s Подпись: 0.023-^A cmA 18.79-^A Подпись: 0.001. Подпись: (3.11)

We compare now the two heat fluxes for a speed of v= 8-103 m/s at 90 km altitude, where we have p= 3.416 – 10~6 kg/m3. With a nose radius of the body R = 1 m and the density at sea level pSL = 1.225 kg/m3 we obtain

This shows that indeed shock layer radiation towards the body surface can be neglected at speeds below « 8 km/s in the Earth atmosphere below « 100 km altitude.

If, for whatever reason, radiation cooling is not sufficient, other (addi­tional) cooling means, for instance transpiration cooling, ablative cooling etc., must be employed. Usually this results in extra weight, enlarged system complexity, or restricted re-usability of the vehicle.

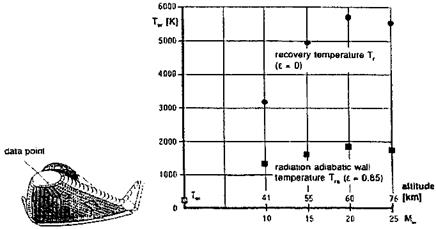
Surface radiation cooling is very effective. Fig. 3.2 shows with data com­puted by F. Monnoyer that radiation cooling reduces the wall temperature of a re-entry vehicle by such a degree that present-day TPS materials can cope with it without additional cooling [13, 14]. Without radiation cooling (emissivity є = 0), the recovery temperature Tr near the stagnation point of the HERMES re-entry vehicle reaches around 6,000 K at approximately 70 km altitude.[20] With radiation cooling (emissivity є = 0.85), the wall temper­ature Tw = Tra near the stagnation point is nearly 4,000 K lower than Tr, and remains below 2,000 K on the entire trajectory.

The Radiation-Adiabatic Vehicle Surface

Fig. 3.2. Effect of radiation cooling at a location close to the stagnation point of HERMES (x = 1 m on the lower symmetry line, a = const. = 40°), laminar flow, equilibrium real-gas model, different trajectory points (MTO, altitude H) [13] (coupled Euler/second order boundary-layer method [14]).

Definitions

The thermal state of a surface is governed by at least one temperature and at least one temperature gradient, Section 1.4. Hence both a wall temperature and a temperature gradient, respectively a heat flux, must be given to define it. Large heat fluxes can be present at low surface temperature levels, and vice versa. If a surface is radiation cooled, at least three different heat fluxes at the surface must be distinguished. In the slip-flow regime, which basically belongs to the continuum regime, two temperatures must be distinguished at the surface, Sections 4.3.2 and 9.4.

(C Springer International Publishing Switzerland 2015 E. H. Hirschel, Basics of Aerothermodynamics,

DOI: 10.1007/978-3-319-14373-6 _3

The heat transported per unit area and unit time (heat flux) towards a flight vehicle is

Qо povo hti (3,1)

with ро and vо being the free-stream density and speed (their product is the mass flux per unit area towards the flight vehicle), and ht the total enthalpy (per unit mass) of the free stream, i. e., of the undisturbed atmosphere. It is composed of the enthalpy of the undisturbed atmosphere h0 and the kinetic energy v^/2 of the flow relative to the flight vehicle:

v2

ht = /?co H—(3-2)

At hypersonic speed the kinetic energy is dominant, and hence the total enthalpy is more or less proportional to the flight velocity squared.

A considerable part of the heat transported towards the vehicle is finally transported by diffusive mechanisms towards the vehicle surface. This part is locally the heat flux, which we call the “heat flux in the gas at the wall”, qgw (this heat flux usually is called somewhat misleading the “convective” heat flux). It is directed towards the wall. However, qgw can also be directed away from the wall.

Literature is referring usually only to one heat flux qw = qgw, neglecting the fact that radiation cooling may be present. We distinguish the two fluxes and use qw to designate the wall heat flux.

A dimensionless form of the heat flux qgw is the Stanton number:

St = (3.3)

Q0

which simplifies for high flight speeds to

Подпись: (3.4)St =

PovSo

Подпись: St Подпись: qgw p<ov<x>(hr hw) Подпись: (3.5)

Other forms of the Stanton number are used, for instance

with hr and hw being the enthalpies related to the recovery temperature (r) and the actual wall (w) temperature.

For the following discussion first a wall with finite thickness and finite heat capacity is assumed, which is completely insulated from the surroundings, except at the surface, where it is exposed to the (viscous) flow. Without radiation cooling, the wall material will be heated up by the flow, depending on the heat amount penetrating the surface and the heat capacity of the material. The wall temperature will always be that of the gas at the wall: Tw = Tgw, apart from a possible temperature jump, which can be present in the slip-flow regime.

If enough heat has entered the wall material (function of time), the tem­perature in the entire wall and at the surface will reach an upper limit, the recovery temperature Tw = Tr (the heat flux goes to zero). The surface is then called an adiabatic surface: no exchange of heat takes place between gas and wall material. With steady flow conditions the recovery (adiabatic) temperature Tr is somewhat smaller than the total temperature Tt, but al­ways of the same order of magnitude. It serves as a conservative temperature estimate for the consideration of thermal loads and also of thermal-surface effects.

Подпись: Tt Подпись: T Definitions Подпись: (3.6)

It was mentioned above that the total enthalpy at hypersonic flight is proportional to the flight velocity squared. This holds also for the total tem­perature, if perfect gas behavior (Chapter 5) can be assumed, which is per­mitted for vж ^ 1 km/s. The total temperature Tt then is only a function of the total enthalpy ht, eq. (3.2), which can be expressed as function of the flight Mach number Мж = vx/ax, аж being the speed of sound in the undisturbed atmosphere:

The recovery temperature Tr can be estimated with the flat-plate relation

[1]

Тг = Т^(і + г^-±М^, (3.7)

with the recovery factor r, and, like in eq. (3.6), the ratio of specific heats 7, and the free-stream Mach number M, x. For laminar boundary layers we have r = /Pr, Pr being the Prandtl number, Sub-Section 4.3.2. For turbulent boundary layers r = /Pr can be taken [1].

Eq. (3.7), like eq. (3.6), can also be formulated in terms of local parameters from the edge ‘e’ of the boundary layer at a body:

% =Te ^l + r^Me2J. (3.8)

Eqs. (3.7) and (3.8) suggest a constant recovery temperature on the surface of a configuration. Actually in general the recovery temperature is not constant and these equations can serve only to establish its order of magnitude.

At flight velocities larger than approximately 1 km/s they lose their va­lidity, because high-temperature real-gas effects appear, Chapter 5. The tem­perature in thermal and chemical equilibrium becomes a function of two variables, for instance the enthalpy and the density. At velocities larger than approximately 5 km/s, non-equilibrium effects can play a role, complicat­ing even more these relations. Since the above relations are of approximate character, actual local recovery temperatures will have to be obtained by numerical solutions of the governing equations of the respective flow fields.

If surface-radiation cooling is employed, the situation changes completely in so far, as a—usually large—fraction of the heat flux (qgw) coming to the surface is radiated away from it (qrad). For the case considered above, but with radiation cooling, the “radiation-adiabatic temperature” Tra will result: no heat is exchanged between gas and material, but the surface radiates heat away.[15]

With steady flow conditions and a steady (small) wall heat flux qw, Tra also is a conservative estimate of the surface temperature. Depending on the employed structure and materials concept (either a cold primary structure with a thermal protection system (TPS), or a hot primary structure), and on the flight trajectory segment, the actual wall temperature during flight may be somewhat lower, but in any case will be near to the radiation-adiabatic temperature, Sub-Section 3.2.3. This does not necessarily hold at structure elements with small surface radii (fuselage nose, leading edges, inlet cowl lip) and other locations, if surface-tangential heat flux is present [2, 3].

Interesting is the low-speed case after high-speed flight, where Tw in gen­eral will be larger than the momentary recovery temperature Tr (thermal reversal), due to the thermal inertia of the TPS or the hot structure. In [4] it is reported that the lift to drag ratio of the Space Shuttle Orbiter in the supersonic and the subsonic regime was underestimated during the design by up to 10 per cent. This may be at least partly attributable to the thermal reversal, which is supported by numerical investigations of J. M. Longo and R. Radespiel [5]. Turbulent skin-friction drag on the one hand depends strongly on the wall temperature. The higher the wall temperature, the lower is the turbulent skin friction, Sub-Section 7.2.3. On the other hand, the thickening of the boundary layer due to the presence of the hot surface may reduce the tile-gap induced drag, which is a surface roughness effect, Sub-Section 8.3.1.

Besides radiation cooling, which is a passive cooling means, active cooling, for instance of internal surfaces, but of course also of external ones, can be employed. In such cases a prescribed wall temperature is to be supported by a finite heat flux into the wall and towards the heat exchanger. Other cooling means are possible, see, e. g., [6].

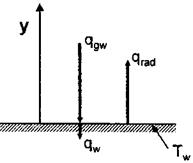
In the following we summarize the above discussion. We neglect possible shock-layer radiation and tangential heat fluxes [2], a possible temperature jump,[16] and assume, as above, that the radiative transport of heat is directed away from the surface. We then arrive at the situation shown in Fig. 3.1. Five cases can be distinguished:

1. Radiation-adiabatic wall: qw = 0, qrad = – qgw. The wall temperature is the radiation-adiabatic temperature: Tw = Tra, which is a consequence of the flux balance qgw = – qrad.

Definitions

Fig. 3.1. Schematic description of the thermal state of the surface in the continuum regime, hence Tgw = Tw. Tangential fluxes and non-convex radiation cooling effects are neglected, y is the surface-normal coordinate. qgw: heat flux in the gas at the wall, qw: wall heat flux, qrad: surface radiation heat flux.

2. The wall temperature Tw without radiation cooling (qrad = 0) is pre­scribed (e. g., because of a material constraint), or it is simply given, like with a (cold) wind-tunnel model surface: the wall heat flux is equal to the heat flux in the gas at the wall qw = qgw.

3. Adiabatic wall: qgw = qw =0, qrad = 0. The wall temperature is the recovery temperature: Tw = Tr.

4. The wall temperature Tw in presence of radiation cooling (qrad > 0) is prescribed (e. g., because of a material constraint): the wall-heat flux qw is the consequence of the balance of qgw and qrad at the prescribed Tw.

5. The wall heat flux qw is prescribed (e. g., in order to obtain a certain amount of heat in a heat exchanger): the wall temperature Tw is a con­sequence of the balance of all three heat fluxes.

Thermal Radiation Cooling of External Vehicle Surfaces

External surfaces (the external flow path) of hypersonic flight vehicles pri­marily are radiation cooled. The radiation cooling effect depends on certain properties of the attached viscous flow, the boundary layer, and on the emis – sivity coefficient of the surface material. Hence the wall temperature and its gradient, respectively the heat flux in the gas at the wall—the thermal state of the surface—are not constant, on the contrary, they are functions of the location on the vehicle surface. The concept of the “thermal state of a surface” was introduced in Section 1.4. It governs both “thermal loads” and “thermal surface effects”. This holds for the external flow path as well as for the internal flow path which is present on airbreathing CAV’s and ARV’s.

In this chapter we discuss in detail the matter of surface radiation cooling before the classical topics of aerothermodynamics are treated in the following chapters. Basics of surface thermal radiation cooling are treated in Section 3.2. With simple approximations we try to obtain a basic understanding of the aerothermodynamics of radiation-cooled surfaces. Treated too are non­convex effects and scaling approaches. Results of computations with numer­ical methods are used to illustrate the findings. A case study, Section 3.3, gives a detailed account. Some examples of viscous thermal surface effects are treated in the Chapters 7, 8, and 9. In Chapter 10 a number of further examples is discussed. Thermal loads on structures are not a central topic of this book.

Problems

Problem 2.1. During re-entry of a RV the density at 70 km altitude is 10 per cent lower than assumed. The actual drag hence is 10 per cent smaller than the nominal drag (D = 0.5p^v^CD(a)Aref). The vehicle flies with an angle of attack a = 45°. We assume a constant velocity vTO, the reference area A is constant anyway. How must the angle of attack a approximately be changed in order to recover the nominal drag?

Problem 2.2. Take from Table 2.1 the density for a) 30 km and b) 80 km altitude. Compute for both cases the partial densities pN2 and po2 and determine the partial pressures pN2 and pO2. Compare the results with the density and pressure data in Table 2.1.

Problem 2.3. The Knudsen number of a nose cone with a diameter D = 0.3 m at 70 km altitude is Kn = 0.0029. It is to be tested in a ground-simulation facility. Pressure and temperature in the test section of the facility are p = 50 Pa and T = 100 K. What is the mean free path in the test section? What nose cone diameter is needed in the facility in order to have the same Knudsen number as in the flight situation?

Problems

Flow Regimes

As can be seen in Fig. 2.1, density and pressure are rapidly decreasing with increasing altitude, whereas the temperature is more or less constant up to

Подпись: (2.15)

Flow Regimes

Kn=j. (2.16)

L

The characteristic length L can be a body length, a nose radius, a boundary-layer thickness, or the thickness of a shock wave, depending on the problem at hand.

Подпись: 6 x Flow Regimes Подпись: (2.17)

Take for instance the thickness 5 of a laminar, incompressible flat-plate (Blasius) boundary layer [14]

as characteristic length. With Re^,x = p^u^x/p^ then

Kn = ^ = ^ /”’ .• (2.18)

5 cx

Flow Regimes Подпись: (2.19)

The Knudsen number can also be expressed in terms of the flight Mach number Ыж and the Reynolds number Re^,L, L being for instance the ve­hicle length:

Kn~ ■ . (2.20)

Re<x>,x

The Knudsen number is employed to distinguish approximately between flow regimes:

— continuum flow:

Kn < 0.01, (2.21)

— continuum flow with slip effects (slip flow and temperature jump at the body surface):

0.01 < Kn < 0.1, (2.22)

— disturbed free molecular flow (gas particles not only collide with the body surface, but also with each other):

0.1 < Kn < 10, (2.23)

— free molecular flow (gas particles collide only with the body surface, New­ton limit [15]):

10 < Kn. (2.24)

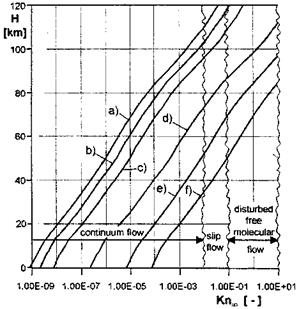
No sharp limits exist between the four flow regimes.[13] In Fig. 2.6 we show the Knudsen number Kn/L of some hypersonic flight vehicles and some vehicle components, with the characteristic length L taken as vehicle length or component diameter.

Flow Regimes

Fig. 2.6. Knudsen numbers Knas function of the altitude H for a) the SANGER lower stage, L ~ 80 m; b) the Space Shuttle Orbiter, L ~ 30 m; c) the X-38, L ~ 8 m; d) a nose cone, (D =) L ~ 0.3 m; e) a pitot gauge, (D=) L ~ 0.01 m; f) a measurement orifice, (D =) L ~ 0.001 m.

Globally the lower stage of SANGER (case a), with a maximum flight altitude of approximately 35 km [16], the Space Shuttle Orbiter (case b), and also the X-38 (case c), remain fully in the continuum regime in the interesting altitude range below approximately 100 km. For the nose cone (case d) slip – flow effects can be expected above 75 km altitude. The pitot gauge (case e) is in the continuum regime only up to approximately 50 km altitude because of its small diameter, and likewise the measurement orifice (case f) only up to 35 km altitude.

Regarding the aerothermodynamic simulation means, we note that ground-test facilities are available for all flow regimes. However, in almost no case is a full simultaneous simulation possible of all relevant parameters for hypersonic flight.

Computational simulation for the continuum and for the slip-flow regime can be made with the methods of numerical aerothermodynamics. They in­clude the Euler methods, the Navier-Stokes methods, the Reynolds-averaged Navier-Stokes (RANS) methods for turbulent flow, and the methods for the solution of the derivatives of the Navier-Stokes/RANS equations (boundary- layer methods, viscous shock-layer methods etc.).[14]

It is interesting to note that the Newton theory [15], which is exact for free molecular flow, can be used as inviscid computational tool in the continuum regime with sufficient accuracy down to M « 2 to 4, Section 6.7.

A major question that arises, is how shock waves, which are only a few mean-free paths thick, are treated in discrete numerical methods for the con­tinuum regime. Shock waves, which as typical compressibility effects appear from transonic free-stream Mach numbers upwards, are found in the flow past all supersonic and hypersonic flight vehicles operating in this regime. We come back to this problem in Sub-Section 6.3.3.

The Flight Environment

Hypersonic flight either of space-transportation systems or of hypersonic air­craft in the Earth atmosphere is in the focal point of the book. Hence the flight environment considered here is that which the Earth atmosphere poses. The basic features and properties are discussed, and references are given for detailed information.

2.1 The Earth Atmosphere

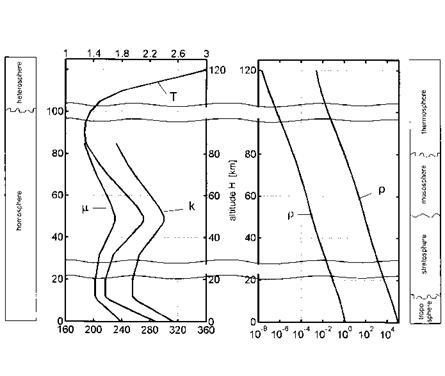
The Earth atmosphere consists of several layers, the troposphere from sea level up to approximately 10 km, the stratosphere between 10 km and 50 km, the mesosphere between 50 km and 80 km, and the thermosphere above ap­proximately 80 km altitude, Fig. 2.1. The weather phenomena occur mainly in the troposphere, and consequently the fluctuations there mix and dis­perse introduced contaminants. These fluctuations are only weakly present at higher altitudes.

The stratosphere is characterized by a temperature plateau around 220­230 K, in the mesosphere it becomes colder, in the thermosphere the temper­ature rises fast with altitude. Ecologically important is the altitude between 18 km and 25 km with the vulnerable ozone layer.

The composition of the atmosphere can be considered as constant in the homosphere up to approximately 80 km altitude with the mean molecular weight being M = 28.9644 kg/kg-mole. At 100 km altitude we have still M = 28.8674 kg/kg-mole. In the heterosphere, above 100 km altitude, it drops markedly with altitude, at 120 km the mean molecular weight is down to M = 28.0673 kg/kg-mole. This is important especially for computational simulations of aerothermodynamics. Note that also around 100 km altitude the continuum domain ends (Section 2.3).

It should be mentioned, that these numbers are average numbers, which partly depend strongly on the degree of geographical latitude of a location, and that they are changing with time (seasons, atmospheric tides, sun-spot activities). A large number of reference and standard atmosphere models is discussed in [2], where also model uncertainties and limitations are noted.

In aerothermodynamics we work usually with the U. S. standard atmo­sphere [3], in order to determine static pressure (p), density (p), temperature

(C Springer International Publishing Switzerland 2015 E. H. Hirschel, Basics of Aerothermodynamics,

DOI: 10.1007/978-3-319-14373-6 _2
Подпись: 120 The Flight Environment

The Flight Environmentthermal conductivity к [102J / m s К ] dynamic viscosity p [10s N s / m2]

Подпись:pressure p [Pa] density p [kg / m3]

Fig. 2.1. Atmospheric layers and some properties of the atmosphere as function of the altitude [1], based on [3] (see also Table 2.1).

(T) etc. as function of the altitude, Table 2.1. The 15°C standard atmo­sphere assumes a temperature of 15°C at sea level. A graphical view of some properties of the standard atmosphere is given in Fig. 2.1.

The pressure p decreases rapidly with increasing altitude and so does the density p. Because the temperature T does not change much, the curves of p and p look similar. The dynamic viscosity p is a function of the tempera­ture and can be determined with the Sutherland formula, Sub-Section 4.2.2. Sutherland’s formula becomes inaccurate for the conditions present at high altitudes [3] (change of the composition of air, see above). Therefore the data are restricted to altitudes of H ^ 86 km. An empirical relation comparable to Sutherland’s formula, i. e., Hansen’s formula, Sub-Section 4.2.3, is used for the calculation of the thermal conductivity k. Again the data are restricted to altitudes of H ^ 86 km.

Uncertainties in atmospheric data influence guidance and control of a hy­personic flight vehicle. Large density fluctuations/uncertainties, which pre­dominantly can occur at approximately 60-80 km altitude, must be com­pensated during, for example, a re-entry flight. Otherwise a (down) range

Подпись: Table 2.1. Properties of the 15°C U. S. standard atmosphere as function of the altitude [3]. Altitude Temperature Pressure Density Dynamic Thermal H [km] T И p [Pa] P [kg/rn] viscosity P [N s/m] conductivity к [W/m K] 0 288.150 1.013 • 105 1.225 10° 1.789 • 10~5 2.536 • 10~2 5 255.676 5.405 • 10 7.364 • 10- 1.628 • 10~5 2.276 • 10~2 10 223.252 2.650 • 104 4.135 • 10-1 1.458 • 10~5 2.009 • 10~2 20 216.650 5.529 • 103 8.891 • 10~2 1.421 • 10~5 1.953 • 10~2 30 226.509 1.197 • 103 1.841 • 10~2 1.475 • 10~5 2.036 • 10~2 40 250.350 2.871 • 102 3.996 • 10~3 1.601 • 10~5 2.233 • 10~2 50 270.650 7.978 • 101 1.027 • 10~3 1.704 • 10~5 2.397 • 10~2 60 247.021 2.196 • 101 3.097 • 10~4 1.584 • 10~5 2.206 • 10~2 70 219.585 5.221 • 10° 8.283 • 10~5 1.438 • 10~5 1.978 • 10-2 80 198.639 1.052 • 10° 1.846 • 10~5 1.321 • 10~5 1.800 • 10-2 90 186.870 1.836 • 10-1 3.416 • 10~6 100 195.080 3.201 • 10~2 5.604 • 10-7 110 240.000 7.104 • 10~3 9.708 • 10“8 120 360.000 2.538 • 10~3 2.222 • 10~8

deviation would occur.1 A 25 per cent smaller density than assumed at that altitude would lead, without correcting measures, to an approximately 100 km larger down range [4].

For in-flight tests, for instance for vehicle-parameter identification pur­poses, or to obtain data on aerothermodynamic or other phenomena, it is mandatory to have highly accurate instantaneous “air data” on the trajec­tory in order to correlate measured parameters. The air data are the ther­modynamic data p, x, T, x, pco, and the vehicle speed vector vx relative to the surrounding air space. To obtain them before or during a flight is still a difficult task.

For quick estimates of properties of the atmosphere the barometric height formula for the isothermal atmosphere can be employed:

Подпись: (2.1)P (H) _ – pH

p (H = 0)

Here в is a function of the temperature T* of the standard atmosphere at a chosen altitude H*:

P RT* ■ (2-2)

At sea level we have p (H = 0) = 1.013-102 kPa, g (H = 0) = 9.80665 m/s2. R is the gas constant.

For low altitudes the temperature at sea level (H* = 0) is used: T* = 288.15 K. With it one gets в = 1.186-10-4 1/m.

For high altitudes the temperature at H* = 7,000 m is used: T* = 242,55 K. With it one obtains в = 1.40845-10~4 1/m. This value is cited in [1].

Because the temperature T is assumed to be constant, the density formula reads like the pressure formula with p (H = 0) = 1.225 kg/m3:

Подпись:P (H) _ рн

P(H = 0)

The atmosphere with its properties determines the free-stream parameters of a flight vehicle. These in turn govern the aerothermodynamic phenomena and the aerodynamic performance. We give a short overview in Figs. 2.2 to 2.4 over the main free-stream parameters and some aerothermodynamic phenomena for the altitude domain 0 km A H A 65 km, and the flight-speed domain 0 km/s A vж A 7 km/s [5]. Indicated are nominal design points of the supersonic passenger aircraft Concorde, of four reference concepts LK1 to LK4 of a German hypersonic technology study [6], of the SANGER lower stage (staging condition) [7], and of the NASP/X-30 (cruise) [8]. Typical trajectory data of re-entry vehicles (Space Shuttle Orbiter, HERMES) are included, too.

Note that the trajectories and the nominal design points in the figure reflect flight with—besides others—a dynamic pressure constraint [1]. This constraint is for the Space Shuttle Orbiter and for HERMES qж A 15 kPa. The airbreathing vehicles with ram – and/or scram-jet propulsion fly at qж = 50-90 kPa.

Fig. 2.2 shows iso-Mach-number lines. These lines are more or less parallel to iso-speed lines. Turbo propulsion is possible up to Мж « 3, i. e., vж « 1 km/s, ram-jet propulsion between 3 A Mж A 7, i. e., 1 km/s A vж A 2 km/s, and finally scram-jet propulsion between 4 A Mж A 12 to 14, i. e., 1.2 km/s A vж A 4 to 4.5 km/s [1].

Iso-unit Reynolds-number lines are at larger altitudes approximately par­allel to iso-altitude lines. They show that at flight below approximately 50 km altitude boundary layers will be predominantly turbulent, Fig. 2.3, if the unit Reynolds number ReU = ржпж/рж « 105 m-1 is taken—with due reservations—as zero-order criterion. This means that the design of airbreath­ing flight vehicles (CAV’s/ARV’s) always has to cope with laminar-turbulent
transition and turbulence. The laminar portion at the front part of a flight vehicle will be small at small altitudes and finally will extend over the vehicle length when ReU ~ 106 m_1 is approached. On RV’s boundary layers are laminar during re-entry flight above approximately 60 km to 40 km altitude, i. e., in particular in the domain of large high-temperature real-gas effects and large thermal loads.

Подпись: Fig. 2.2. Hypersonic flight-vehicle concepts in the velocity-altitude map (v = v^) with flight Mach numbers [5] (based on [9]).

The Flight EnvironmentIncluded in Fig. 2.3 are also lines of constant total temperature (equilib­rium real gas). They indicate that with increasing speed thermal loads indeed become a major design problem of airframes of hypersonic flight vehicles, and of airbreathing propulsion systems.

Подпись: v [km/s]

Fig. 2.3. Hypersonic flight-vehicle concepts in the velocity-altitude map with flight unit Reynolds numbers (Re/L = Re^), and equilibrium real-gas total temperatures To (= Tt) [5] (based on [9]).
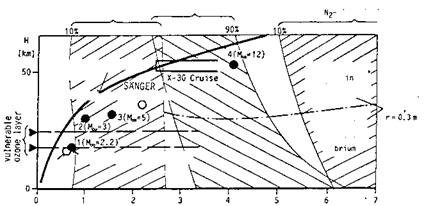
Подпись: vibration excitation Подпись: 02-dissociation Подпись: dissociation

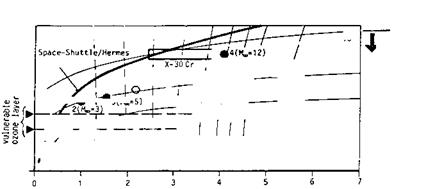
The Flight EnvironmentFig. 2.4 finally shows that at flight speeds below v^ ж 0.8 km/s air can be considered as a calorically and thermally perfect gas. For 0.8 km/s ^ v^ ^ 2.6 km/s vibration excitation must be taken into account. Above v^ ж 2 km/s first occurs dissociation of oxygen and then of nitrogen. The dissociation of both these major gas constituents depends strongly on the flight altitude. At altitudes below H ж 25 km we can expect in general equilibrium, above it non-equilibrium real-gas behavior. These statements are only of approximate validity, in reality the vehicle form, size, and its flight attitude play a major role.

Подпись: Space-Shuttle/Hermes trajectory І /Уу' . lower stage The Flight Environment Подпись: stagnation

10% 90%

Подпись: area

The Flight Environment The Flight Environment

sphere

v [km/sl

Fig. 2.4. Hypersonic flight-vehicle concepts in the velocity-altitude map with high – temperature real-gas effects [5] (based on [9]).

2.2 Atmospheric Properties and Models

The Earth atmosphere at the temperature of 15°C and the pressure of 101.325 kPa is a gas consisting (if dry) of molecular nitrogen (N2, 78.084 volume per cent), molecular oxygen (O2, 20.9476 volume per cent), argon (Ar, 0.934 volume per cent), carbon dioxide (CO2, 0.0314 volume per cent), and some other spurious gases [10].

For our purposes we assume for convenience that the undisturbed air consists only of the molecules N2 and O2, with all three translational, and two rotational degrees of freedom of each molecule excited, Chapter 5. During hypersonic flight in the Earth atmosphere this (model) air will be heated close to the flight vehicle due to compression and viscous effects. Consequently then first the (two) vibration degrees of freedom of the molecules become excited, and finally dissociation and recombination takes place. The gas is then a mixture of molecules and atoms. In aerothermodynamics at temperatures up to 8,000 K air can be considered as a mixture of the five species [11, 12]:

N2, N, O2, O, NO.

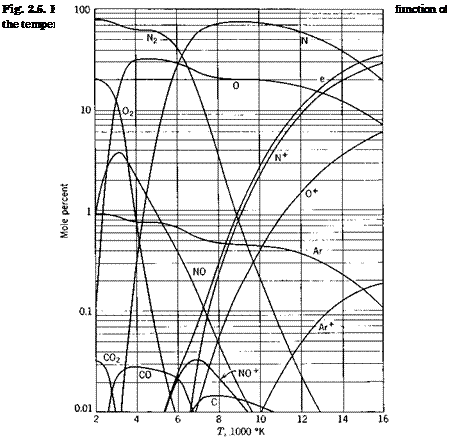
At high temperatures ionization may occur. Since it involves only little energy, which can be neglected in the overall flow-energy balance, we can disregard it in general. However if electromagnetic effects (radio-frequency transmission) are to be considered, we must take into account that additional species appear, see Fig. 2.5 and also, e. g., [1]:

N+, N+, O+, O+, NO+, e-.

The air, in general, can be considered as a mixture of n thermally perfect gas species [11]. This holds for the undisturbed atmosphere, and for both the external and the internal flow path of hypersonic vehicles.

For such gases it holds:

— The pressure is the sum of the partial pressures pi:

n

p = 53 Pi – (2.4)

i=1

— The density is the sum of the partial densities pi:

n

P = 53 Pi – (2.5)

i=1

— The temperature T in equilibrium is the same for all species.

Подпись: n p = p i i=1 The Flight Environment Подпись: (2.6)

The equation of state, with the universal gas constant R0, is

The Flight Environment The Flight Environment The Flight Environment

R being the gas constant of the mixture. The mass fraction ші of the species i is

— The mole fraction xi is

Подпись: (2.9)Ci

Xi =

C

with the molar concentration Ci

Pi

M,1

Подпись: (2.10)
Подпись: Ci

which has the dimension “kg-mole/m3”. The molar density of a gas mixture then is defined by

n

c = Y, Ci. (2.11)

i=1

The mean molecular weight of the undisturbed binary model air at sea level, as well as the two mass fractions, can be determined with the above eqs. (2.4) to (2.8). With the data from Table 2.1, and the molecular weights, Ap­pendix B.1, of molecular nitrogen (MN2 = 28.02 kg/kg-mole), and molecular oxygen (Mo2 = 32 kg/kg-mole), we obtain uN2 = 0.73784, &o2 = 0.26216, and Mair = 28.9644 kg/kg-mole.

The Flight Environment Подпись: (2.12)

For this model air we can determine the composition in volume per cent (volume fraction ri), which is slightly different from that quoted above, since the spurious gases are now neglected. Defining the fractional density p* by

Подпись: rN2 Подпись: ^N■2 P*o2 UJN2PO2 + ШО2Р*М2 ’ Подпись: (2.13)

the volume fractions of nitrogen and oxygen read

Подпись: rO2 Подпись: WQ2P*N2 UJN2PO2 + ШО2Р*М2 Подпись: (2.14)

and

The volume fractions are finally rN2 = 0.7627 (76.27 volume per cent), and rO2 = 0.2373 (23.73 volume per cent).

The actual “equilibrium” composition of a mixture of thermally perfect gases is always a function of the temperature and the density or the pressure. Fig. 2.5, [11], gives an example.

At large pressures and low temperatures van-der-Waals effects can occur. In flight they usually can be neglected, but in hypersonic ground-simulation facilities, especially in high-pressure/high-Reynolds number facilities they can play a non-negligible role. In Section 5.1 we come back to the van-der-Waals effects.

Scope and Content of the Book

The aerodynamic and the aerothermodynamic design of flight vehicles have undergone large changes regarding the tools used in the design processes. Dis­crete numerical methods of aerothermodynamics now find their place already in the early vehicle definition phases. This is a welcome development from the viewpoint of vehicle design, because only with their use the necessary completeness and accuracy of design data can be attained. However, as will be shown and discussed in this book, computational simulation still suffers, like that with other analytical methods, and of course also ground-facility simulation, under the insufficient representation of real-gas and of turbulence phenomena. This is a shortcoming, which in the long run has to be overcome.

It remains the problem that computational simulation gives results on a high abstraction level. This is similar with the application of, for instance, computational methods in structural design. The user of numerical simu­lation methods therefore must have very good basic knowledge of both the phenomena he wishes to describe and their significance for the design problem at hand.

Therefore this book has the aim to foster:

— the understanding of their qualitative dependence on flight parameters, vehicle geometry, etc.,

— and their quantitative description.

As a consequence of this the classical approximate methods, and also the modern discrete numerical methods, in general will not be discussed in detail. The reader is referred either to the original literature, or to hypersonic mono­graphs, which introduce to their basics in some detail, for instance [27, 28]. However, approximate methods, and very simple analytical considerations will be presented and employed where possible to give basic insights and to show basic trends.

The book has three introductory chapters. On Chapter 1, the introduc­tion, follows Chapter 2, treating the flight environment, which in the frame of this book predominantly is the Earth atmosphere below approximately 100 km altitude. Chapter 3 is devoted to the discussion of the thermal radi­ation cooling of outer vehicle surfaces. This cooling is a basic condition for hypersonic flight of all kinds.

Chapters 4 to 9 are devoted to the classical topics of aerothermodynam – ics. Chapter 4 gives the basic mathematical formulations regarding transport of mass, momentum and energy. Emphasis is put on the presentation of sim­ilarity parameters, and of the boundary conditions at the vehicle surface. Chapters 5 and 6 then treat the topics real-gas and inviscid aerothermody – namic phenomena.

The topics attached high-speed viscous flow and laminar-turbulent transi­tion and turbulence—being very important in view of CAV’s and ARV’s—are presented in Chapters 7 and 8. Strong-interaction phenomena are discussed in Chapter 9.

Remains the topic of thermal surface effects. Examples of thermal surface effects are given in several of the chapters. Chapter 10 then is dedicated to discussions of further examples of, however, only viscous thermal surface effects. In view of CAV and ARV design these being the more important effects.

A solution guide and solutions of the problems posed at the ends of most of the chapters are given in Chapter 11.

In Appendix A we collect the governing equations of hypersonic flow in general coordinates. The book closes with constants, functions etc. (Appendix B), symbols and acronyms (Appendix C), permissions, and the author and the subject index.

The discussion of computational and ground-facility simulation means, to which a chapter was devoted in the first edition of this book, has been deleted. The author believes that now, nearly after ten years of the first edition, this of course still very important topic is covered enough with and in other publications, see, e. g., also [5, 21].

Also deleted was the small chapter on the Rankine-Hugoniot-Prandtl – Meyer (RHPM)-flyer, which was introduced in the first edition as a very simple approximation of hypersonic flight vehicles. The RHPM-flyer is based on shock-expansion theory and very easy to employ. Because cheap computer power now is available, other approximation

Unsteady Flight and Steady Aerothermodynamics?

The aerothermodynamic flow fields and flow phenomena considered in this book result in mechanical loads (pressure and skin friction) and thermal loads (temperatures and heat fluxes) at the surface of the flight vehicle under consideration. The propulsion system of a CAV or an ARV adds to both of them. We have to ask ourselves whether the flow fields and phenomena found at RV’s, CAV’s and ARV’s can be considered as steady phenomena. We follow closely the considerations in this regards which can be found in

[7].

The flight of a RV is entirely an unsteady flight. A CAV nominally may fly in a steady mode, but actually, as also does the ARV, it flies more or less in an unsteady mode. For an introduction to flight trajectories of RV’s and CAV’s, see, e. g., [5].

The mechanical loads summated over the vehicle surface show up as the aerodynamic properties of the vehicle: lift, drag, pitching moment etc., called all together the aerodynamic data set or model of the vehicle [7].[12]

The well-proven approach of the aircraft designers is also employed for RV’s and CAV’s/ARV’s: the aerodynamic data of a vehicle are—with one exception—steady motion data. This approach is permitted as long as the flight of the vehicle can be considered as quasi-steady flight. The actual flight path—with steady and/or unsteady flight—then is described with the help of three-, six-, and even more degrees of freedom trajectory determinations, see, e. g., [25], with appropriate systems and operational constraints and control variables [5].

A reliable criterium which defines when the flight can be considered as being quasi-steady is not known. Nevertheless, the experience indicates that one can assume RV and CAV/ARV flight to be quasi-steady, see also Section

4.1. This is the reason why the aerodynamic data are always obtained in a steady-state mode (steady motion), experimentally and/or computationally. Hence it is permitted, too, to consider aerothermodynamic flow fields and flow phenomena to be steady flow fields and phenomena.

The mentioned exception is an aerodynamic vehicle property which is truly time-dependent: the dynamic stability, see, e. g., [26]. The dynamic sta­bility actually is the damping behavior once a disturbance of the vehicle attitude has happened, for instance an angle-of-attack disturbance, or a dis­turbance around one of the other two vehicle axes. The time dependence indicates, whether the unsteady—in general oscillatory—motion induced by the disturbance is damped or not. Although very important, the dynamic stability can be considered as being not a primary aerodynamic data set item.

There are other phenomena which are truly unsteady. One is due to the thermal inertia of a thermal protection system. The wall temperature distri­bution will not always adapt the value which belongs to the instant state of the flight. An example is mentioned on page 40 in Chapter 3. Other examples are (localized) unsteady shock/shock and shock/boundary-layer interactions, processes in propulsion systems, in gauges and also in ground-simulation fa­cilities. We do not further pursue this topic.

The Thermal State of the Surface and Thermal Surface Effects

The influence of, for instance, the Mach number or the Reynolds number on the appearance and kind of flow phenomena is well known and can be found everywhere in the text books. Mach number, Reynolds number and other “numbers” are similarity parameters, Chapter 4. Often overlooked is that the ratio ‘wall temperature’ to, for instance, ‘free-stream temperature’ (Tw/Тж) is also a similarity parameter, Section 4.4. In the text books one finds in this regard, with a few exceptions, usually at most that the wall temperature influences the skin friction, often in combination with the Mach number, and for the adiabatic wall only [23].

The classical wind tunnel experiment regarding heat loads is made with a cold model wall, often with an uncontrolled surface temperature. The task of the experiment is to find the distribution of the Stanton number and nothing more. This is the Stanton-number concept: the heat flux in the wall qw is specified basically by the—on the whole model surface in general constant— difference of the recovery temperature Tr and the wall temperature Tw.[9] The heat flux in the wall is equal to the heat flux in the gas at the wall: qw = qgw.

At the radiation cooled surface of an hypersonic flight vehicle the situation is different. The wall temperature Tw basically is due to the balance of three heat fluxes: the heat flux in the gas at the wall qgw, Sub-Section 4.3.2, the radiation-cooling heat flux qrad, Sub-Section 3.2.1, and the heat flux in the wall qw, Section 3.1. Other heat fluxes may be of importance, too: surface – tangential heat fluxes, heat fluxes due to non-convex effects, and to shock – layer radiation. Because the different fluxes are functions of the location on the vehicle’s surface, the resulting wall temperature is a function of the surface location, too.

For hypersonic flight vehicles the actual wall temperature Tw and the temperature gradient in the gas normal to the vehicle surface dT/dngw are of large importance. We call them together the “thermal state of the surface”. This state influences not only thermal loads, but also viscous and thermo­chemical flow phenomena at and near the vehicle surface (external and in­ternal flow paths). We call this influence “thermal surface effects”. Both the concept of the thermal state of the surface and the concept of thermal surface effects are important topics of this book.

The influence of the Mach number, the Reynolds number and other simi­larity parameters on the flow can qualitatively be discussed by looking at the orders of magnitude of the numbers. Take for instance the Mach number, which indicates compressibility effects in the flow, page 92. For M ^ 1 we speak of incompressible flow, at M « 1 we have the transonic regime and so on. Similarly we can make an ordering of viscous transport phenomena by looking at the relative magnitude of the Reynolds number, page 92.

Regarding the thermal surface effects, the situation is complicated. A simple ordering of effects is not possible. The influence of the thermal state of the surface on viscous and thermo-chemical surface effects of course is additional to that of the basic parameters Mach number, Reynolds number, stream-wise and cross-wise pressure gradients, etc. In several of the follow­ing chapters we show and discuss some examples of viscous thermal surface effects. Eventually we devote Chapter 10 to a deeper discussion of further examples. Examples of thermo-chemical thermal surface effects cannot be considered in the frame of this book.

We define now the thermal state of the surface and the thermal surface effects in a formal manner.

The Thermal State of the Surface. Under the “thermal state of the sur­face” we understand the temperature of the gas at the surface (wall temper­ature), and the temperature gradient, respectively the heat flux, in it normal to the surface [24].[10] As will be shown in Chapter 3, these are not necessarily those of and in the surface material. Regarding external surfaces we note, that these are, with some exceptions, in general only radiation cooled, if we consider RV’s or CAV’s and ARV’s flying in the Earth atmosphere at speeds below approximately 8 km/s [14].

The thermal state of the surface thus is defined by

— the actual temperature of the gas at the wall surface, Tgw, and the temper­ature of the wall, Tw, with Tgw = Tw, if low-density effects (temperature jump, Sub-Section 4.3.2) are not present,

— the temperature gradient in the gas at the wall, dT/dngw, in direction normal to the surface, respectively the heat flux in the gas at the wall, qgw, if the gas is a perfect gas or in thermo-chemical equilibrium, Chapter 5.[11] The heat flux qw is not equal to qgw, if radiation cooling is present, Section 3.1.

Surface radiation cooling implies that Tw, dT/dngw, qgw and qw are not constant over a vehicle’s surface. Partly large gradients appear in downstream direction and also in lateral direction.

If one considers a RV, the thermal state of the surface concerns predom­inantly the structure and materials layout of the vehicle, and not so much its aerodynamic performance, except in some instances the performance of aerodynamic trim and control surfaces [5]. This is because the RV flies a “braking” mission, where the drag—wave drag, form drag, however negligi­ble skin-friction drag—on purpose is large (blunt configuration, large angle of attack, Table 1.1). Of course, if a flight mission demands large down-range or cross-range capabilities in the atmosphere, this may change somewhat [5, 21].

The situation is different for an (airbreathing) CAV (or ARV in the air­breathing propulsion mode), which like any aircraft is drag-sensitive, and where viscous effects, which are affected strongly by the thermal state of the surface, in general play an important role, Table 1.2. This concerns the drag, the performance of trim and control surfaces, and the performance of ele­ments of the (airbreathing) propulsion system (inlet, boundary-layer diverter duct, nozzle) [21, 5].

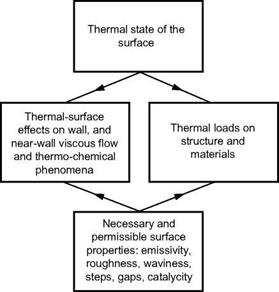
Thermal Surface Effects. This book puts emphasis on these facts by intro­ducing the concept of “thermal-surface effects”, which extends the classical “Stanton number” concept coming from the beginnings of high-speed flight. The Stanton number concept concerns mainly the classical thermal (heat) loads, which are of importance for the structure and materials concept of a vehicle. In contrast to that thermal-surface effects concern wall and near-wall viscous-flow and thermo-chemical phenomena, Fig. 1.4. This holds for both the external and the internal flow path of a flight vehicle.

The Thermal State of the Surface and Thermal Surface Effects

Fig. 1.4. The thermal state of the surface and its different aero-thermal design implications.

A good understanding of thermal-surface effects is deemed to be necessary in design work for hypersonic flight vehicles, in particular CAV’s and ARV’s. Thermal-surface effects regard both the external and the internal flow path. Special attention must be given to tests in ground-simulation facilities, where usually cold-wall models are employed. The “hot experimental technique” is more or less in its infancy. Where it cannot be realized, extremely demanding other approaches may become necessary in order to fulfill ground verification needs of hypersonic flight vehicles or airbreathing propulsion systems [21].

Both thermal-surface effects and thermal loads are coupled directly to the necessary and permissible surface properties, which were mentioned in Section 1.3.

In the following Table 1.3 wall and near-wall viscous-flow and thermo­chemical phenomena as well as structure and materials issues are listed, which are influenced by the thermal state of the surface.

Table 1.3. Wall and near-wall viscous-flow/thermo-chemical phenomena, and structure and materials issues influenced by the thermal state of the surface (n is the direction normal to the surface, ( ) indicates indirect influence).

Item

Tw

dT/dngw

dT/dnw

Boundary-layer thicknesses (<5, …)

X

Skin friction

X

Heat flux in the gas at the wall qgw

X

X

Surface-radiation heat flux qrad

X

X

(X)

Laminar-turbulent transition

X

X

Turbulence

?

?

Uncontrolled/controlled flow separation

X

Shock/bondary-layer interaction

X

Hypersonic viscous interaction

X

Catalytic surface recombination

X

(X)

Transport properties at/near the surface

X

X

Wall heat flux qw

X

(X)

X

Material strength and endurance

X

Thickness of TPS or internal insulation

X

X

(time integral of qw)

These encompass, for instance, the increase of the boundary-layer thick­ness, the displacement thickness, the thickness of the viscous sub-layer which governs turbulent skin friction and heat transfer, etc., with increasing wall temperature.

Lowered is the skin friction with increasing wall temperature, for turbu­lent flow stronger than for laminar flow. Increased is the separation disposi­tion with increasing wall temperature. The stabilization/destabilization and the laminar-turbulent transition of the boundary layer depends on both the

temperature gradient in the gas at the wall and the wall temperature. In­fluenced too are wall heat flux, shock wave/boundary-layer interaction, and hypersonic viscous interaction. The latter two, like flow separation, becoming more pronounced with increasing wall temperature. Catalytic surface recom­bination depends on the wall temperature, too.

Regarding materials and structures we note first of all that “thermal loads” encompasses both the wall temperature Tw and the wall heat flux qw. The wall temperature Tw governs the choice of surface material (and coating) in view of strength and endurance (erosion), and dT/dnw, respec­tively the flight-time integral of qw the thickness of the thermal protection system (TPS) of a RV [5].

The Tasks of Aerothermodynamics

The aerothermodynamic design process is embedded in the vehicle design process. Aerothermodynamics has, in concert with the other disciplines, the following tasks:

1. Aerothermodynamic shape definition, which has to take into account the thermal state of the surface, Section 1.4, if it influences strongly via thermal-surface effects the drag of the vehicle (CAV, ARV), the in­let performance, and the performance of trim and control surfaces (all classes):

a) Provision of the aerodynamic data set [7], enabling of flyability and controllability along the whole trajectory (all vehicle classes).

b) Aerothermodynamic airframe/propulsion integration for in particular airbreathing (CAV), but also rocket propelled (RV, ARV) vehicles.

c) Aerothermodynamic integration of reaction control systems (RV, ARV, AOTV).

d) Aerothermodynamic upper stage integration and separation for TSTO space transportation systems.

2. Aerothermodynamic structural loads determination for the layout of the structure and materials concept, the sizing of the structure, and the ex­ternal thermal protection system (TPS) or the internal thermal insulation system, including possible active cooling systems for the airframe:

a) Determination of mechanical loads (surface pressure, skin friction), both as static and dynamic loads, especially also acoustic loads.

b) Determination of thermal loads on both external and internal sur – faces/structures.

c) Determination of the aerothermoelastic properties of the airframe.

3. Definition of the necessary and the permissible surface properties (exter­nal and internal flow paths), see also Section 1.4:

a) The only but deciding “necessary” surface property is radiation emis – sivity in view of external surface-radiation cooling. It governs the thermal loads of structure and materials, but also the thermal-surface effects regarding viscous-flow and thermo-chemical phenomena.

b) “Permissible” surface properties are surface irregularities like rough­ness, waviness, steps, gaps etc. in view of laminar-turbulent transition and turbulent boundary-layer flow. For CAV’s and ARV’s they must be “sub-critical” in order to avoid unwanted increments of viscous drag, and of the thermal state of the surface.[8]

For RV’s surface roughness can be an inherent matter of the layout of the thermal protection system. There especially unwanted incre­ments of the thermal state of the surface are of concern on the lower part of the re-entry trajectory. In this context the problems of micro – aerothermodynamics on all trajectory segments are mentioned, which are connected to the flow, for instance, between tiles of a TPS or flow in gaps of control surfaces. All sub-critical, i. e., “permissible”, val­ues of surface irregularities should be well known, because surface tolerances should be as large as possible in order to minimize manu­facturing cost.

Another “permissible” surface property is the surface catalycity, which should be as small as possible, in order to avoid unwanted in­crements of the thermal state of the surface, e. g., of the wall tempera­ture. Usually the surface catalytic behavior, together with emissivity and anti-oxidation protection are properties of the surface coating of the airframe or the TPS material.

This short consideration shows that aerothermodynamics indeed must be seen not only in the context of aerodynamic design as such. It is an element of the truly multidisciplinary design of hypersonic flight vehicles, and must give answers and inputs to a host of design issues.