Category Basics of Aero – thermodynamics

Qualitative Considerations

We consider in a qualitative way the influence of the thermal state of the surface on some viscous flow properties. These are the viscous thermal surface effects. The results hold in general, i. e., for two-dimensional and for three­dimensional flow.

We treat first—with the help of the reference-temperature concept—the influence of the wall temperature Tw at flat surface portions. Basically we collect a few results from Section 7.2.2 They are ordered as they appeared in Table 1.3 of Section 1.4. It is assumed that all temperatures are above 200 K, such that the viscosity can be approximated with ш = 0.65, eq. (4.15), Sub-Section 4.2.2.

The reference temperature T* is composed of the static temperature at the outer edge of the boundary layer Te, the wall temperature Tw, and the recovery temperature Tr, eq. (7.62) in Sub-Section 7.1.6. The wall temper­ature with 50 per cent has the largest share. We therefore formulate the observations made from Table 10.1 in terms of Tw.

The boundary-layer thickness 6 increases with increasing wall tempera­ture, for the laminar boundary layer stronger than for the turbulent one. The same holds for the displacement thickness 61. The characteristic boundary – layer thickness A, which governs the skin friction and the heat flux in the gas at the wall, for laminar flow is the boundary-layer thickness 6 and for turbulent flow the thickness of the viscous sub-layer 6vs [3]. We note that 6vs increases with increasing Tw much stronger than the laminar boundary-layer thickness 6.[171] [172]

Подпись: Tw Подпись: du ue Подпись: (10.1)

The skin friction is affected according to the increase of the characteristic boundary-layer thickness A. To understand this better, we approximate the skin friction relation by

This approximation shows that an increase of A reduces the skin friction. Because the thickness of the viscous sublayer rises much stronger than that of the laminar boundary layer, the increase of Tw lowers the turbulent skin friction stronger than the laminar one. (Note that the viscosity pw in both cases is the same.)

The relation of the heat flux in the gas at the wall qgw can be treated similarly. We look only at the radiation-adiabatic wall and see that an increase of Tw lowers both qgw and hence also the radiation-adiabatic temperature Tra. Again the influence is much stronger for turbulent than for laminar flow.

Now we consider the tangential velocity profile u(y), Fig. 7.4 c). We ask for the influence of the temperature gradient in the gas normal to the vehi­cle surface dT/dngw. A This influence is similar to that of the stream-wise pressure gradient or that of wall-normal suction or injection (blowing). The discussion of the wall-compatibility conditions in Sub-Section 7.1.5 gives us the clue to that. (We consider the effect of the temperature gradient isolated. If other effects are present, they may increase or weaken it.)

Consider eq. (7.53) for the ж-direction and there the last term on the right-hand side. For the case of a radiation cooled surface, the heat flux in the gas is directed toward the wall (cooling of the boundary layer), hence we have dT/dygw > 0, Sub-Section 4.2.1. Because du/dy > 0 (attached viscous flow), and dp/dT > 0 (we consider air), the heat flux has the same effect as a favorable pressure gradient (dp/dx < 0): the second derivative d2u/dy2y=0 is negative, the boundary-layer profile is fuller than the Blasius profile, case 2 in Fig. 7.4 c). Due to the inverse of the viscosity ahead of the terms on the right-hand side, a high wall temperature reduces the effect, a low one enlarges it.

The negative temperature gradient also affects the stability behavior of the boundary layer. First modes are damped, second modes are amplified, Sub-Section 8.1.4.

If the heat flux is directed away from the wall, dT/dygw < 0 (heating of the boundary layer), the heat flux has the same effect as an adverse pressure gradient has. A point of inflection appears, the boundary layer becomes prone to separation. The effect is stronger for a low wall temperature than for a high one.

Of course also of interest is the distribution of the density p across the boundary layer. In attached viscous flow past surfaces with small curvature at high Reynolds numbers, the pressure p is nearly constant across the boundary layer (first-order boundary layer [3]):

P (y) ~ Pe ~ const., (10.2)

i. e., the pressure is approximately equal to that at the boundary-layer edge. Consequently in the boundary layer

pT = peTe = const., (10.3)

and

poc^. (10.4)

This means that at a hot wall the density is small at and above the wall, and at a cold wall vice versa. The average tangential momentum flux < pu2 > in the boundary layer is affected. At a cold wall this flux is larger than at a hot wall and the boundary layer can better negotiate, for instance, an adverse pressure gradient than a hot one. Also the three-dimensionality of the flow is affected [3].

Viscous Thermal Surface Effects: Examples

The topic of thermal surface effects was introduced in Section 1.4. There the basic concept was explained and qualitative information was given. Quanti­tative information was presented in several of the following chapters. This chapter is devoted to a more in-depth consideration of several additional examples of viscous thermal surface effects.

The examples partly are generic. The problems at real flight vehicles gen­erally will look different. Moreover they will be of different importance on different vehicle trajectory segments. However, thermal surface effects must be identified, their effect be appraised, and finally be taken care of or not.

In the first section we give a short introduction to the topic. The following sections then are dedicated to the discussion of several viscous thermal surface effects, which partly were only recently achieved. A literature review is not intended.

10.1 Introduction

The topic of thermal surface effects principally can be approached only by discussing examples of different kinds.

Viscous thermal surface effects, concerning mainly CAV’s—and ARV’s on their airbreathing trajectory elements—, have many faces. In the next sec­tion qualitative results, essentially from Chapter 7, are presented in a sum­marizing way. An overview of the examples treated in some of the previous chapters follows in Section 10.3. In the following sections then a number of numerical and experimental data—these achieved with different kinds of hot experimental techniques—is discussed in a compact manner. More examples, also concerning multidisciplinary simulation problems, non-convex effects at radiation-cooled surfaces etc., can be found in [1].

Regarding thermo-chemical thermal surface effects, concerning mainly RV’s of all kind, no material was identified for a discussion in the frame of this book.[170] The reason is mainly that too much space would have been needed.

Couplings of stability and transition phenomena with thermo-chemical ef­fects are mentioned in Chapter 8, however not discussed in view of thermal surface effects.

Low-Density Effects

Low-density effects, also called rarefaction effects, occur, if the flow past the hypersonic flight vehicle under consideration—or a component of it—
is outside of the continuum regime, Section 2.3. We have seen in Fig. 2.6, that the hypersonic flight vehicles of the major classes (RV’s and CAV’s) are flying essentially in the continuum regime, at most approaching the slip-flow regime. Therefore we will here only touch the topic of low-density effects. We give some references for a deeper study, show some results connected to the results of the flat plate case shown in Figs. 9.22 to 9.24 of the preceding section, and discuss shortly issues of the viscous shock layer at blunt bodies.

Reviews of and theories about the transition from continuum flow to free molecular flow, especially regarding the intermediate regimes, Section 2.3, can be found in, e. g., [47, 60], [61]—[63].

We have seen in the preceding section that at an infinitely thin flat plate the strong interaction limit lies just downstream of the shock-formation re­gion. We assume that the Navier-Stokes equations are valid in this region, although with slip-flow boundary conditions, Section 4.3. This means, that we have to demand Kn ^ 0.1, Section 2.3. For viscous layers with the thickness 6 in [60] the condition

0.01 < /чи ‘ < 0.1 (9.42)

is proposed.

For Моо/х/Деg/ 0.1 the continuum regime is left. Therefore the part of the flow just downstream of the leading edge, which is marked as “transition regime” in Fig. 9.20, in principle cannot be described by the Navier-Stokes equations.[167]

The fraction in eq. (9.42) is also called rarefaction parameter V:

v = -2b=, (9.43)

Re<x>,x

which together with the Chapman-Rubesin constant Creads

‘ ”.У’. (9.44)

Re<x>,x

which we already met in the preceding section.

H. K. Cheng proposes a Chapman-Rubesin constant [64]

Coo = ^ (9.45)

with the reference temperature

T* = (Tt + ZTw)1 (9.46)

6

which he found from experiments and Monte Carlo simulations. He gives for the end of the slip-flow or shock-formation region V « 0.1, and for the (upstream lying) end of the transition region, where the validity of the Navier – Stokes equations begins, V «0.4.

Now back to the example in the preceding section. The length of the shock-formation region was determined with the criterion [52]

Подпись:^ (Vй)2

sfr ~ 0.12 to 0.32 ’

with Vй = M, xy/C^/^Re%.

Подпись: Fig. 9.25. Non-dimensional wall slip velocity uw (x) [49]. For the symbols see Table 9.7. x = 1 is Lsfr = 6.676 cm downstream of the leading edge, Table 9.6.

At the end of the shock-formation region the wall slip velocity uw is supposed to be nearly zero. Actually it reaches zero only asymptotically, as we see in Fig. 9.25, where uw is non-dimensionalized with uTO.

A visualization of the slip-flow profiles along x is desirable. Because we have no such profiles available from [49], we show them from another study [48], Fig. 9.26. Gas, Mach number and unit Reynolds number are different. The lengths of the shock-formation layer are Lsfr = 6.676 cm (x = 1 in Fig. 9.25) and Lsfr = 46 cm in Fig. 9.26 (x = x/Lsfr). If one scales accordingly the results from Fig. 9.26 into Fig. 9.25, a fair agreement of the wall slip velocity is found.

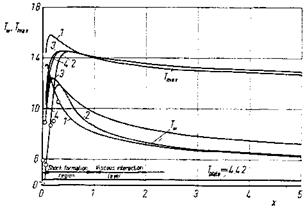
Back to the case shown in Fig. 9.25. We observe that also the wall tem­perature jump only approximately approaches zero, Fig. 9.27, which reflects

Low-Density Effects

Fig. 9.26. Slip-flow boundary-layer profiles и (у/Ay) at different downstream lo­cations x on a flat plate [48]. = 11.18, Re^ = 92.08 m-1, Tw = 292 К, Ab.

Low-Density Effects

Fig. 9.27. Non-dimensional static wall temperature Tw(x) and maximum static temperature Tmax(x) in the viscous layer [49]. For the symbols see Table 9.7.

the results given in Fig. 9.24 (the temperatures are non-dimensionalized with Tro). The temperature of the gas at the wall initially is much larger than the wall temperature.

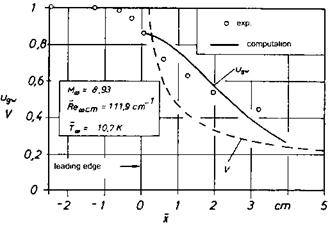
In closing this topic we discuss now some experimental [65] and numer­ical [66] results for the transition region, in particular the highly rarefied hypersonic flow of helium past an infinitely thin flat plate, Table 9.8, which of course in the experiment is realized as plate of finite thickness with a sharp leading edge.[168] From the graph of V (= V) in Fig. 9.28 we see that the Navier-Stokes equations are valid only for x ^ 1.5 cm, if we apply the criterion of H. K. Cheng: V 0.4. The end of the shock-formation region, V « 0.1, lies at approximately x = 22 cm, outside of the scale of Fig. 9.28.

Table 9.8. Free-stream parameters of the hypersonic flat-plate helium flow [65].

M. so

Too [K]

Reoo [1/cm]

Aoo [cm]

T„ [K]

8.92

10.7

111.9

0.1286

296

Low-Density Effects

Fig. 9.28. Comparison of the experimentally determined [65] and computed [66] slip velocity near the leading edge of a flat-plate. ugw is the with unon- dimensionalized slip velocity, V denotes the rarefaction parameter V, о are experi­mental data.

In the experimental data we see clearly an upstream influence of the plate’s leading edge. The initial data for the computation were taken from measured flow profiles, but obviously they are not consistent, because uw does not decrease monotonically with x as it should be expected.

The accommodation coefficients employed in the computation [66] for the tangential momentum, a, and for the energy, a, were derived in [65] with the help of second-order conditions [67]. They are initially small and increase with increasing x, and show partly wrong tendencies. This is probably due to the fact, that at the large degree of rarefaction in the leading-edge region no Maxwellian distribution exists. Hence the mean free path Xgw at the surface of the plate is only approximately representative for the determination of the accommodation coefficients.

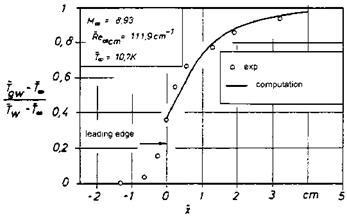
The computed temperature jump, however, compares rather well with the experimental data, Fig. 9.29. Near the leading edge the computed data are somewhat smaller than the measured data, which also points to inconsisten­cies in the initial data. Further downstream the solution also away from the plate’s surface shows some deficiencies despite the good agreement at the wall

Low-Density Effects

Fig. 9.29. Comparison of the experimentally determined [65] and computed [66] wall temperature jump near the leading edge of a flat-plate. Tgw is the temperature of the gas at the wall, Tw the surface temperature of the flat plate, Tthe static free-stream temperature, о are experimental data.

We conclude that the transition from the disturbed molecular flow regime to the slip-flow regime at the flat plate can approximately be described with the help of the Navier-Stokes equations. However, depending on the problem at hand, the validity of such an approach must be verified.

The counterpart of the flow past an infinitely thin flat plate is the flow past a blunt body. We are interested in the front part of the blunt body. Here two Knudsen numbers are to be considered [68]. The first is formulated in terms of the bow-shock stand-off distance A0, Fig. 6.19, and the second

in terms of the boundary-layer thickness S. As long as for both Knudsen numbers holds

Подпись: (9.48)Kns = ^ < 0.01,

Ao ~ ’

and

Knbl = ^ < 0.01, (9.49)

S

the flow at the front part of the blunt body is a continuum flow. Of course, then also S < Aq.

We have noted before that a shock wave has a finite thickness of a few mean free paths, say Ss « 8 ATO, see Fig. 6.17 in Sub-Section 6.3.3. We are in the slip-flow regime, if either

0.01 < Kns < 0.1, (9.50)

or

0.01 < Knbl < 0.1. (9.51)

In this regime the boundary layer will be no more thinner than the shock layer/shock stand-off distance

S < 0(Aq), (9.52)

which holds also for the bow-shock wave

Ss < O(Aq). (9.53)

At still larger Knudsen numbers the shock layer ahead of the blunt body becomes a “merged layer”. In analogy to the shock-formation layer at the flat plate, the merged layer regime at the blunt body is defined by both a non-distinguishable bow-shock wave and a non-distinguishable boundary layer, the latter with slip-flow and temperature jump at the body surface. The Rankine-Hugoniot conditions are not valid in this case.

The flow field in the slip-flow regime is also called “viscous shock layer” [69]. It encompasses the thick boundary layer with Navier-Stokes slip-flow conditions, see, e. g., [70] and an inviscid flow portion between the bow-shock wave and the boundary layer.[169] The “thick” bow-shock wave is still consid­ered as a field discontinuity, however, shock-slip conditions must be applied [69, 71].

Viscous shock layers can be described by a system of governing equations of parabolic/hyperbolic type in space. Numerical methods based on these

equations are a cheap alternative to the Navier-Stokes methods, although their applicability is limited, see, e. g., [72].

Slip flow and temperature jump, at least at blunt bodies with cold sur­faces, are usually small. However, the wall pressure can appreciably be af­fected by low-density effects. Approximate theories as well as experimental data about blunt and other bodies in the slip-flow regime can be found in, e. g., [47, 60, 68].

9.3 Problems

Problem 9.1. In Fig. 9.18 a reference pressure coefficient cP0 = 1.8275 is given. How large is the coefficient at the stagnation point, cPs, of the blunt body (symmetric case, perfect gas) for Мо = a) 8.03, b) to? Assume perfect gas. Why are these values so close to each other. Formulate the principle in the background.

Problem 9.2. Assume that cp of Problem 9.1 can be considered as constant above Мо = 6 and for perfect gas chosen to be cPs = 1.839. How large is the actual wall pressure (perfect gas) at the stagnation point, ps in terms of ро for Mо = a) 6, b) 8.03, c) 10 d) to? Discuss this result and quantify the excess pressure in the Edney type IV interaction case, Fig. 9.18.

Problem 9.3. How large is the Mach number normal to the shock wave, MON, of the hypersonic argon flat-plate flow at x (= x/Lsfr) = 2, Fig. 9.21? Are the flat-plate results acceptable?

Problem 9.4. Compute the interaction parameter and the rarefaction parameter V for the argon flat-plate flow at x (= x/Lsfr) = 1. Assume jargon ж T0’75. How large is xCT«?

Problem 9.5. Compute at x = 1 m the interaction parameter the rar­efaction parameter V, and the critical length хсгц for the CAV data given in Table 7.9. Assume laminar flow, Tw = 1,500 K as wall temperature (hot wall), and pair ж T1165.

Problem 9.6. Compute at x = 1 m the interaction parameter the rar­efaction parameter V, and the critical length хсгц for a CAV flying with Мо = 10 at 50 km altitude. Assume laminar flow, Tw = 1,500 K as wall temperature (hot wall), and use eq. (4.15) to determine pair.

Hypersonic Viscous Interaction

If attached viscous flow is of boundary-layer type, we can treat the inviscid flow field and the boundary layer separately, because we have only a weak interaction between them, Chapter 7.[164] In Sub-Section 7.1.7 we have seen, however, that for large Mach numbers and small Reynolds numbers the at­tached viscous flow is no more of boundary-layer type. We observe in such flows, for instance that past a flat plate, just downstream of the leading edge a very large surface pressure, which is in contrast to high-Reynolds number boundary-layer flows, where the surface pressure indeed is the free-stream pressure. This phenomenon is called “hypersonic viscous interaction”. We use the flow past the infinitely thin flat plate, the canonical case, to gain a basic understanding of the phenomenon.

Hypersonic viscous interaction can occur at sharp-nosed slender bodies and, of course, also at slender bodies with small nose bluntness, i. e., on CAV’s, and can lead to large local pressure loads and, in asymmetric cases, also to increments of global forces and moments. In [47] this interaction is called “pressure interaction” in contrast to the “vorticity interaction”, which is ob­served at blunt-nosed bodies only. We have met the latter phenomenon in the context of entropy-layer swallowing, Sub-Chapter 6.4.2.

The cause of hypersonic viscous interaction is the large displacement thickness of the initial “boundary layer”, which makes the free-stream flow “see” a virtual body of finite thickness instead of the infinitely thin flat plate. Consequently the incoming flow is deflected by the virtual body, a pressure gradient normal to the surface is present, eq. (7.76) in Sub-Section 7.1.7, and a slightly curved oblique shock wave is induced. Actually this shock appears at the end of the shock-formation region (in the classical terminology this is the “merged layer”).

We depict this schematically in Fig. 9.20 [48]. The end of the shock – formation region is characterized by the separation of the emerging shock wave from the viscous flow, which then becomes boundary-layer like. Since the oblique shock wave is slightly curved, the inviscid flow between it and the boundary layer is rotational. In Fig. 9.20 also slip flow and temperature jump are indicated in the shock-formation region. As we will see in Section 9.4, attached viscous flow at large Mach numbers and small Reynolds numbers can exhibit such low density effects.

Before we discuss some interaction criteria, we illustrate the flow phenom­ena in the shock-formation region and downstream of it [49]. The data shown

Hypersonic Viscous Interaction

Подпись: 14in the following figures were found by means of a numerical space-marching solution of eqs. (7.74) to (7.77), where the pressure-gradient term in eq. (7.75) has been omitted, because the criterion eq. (7.87) holds

These equations are solved for the whole flow domain including the oblique shock wave, whose structure is fully resolved. This is permitted, because the shock angle в is small everywhere, Sub-Section 6.3.3.

Подпись: 15The free-stream parameters are those of an experimental investigation of hypersonic flat-plate flow with argon as test gas [51], Table 9.6.[165] The length of the shock-formation region Lsfr (= L in Fig. 9.20) was found with the criterion eq. (9.47) given by L. Talbot [52], Section 9.4. The stream-wise coordinate x is made dimensionless with it. The viscous interaction region thus is present at x A 1.

Table 9.6. Free-stream parameters of the hypersonic flat-plate argon flow with viscous hypersonic interaction [51, 49].

ДА»

ТА [К]

Яе’А [1/cm]

Ас» [cm]

Tw [К]

Lsfr [cm]

12.66

64.5

985.45

0.021

285

6.676

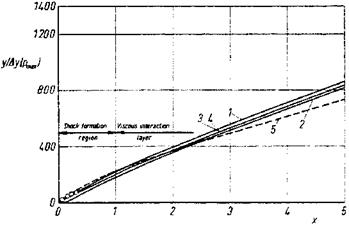
The thickness 5 of the computed initial viscous layer can be set equal approximately to the location of the pressure maxima in direction normal to the plate’s surface, which are shown in Fig. 9.21. The Knudsen number, Kn = 5/Аж, then is Kn « 0.125 at x = 0.1 and Kn « 0.0125 at x = 1. Thus also the Knudsen number shows that we are in the slip flow regime for 0.1 A x A 1, and in the continuum regime for x A 1, Section 2.3. In Fig. 9.20 the transition regime—where the flow is becoming a continuum flow— is schematically indicated downstream of the leading edge. In this area the use of the Navier-Stokes equations is questionable, but experience shows that these equations can be strained to a certain degree.

One may argue that strong interaction effects and low-density effects are mixed unduly in this example. However at an infinitely thin flat plate we always have this flow situation just behind the leading edge, even at much larger Reynolds numbers as we have in this case.

Because we are in the slip-flow regime, too, the slip-flow boundary con­ditions, eq. (4.45) in Sub-Section 4.3.1 without the second term, and eq. (4.79) in Sub-Section 4.3.2, are employed. In [49] the influence of the choice of the reflection/accommodation coefficients a and a was investigated, hence the following figures have curves with different symbols, which are specified in Table 9.7. Also the symbols for the strong-interaction limit [53] and the experimental results from [51] are given there.

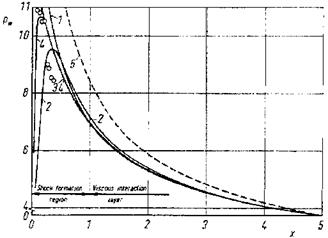
We discuss now some of the results in view of hypersonic viscous inter­action. Fig. 9.22 shows the static pressure pw at the surface of the flat plate non-dimensionalized with the free-stream pressure pTO. The measured data reach in the shock-formation region a maximum of pw « 11, i. e., the pres­sure is there eleven times larger than the free-stream static pressure. The pressure decreases with increasing x in the viscous interaction region. At x

Hypersonic Viscous Interaction

Fig. 9.21. Location of the maximum static pressure in y-direction as function of x = x/Lsfr (Lsfr = 6.676 cm, Ay = 0.00817 cm) [49]. For the symbols see Table 9.7.

Table 9.7. Symbols used in the figures [49].

Symbol

a = a

1

і

2

1 – 0.6e-6x

3

0.825

4

0.825 – 0.425e~6Cte

5

strong-interaction limit [53]

О

experiment [51]

= 5 the pressure is still four times pThe agreement between measured and computed data is reasonably good for the curves 3 and 4, the strong interaction limit lies too high for x ^ 5, which probably is due to the choice of the exponent in the power-law relation of the viscosity in [49].

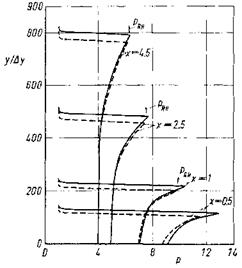
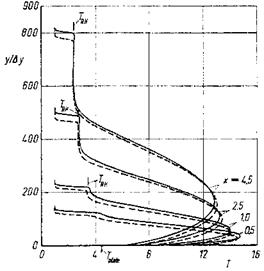
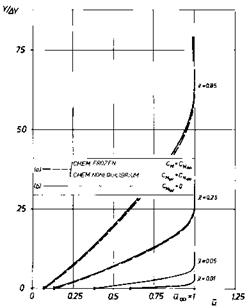
Very interesting are some features of the flow field, in particular the y – profiles of the static pressure p, Fig. 9.23, and the static temperature T, Fig. 9.24, at different x-locations on the plate. The pressure increase from the undisturbed side of the flow (from above in the figure) and the pressure maximum at the top of each curve in Fig. 9.23 indicate for x ^ 1 the high pressure side of the oblique shock wave, which is fully resolved. With the help of the locations of the pressure maxima in the y-direction, Fig. 9.21, the shock angle в as function of x can be determined, too. It is possible then

Hypersonic Viscous Interaction

Fig. 9.22. Non-dimensional static pressure pw(x) at the plate’s surface [49]. For the symbols see Table 9.7.

to compute with eq. (6.86) the Rankine-Hugoniot pressure jump across the shock wave, which is indicated for each curve in Fig. 9.23, too. This pressure jump is well duplicated for x ^ 1. We see also for x ^ 1 the pressure plateau (zero normal pressure gradient) which indicates that the flow there indeed is of boundary-layer type. For x ^ 1 this does not hold. We are there in the shock-formation region, where we even cannot speak of a shock wave and a boundary layer because they are effectively merged.

All this is reflected in the у-profiles of the static temperature in Fig. 9.24. The temperature there is non-dimensionalized with TTO. The temperature rise in the shock wave compares well for x ^ 1 with the Rankine-Hugoniot temperature jump, found with eq. (6.85). For x ^ 1 we see also the typical temperature plateau between the (thermal) boundary layer and the shock wave, which coincides with the non-constant portion of the pressure field. In the boundary layer we find the temperature maxima typical for the cold-wall situation, however with the initially strong wall temperature jump which can appear in the slip-flow regime. For x ^ 1, in the shock-formation region, again neither a boundary layer nor a shock wave are identifiable.

The classical hypersonic viscous interaction theory, see, e. g., [47], assumes that a boundary layer exists, whose displacement properties (displacement thickness 5i(x)) induce an oblique shock wave. This means that the boundary layer, downstream of the shock-formation region, is considered as a (convex) ramp, Fig. 6.9, however with a flow deflection angle 5defi which is initially large and then decreases in downstream direction:

dSi. .

tun ddefl = — (x). (9.5)

Hypersonic Viscous Interaction

Hypersonic Viscous Interaction

Fig. 9.23. Profiles of the non-dimensional static pressure p(y) at different locations x [49]. Full lines: a = a = 1, broken lines: a = a = 0.825, RH = Rankine-Hugoniot.


Hypersonic Viscous Interaction

Fig. 9.24. Profiles of the non-dimensional static temperature T(y) at different locations x [49]. Full lines: a = a = 1, broken lines: a = a = 0.825, RH = Rankine – Hugoniot.


Подпись: Jdefl Подпись: Ml в2 - 1 Ц±м2в Подпись: (9.6)

The flow deflection angle 5defi can be expressed with the help of eq. (6.114) as a function of the Mach number Mi, the shock angle в, and the ratio of the specific heats 7. We assume small deflection angles Sdefl and small shock angles в, because M ^ 1, and reduce eq. (6.114) to

Hypersonic Viscous Interaction Подпись: 0. Hypersonic Viscous Interaction

Eq. (6.86), which describes the pressure jump across the oblique shock, reads, also for small angles в

We met in Section 6.8 the hypersonic similarity parameter K, which we identify now in the denominator of the last term:

Подпись: (9.9)K = M5defl

Подпись: Ml в2 Подпись: 7+1 7+1 2 4 + Подпись: 7 + 1 4 Hypersonic Viscous Interaction Подпись: K2 + 1. Подпись: (9.10)

Solving eq. (9.8) for e/Sdefl, substituting M15defl by K, and putting back the solution with positive sign of the radical into eq. (9.8) gives

Подпись: Pe p<x> Hypersonic Viscous Interaction Подпись: 7 + 1 4 Hypersonic Viscous Interaction Подпись: K2. Подпись: (9.11)

In the classical hypersonic viscous interaction theory the pressure p2 be­hind the oblique shock wave is assumed to be the pressure pe at the edge of the boundary layer. In view of Fig. 9.23 this is not correct. The pressure drops considerably in negative у-direction, however downstream with decreas­ing strength, before the plateau of the boundary-layer pressure is reached. Despite this result, we stick here with the classical theory, substitute on the left-hand side of eq. (9.7) p2/p by pe/pand introduce eq. (9.10) to finally obtain the pressure increase due to the displacement properties in terms of the hypersonic similarity parameter eq. (9.9)

We have now to express the boundary-layer displacement thickness Ji, eq. (7.114), in terms of the interaction pressure pe. Assuming flow past an

Подпись: Si Hypersonic Viscous Interaction Подпись: poo ft P*P oo’ Подпись: (9.12)

infinitely thin flat plate at zero angle of attack, we write with the reference – temperature extension, Sub-Section 7.1.6

Подпись:pOuOx/pO. Without viscous interaction we would have in

Подпись: (9.13)Poo, _ T*

* P’I’=Pqo rjl •

P T O

However, with viscous interaction we get

Подпись:Poo I _ T* p, x

O* ‘pt=p‘ ~ T D *

P T O pe

Подпись: P_ Hypersonic Viscous Interaction Подпись: (9.15)

Following [54] we assume a linear relationship between the viscosity ratio and the temperature ratio

Подпись: pw Подпись: C Подпись: (9.16)

and choose CO according to the boundary-layer situation:

With p = const. in the boundary layer, see Fig. 9.23, we obtain finally the Chapman-Rubesin linear viscosity-law constant

Подпись:pw TO pxTw

Подпись: Si Hypersonic Viscous Interaction Подпись: CO Подпись: 2M2 'Px T.x ) Pe Подпись: (9.18)

This gives then for the displacement thickness a reference temperature extension of the form

Hypersonic Viscous Interaction Подпись: (9.19)

The classical hypersonic viscous interaction theory assumes T*/TO ж M2 [47]. With that we get a Mach number dependence in analogy to the Mach number dependence of the boundary-layer thickness at an adiabatic wall, eq. (7.103)

and its x-derivative

dd ^ Mоо"/ Coo I Poo

Подпись:dx !!’ .., V /’

In [55] and [56] it is shown, see also [47], that the pressure interaction can be described for two (asymptotic) limits on, for instance, a flat plate. These are the strong and the weak interaction limit. In the strong interaction limit the streamline deflection in the viscous layer is large and hence also the induced pressure gradient across the viscous layer. In the weak interaction limit the streamline deflection is small and hence also the induced pressure gradient.

We treat first the weak interaction limit, where dSjdx is small, hence K < 1, and K2 ^ 1. From eq. (9.11) we get for the pressure, which we interpret now as the induced wall pressure pw:

— = 1 + jK. (9.21)

Рж

Подпись: K Подпись: Ml Подпись: (9.22)

With pe к рж and tanSdefi = Sdefl = dS/dx, the hypersonic similarity parameter becomes

.x

Подпись: X Подпись: M 3 1 -Loo I*1 ■ . X Подпись: (9.23)

It is now called viscous interaction parameter and written either as

Подпись: X Подпись: M3 Подпись: (9.24)

or as

.x

Подпись: Pw Рж Hypersonic Viscous Interaction Подпись: 1 + 3.35— Tt Подпись: X. Подпись: (9.25)

For the infinitely thin flat plate we get from [47, 57] the pressure in the weak interaction limit with Pr = 0.725:

This result shows us that the pressure in the weak interaction limit is рж disturbed by a term of approximately 0(x). For the cold wall, Tw/Tt +C 1, and we get with 7 =1.4 for air

— = l + 0.081x. (9.26)

Рж

Подпись: Pw Рж Подпись: 1 +0.31х + 0.05у2. Подпись: (9.27)

For the hot wall, Tw к Tt, W. D. Hayes and R. F. Probstein retain a term 0(x2) and arrive at the second-order weak interaction result [47]

Подпись: Xturb Подпись: Re TO,x Подпись: 0.2 Подпись: (9.28)

In hypersonic flow viscous interaction is a low Reynolds number phe­nomenon, hence we have so far tacitly assumed that the flow is laminar. However in turbulent flow past slender configurations viscous interaction can happen, if the transition location is close enough to the nose region. In this case the interaction parameter for the weak interaction limit reads [58]

1 + 1.3 (Tw/Tt)

[1 + 2.5(TW/Tt)]0-6

Подпись: Pw PTO Подпись: 1+0.057 Подпись: Xturb Подпись: (9.29)

At the infinitely thin flat plate the pressure in the turbulent weak inter­action limit is, with Pr = 1 and 7 = 1.4

In the strong interaction limit, now again for laminar flow, we have dJi/dx large and therefore K2 ^ 1. Eq. 9.11 becomes then

Подпись: (9.30)P^_ = l+ + l) K2 _ 7(7+ Од-2

Pco 2 ~ 2

Hypersonic Viscous Interaction Подпись: (9.31)

Because in the strong interaction region pe = pTO, we substitute first of all pTO/pe in eq. (9.19) with the help of eq. (9.30) in order to obtain a relation for Jp

where ReU, = pTOuTO/pTO is the unit Reynolds number. This equation is integrated to yield

(9.32)

Подпись: Ji Hypersonic Viscous Interaction Подпись: (9.33)

respectively

We note in passing that the term in brackets resembles the square root of the co-factors in the у-momentum equation (9.3).

We differentiate now Ji, eq. (9.33), with respect to x and put the result into eq. (9.30) to find finally

Подпись: (9.34)Подпись: X.pe,l:{ f ‘. oc —

pTO ReTO, x

This results shows that in the strong interaction region the induced pres­sure pe is directly proportional to y, and hence falls approximately oc ж-0’5 in

the downstream direction, see Fig. 9.22. The displacement thickness Si and hence also the thickness of the viscous layer S is ж x0 75, eq. (9.33), compared to ж x0 5 in the weak interaction regime.

The interaction parameter V, arising if the hypersonic viscous interaction effect is described in terms of the pressure coefficient cp, eq. (6.32), is16

which is then combined with eq. (9.34).

Finally we consider the consequences of our results. The viscous interac­tion parameters у or К can be employed to check whether strong interaction can appear on a configuration,17 or to correlate locally pressure, skin friction or the thermal state of the surface on both CAV’s and RV’s, see, e. g., [59].

If the check by means of one of the interaction parameters shows that the occurrence of strong hypersonic viscous interaction is likely, numerical or ground-facility simulation must be employed to quantify it to the needed degree of accuracy.18 In ground-simulation facilities this will be a matter of Mach number, Reynolds number and Tw/Tx similarity. Numerical simulation is no problem for laminar flow. If the flow is turbulent, the transition loca­tion can be of large influence, except probably for local hypersonic turbulent viscous interaction effects at inlet ramps etc. [23].

Hypersonic Viscous Interaction
For the infinitely thin flat plate J. H. Kemp obtains for the wall pressure in the strong interaction limit [53]

While applying the interaction criteria one has to keep in mind their x – dependence, which we write explicitly

Подпись: xuПодпись: (9.40)_ ,i/:; d’. і

у =——————-

/<*’ ;

where xu is the unit interaction parameter.

Подпись: xcrit Hypersonic Viscous Interaction Подпись: 2 Подпись: (9.41)

Strong interaction occurs if is larger than a critical value xcrit■ This can be due to a large value of Ыж combined with a small value of Re^ (Cx usually being of O(1)), or with given Ыж and Re^ for a small value of x. In this case we find the strong interaction limit for x < xcrit, with xcrit being

and likewise the weak interaction limit for x > xcrit.

From eqs. (9.26), (9.27), (9.36), and (9.37) we can deduce critical values for the infinitely thin flat plate in air with 7 = 1.4, if we take p ^ 2 рж as criterion:[166]

— weak interaction:

cold wall: у < Xcrit ~ П, hot wall: у < xcrit « 3,

— strong interaction:

cold wall: у > Xcrit ~ 13, hot wall: у > Xcrit ~ 4.

Applying the hot wall strong interaction criterion to the flat plate case shown in Figs. 9.22 to 9.24, we find with the flow parameters from Table 9.6 the critical length xcrit = 180.1 cm. This, however, appears to be somewhat large in view of the numerical data. We have assumed for argon p ж T0 75, which holds for 50 K ^ T ^ 500 K.

We apply finally the strong interaction criterion to the flow (laminar) past the SANGER forebody, Section 7.3. From Table 7.9 we take the flow param­eters and choose from Fig. 7.10 the wall temperature in the nose region to be Tw « 1,500 K. We find then, assuming p ж t0 65, eq.(4.15), the critical length xcrit = 0.002 m, which shows that no strong hypersonic viscous interaction phenomena are to be expected at the SANGER forebody.

Nose/Leading-Edge-type (Edney Type IV and III) Interaction

Shock/shock interaction (with associated boundary-layer interaction) of Ed­ney type IV, Fig. 9.15, is the most severe strong-interaction phenomenon. The type III interaction is less severe. Both can pose particular problems for instance at inlet cowl lips, Fig. 6.6, but also at unswept pylons, struts etc., because they can lead to both very large and very localized thermal and pressure loads.

We discuss some computational results for type IV interaction found on a cylinder [41]. The flow parameters are given in Table 9.5. They are from the

Nose/Leading-Edge-type (Edney Type IV and III) Interactionbow shock

contact discontinuities („slip lines’“)

shock

impinging

shock

supersonic jet with isentropic expansion and compression regions

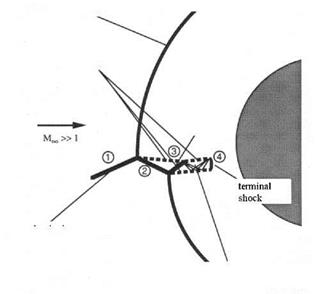
Fig. 9.15. Schematic of the Edney type IV shock/shock boundary-layer interaction

[41].

experiment of A. R. Wieting and M. S. Holden [42], supplemented in [41] by data from [43]. For a review and data see Holden et al. [44], and for a recent numerical study, e. g., [45].

Table 9.5. Flow parameters of the Edney type IV shock/shock boundary-layer interaction on a cylinder (D = 76.2 mm) computation case, air, laminar flow [41].

Moo

Too [K]

Poo [kg/m3]

R&D, oo

Tw [K]

в imp П

7

8.03

122.11

0.0245

387,500

294.44

18.11

1.4

Consider the flow structures shown in Fig. 9.15. The basic flow field can be characterized by a smooth bow shock, whose distance from the surface of the cylinder can be estimated with the help of eq. (6.123) in Sub-Section 6.4.1 to be A0 « 0.23 Rb. The impinging shock wave with the shock angle 9imp = 18.11° divides the free-stream flow ahead of the cylinder into two regimes.

The upper regime (1), above the impinging shock, contains the original undisturbed flow. The lower regime (2), below the impinging shock, contains an upward deflected uniform “free-stream” flow with a Mach number Mdefl = 5.26, which is smaller than the original MTO. The flow-deflection angle, which
is identical with the ramp angle that causes the impinging oblique shock (the boundary-layer displacement thickness on the ramp being neglected), is S = 12.5°.

In the lower regime the “free-stream” flow has a density pdeft = 3.328рж. The density increase across a normal shock then would be p2,defl/рж = 16.91, compared to p2,orig/рж = 5.568. (2,orig (= 2,original) denotes the values behind the bow shock without the interaction.) This would give with eq. (6.123) for the isolated deflected flow a shock stand-off distance A0,defi & 0.1 Rb.

Of course, eq. (6.123) cannot be applied in our problem to estimate the shock stand-off distances in the upper and the lower regime. However, the ratio of these, found with the help of eq. (6.123) (A0,defl/А0,orig & 0.44), and that of the smallest computed stand-off distances measured in Fig. 9.16 (A0,defi/А0,orig & 0.5), are not so far away from each other.

Nose/Leading-Edge-type (Edney Type IV and III) Interaction

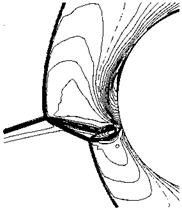
Fig. 9.16. Computed Mach number isolines of the Edney type IV shock/shock boundary-layer interaction [41].

Edney’s different interaction types are characterized by the location in which the impinging shock wave meets the bow shock of the body. If this point lies rather low then two shocks of different families meet and cross each other, see Fig. 6.15 b). This is the type I interaction. Our type IV interaction case obviously is characterized by an intersection of shocks of the same family near the location where the original bow shock lies normal to the free-stream, Figs. 9.15 and 9.16, although this is not fully evident from the figures. Actually the finally resulting pattern shows two of these intersections of shocks of the same family, each well marked by the emerging third shock and the slip line.

Between these two slip lines, Fig. 9.15, a supersonic jet penetrates deep into the subsonic domain between the deformed bow shock and the body sur­face. The final, slightly curved, normal shock, Figs. 9.15 and 9.16, equivalent to a Mach disk in a round supersonic jet, leads to a large density increase close to the body surface.

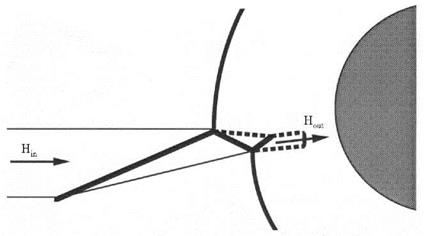
The supersonic jet has a particular characteristic, Fig. 9.17. It captures, due to the upward deflection of the flow behind the impinging shock wave by 6 = 12.5° in the lower regime, a considerable total enthalpy flux (puht)Hin, which then is discharged by the final normal shock towards the body surface (Hout ~ 0.2Hin).

Nose/Leading-Edge-type (Edney Type IV and III) Interaction

Fig. 9.17. Hight of the capture area, Hin, and of the discharge area, Hout, of the supersonic jet in a Edney type IV shock/shock interaction [41].

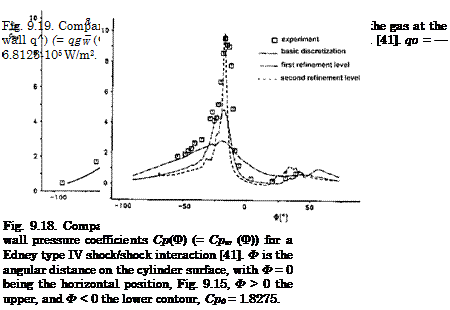
Because of this concentrated enthalpy flux, and the close vicinity of the final, slightly curved normal shock to the surface, a very localized pressure peak results as well as a very large heat flux in the gas at the (cold) wall, Figs. 9.18 and 9.19.

The maximum computed pressure in the stagnation point at the cylinder surface is pw « 775 px, and the maximum density pw « 310 pTO. The large heat flux in the gas at the wall is due to the locally very small thickness of the thermal boundary layer, 6T, which in turn is due to the large density there [36].

The maximum computed pressure coefficient cp/cp0 « 9.4 is somewhat higher than the measured one. The computed heat flux meets well the mea­sured one. The reference data cp0 and q0 are the stagnation-point data for the flow without the impinging shock. The agreement of computed and measured data is not fully satisfactory. In any case a very strong local grid refinement was necessary parallel and normal to the cylinder surface in order to capture the flow structures.

Nose/Leading-Edge-type (Edney Type IV and III) Interaction
Another problem is the slightly unsteady behavior found both in the com­putation (the computation in [41] was not performed with a time-accurate code) and in the experiment. Similar observations and a more detailed anal­ysis can be found in [45]. In [36, 46] results are given regarding the wall pressure, the heat flux in the gas at the wall, and the radiation-adiabatic temperature for the Edney interaction types III, IV and IVa, the latter be­ing a there newly defined interaction type due to high-temperature real-gas

effects. The results show that in all cases the type IV interaction gives the highest pressure and heat transfer peaks, but that no sharp boundaries exist between the various interaction types.

Ramp-Type (Edney Type VI and V) Interaction

We study first the control-surface/inlet-ramp problem and discuss a few crit­ical modeling items with the help of results of mainly computational simu­lations for two-dimensional flat-plate/wedge flows, which we for convenience call simply ramp flows.[158]

Basic experiments on laminar and turbulent supersonic and hypersonic flows of this kind were performed by M. S. Holden, who established the in­fluence of the main parameters ramp angle, Mach number, and Reynolds number [27].

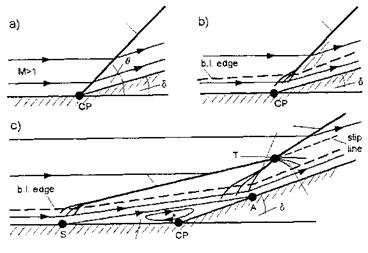
The basic flow phenomena of separated ramp flow are shown schematically in Fig. 9.6 c). The flow field is very complex compared to that of the inviscid flow case, Fig. 9.6 a), where we have simply the flow deflection through an oblique shock, addressed in Sub-Section 6.3.2, Fig. 6.9, and that of the non- separated viscous flow case, Fig. 9.6 b). Note here that the shock wave reaches down into the supersonic portion of the boundary layer.

The interaction shown in Fig. 9.6 c) is a Edney type VI interaction.[159] The flow field harbors three shocks. The separation shock, induced by the flow deflection due to the separation regime, and the inner reattachment shock, induced by the final reflection of the flow at the ramp do not cross each other, because they belong to the same family, see Sub-Section 6.3.2. They meet in the triple point T and form a single stronger shock, the outer reattachment shock. A slip line and an expansion fan originate at the triple point T. In the turbulent flow case a basically similar flow field results.

The upstream influence of the ramp increases with increasing ramp angle, decreases with increasing Mach number, and is affected by the Reynolds number, however only weakly in turbulent flow. The length of the separation region, Fig. 9.6 c) (distance between the locations A and S), which is a measure of the strength of the interaction, increases with increasing ramp angle and decreases with increasing Mach number. In general laminar and turbulent flows are affected in the same way, the interaction being weaker for turbulent flows. Bluntness of the leading edge of the flat-plate/wedge configuration reduces the pressure and the heat flux in the gas at the wall.

Подпись: shock
Подпись: shock
Подпись: reattachment shock
Подпись: separation shock
Подпись: expansion fan

Ramp-Type (Edney Type VI and V) Interactionseparation region

Fig. 9.6. Schematics of two-dimensional flows over a ramp (flat plate/wedge) con­figuration: a) inviscid flow, b) viscous flow with non-separating boundary layer, c) laminar viscous flow with (local) separation. S denotes the separation point, A the reattachment point, T the triple point, and CP the corner point.

Example: Two-Dimensional Laminar Flow. We discuss now results of a 15° laminar ramp-flow case, which was investigated computationally for dif­ferent wall temperatures [28]. The radiation-adiabatic surface was included, however without non-convex effects, Sub-Section 3.2.5. The flow parameters are given in Table 9.2.

Table 9.2. Flow parameters of the ramp computation cases [28].

Case

Moo

T° (= Tt) [K]

Rzta [l/m]

7

I

7.7

1,500

4.2-106

1.4

II

7.4

2,500

4.0-106

1.4

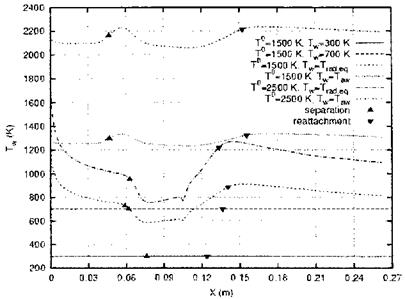
Fig. 9.7 gives the computed Tw(x) for two radiation-adiabatic cases (Trad. eq = Tra) with the total temperatures (T0 = Tt = 1,500 K and 2,500 K), as well as two adiabatic wall cases for the same total temperatures. Two pre­scribed isothermal wall temperatures, Tw = 300 K and 700 K are indicated, too.

The computations in [28] were made assuming perfect gas, although the total temperatures are large. The two adiabatic results are varying with x, each having a first weak maximum shortly downstream of the separation

Ramp-Type (Edney Type VI and V) Interaction

Fig. 9.7. Wall temperature distributions Tw (x) on a ramp configuration and sep­aration and attachment points [28]. Ramp angle S = 15°, the corner point of the ramp lies 10.5 cm downstream of the sharp leading edge, T0 = Tt, Trad. eq = Tra.

point, and a second weaker maximum shortly downstream of the reattach­ment point.[160]

The radiation-adiabatic temperatures ahead of the separation points be­have as expected for flat-plate laminar flow (Tra ж ж~0Л25), Sub-Section 3.2.1. Downstream of the reattachment points, however, they follow that trend only approximately. Their ratio does not scale well, Sub-Section 3.2.6.

Both radiation-adiabatic temperatures (Trad, eq = Tra) lie well below their respective adiabatic temperatures and are strongly dependent on x. Neither the adiabatic temperatures (Taw = Ta) nor constant wall temperatures would be representative for them. The well pronounced dips in the separation re­gions indicate an enlargement of the characteristic thicknesses A, eq. (3.15). The subsequent rise to larger temperatures in both cases is due to the rise of the unit Reynolds numbers downstream of the interaction zones, Section 6.6, which leads to a thinning of the boundary layer.

The distance of the separation point from the leading edge is largest for Tw = 300 K. For Tw = 700 K it is shorter, but nearly the same as that for the two radiation-adiabatic cases. For the two adiabatic cases it is even shorter. Here also the separation length is largest, while it is similar for the two radiation-adiabatic cases and the Tw = 700 K case. It is shortest for Tw = 300 K.[161]

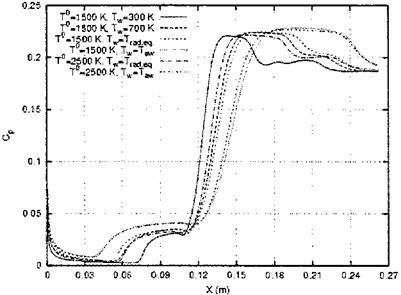
This all is reflected in the pressure-coefficient distributions in Fig. 9.8, each having a pronounced increase at the separation location (due to the separation shock, Fig. 9.6 c)) and in the reattachment region (due to the reattachment shock, Fig. 9.6 c)). The pressure has in each case also a rel­ative maximum at the leading edge which is a result of hypersonic viscous interaction, Section 9.3. It drops then for all wall-temperature cases, the two adiabatic wall cases showing the smallest drop. These have also the most upstream located separation points, the largest and highest pressure plateau ahead of the corner point and then the smallest slope, but again the largest pressure plateau behind the reattachment point. The maximum pressures there are nearly the same for all cases. The separation point for the Tw = 300 K case lies closest to the corner point, the pressure rises then with the steepest slope to the smallest and lowest plateau. Then again it rises most steeply to the smallest plateau behind the reattachment point. The two radiation-adiabatic cases and the Tw = 700 K case lie close together with slightly different plateau extensions behind the reattachment points.

Ramp-Type (Edney Type VI and V) Interaction

Fig. 9.8. Wall pressure distributions cp(x) on a ramp configuration as function of the surface temperature [28]. Ramp angle S = 15°, the corner point of the ramp lies 10.5 cm downstream of the sharp leading edge, T0 = Tt, Trad. eq = Tra.

We see from these results that the surface temperature indeed is an important parameter. Whether it can be correlated with the help of the Reynolds number with reference-temperature extension, Sub-Section 7.1.6, has not been established yet. Of course, high-temperature real-gas effects play a role, too, and so does the state of the boundary layer, if the flight occurs at altitudes where laminar-turbulent transition occurs.

Finally it is a question how the different pressure distributions due to dif­ferent surface temperatures affect the flap effectiveness. In [29], for instance, this was investigated for a FESTIP RV configuration. The flow past the body contour in the symmetry plane, i. e., a two-dimensional flow, with blunt nose, angle of attack (a = 19.2°) and deflected body flap (S = 5° to 30°) was sim­ulated with a thermal and chemical non-equilibrium Navier-Stokes/RANS solver for the Ыж = 9.9 flight at 51.9 km altitude. Laminar and turbulent flow, assuming transition at Reg2,tr/Me = 100 to 200, eq. (8.33), was com­puted. For turbulent flow a к — e model was employed.

The results are in short, with due reservations regarding the turbulent cases because of the problems associated with turbulence models in such flow situations:

— For laminar flow increasing flap deflection increases the pressure rise in the interaction region and the thermal loads.

— For laminar flow the flap effectiveness is only weakly affected by the surface temperature, it rises, also the thermal loads, up to S « 15° and then stays approximately constant.

— Turbulent flow rises the flap effectiveness beyond S « 15°, increasing also the thermal loads.

— For turbulent flow the flap effectiveness is significantly affected by the surface temperature.

These are results for a single two-dimensional re-entry case at already low speed and altitude. In the three-dimensional reality the flow field past a deflected control surface can be quite different, see, e. g., [30, 31], and the effect of the surface temperature may also be different at larger speeds and altitudes.

Of practical interest is the asymptotic behavior downstream of the strong – interaction region [14]. The interaction region usually is of small extent com­pared to the whole ramp or flap surface, see, e. g., the left part of Fig. 10.4 in Chapter 10. However, regarding the flap effectiveness the pressure distribu­tion on the latter is of main interest. The problem of the high thermal loads in the interaction regime of course remains.

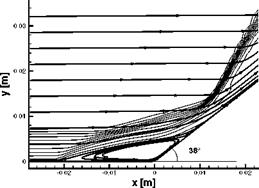
Example: Two-Dimensional Turbulent Flow. In view of CAV’s we close the section by looking at the problem of turbulence modeling for the com­putational simulation of control-surface flow in, e. g., [32, 33]. The ramp configuration chosen there has a rather large ramp angle (S = 38°) which leads to a very strong compression. The experimental data are from a gun tunnel operated with nitrogen [34]. The flow was computed with several two-equation turbulence models with a variety of length scale and compres­sion corrections. Perfect gas was assumed. The flow parameters are given in Table 9.3.

Table 9.3. Flow parameters of the turbulent ramp computation case [32].

Moo

Too [K]

Re’L [1/m]

Tw [K]

9.22

59.44

4.7-107

295

The computed flow field in Fig. 9.9 exhibits well the separation shock ahead of the recirculation regime, and the final reattachment shock.

Ramp-Type (Edney Type VI and V) Interaction

Fig. 9.9. Computed Mach number isolines and streamlines in the interaction region of a 38° ramp configuration [32]. Turbulent flow, low Reynolds number к — ш model.

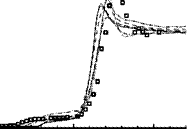
The computed surface pressure in general rises too late (separation shock) and thus indicates the primary separation too much downstream, Fig. 9.10. None of the turbulence models reaches the measured peak pressure, however the pressure relaxation behind it to the inviscid pressure level pw/p« 58.8 is sufficiently well met by all turbulence models. See in this regard also Chapter 6 of [14].

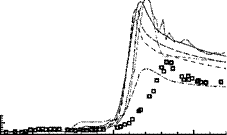
The computed heat transfer in the gas at the wall initially rises for all turbulence models also too late, but then—at the corner point—much too early and too high compared to the experimental data, Fig. 9.11.

Only one model comes close to the measurements. Although this is a very demanding case, the results are very unsatisfactory. In practice, however,

Ramp-Type (Edney Type VI and V) Interaction

100

90

80

70

60

50

40

30

20

10

0


Exp. Coleman et al. (1972) k-© lo-Re k-co lo-Re LS k-© lo-Re RC SA SST EARSM


0

x [m]


0.05


0.05


Fig. 9.10. Surface pressure pw(x) computed with several turbulence models, and experimental data [32].


Exp. Coleman et al. (1972) k-o lo-Re k-o lo-Re LS k-o lo-Re RC SA SST EARSM


70

65

60

55

50

45

40

35

30

25

20

15

10

5

0


0

x [m]


0.05


0.05


Fig. 9.11. With the flat-plate value qnon-dimensionalized heat transfer in the gas at the wall qw (x) (= qgw(x)) computed with several turbulence models, and experimental data [32].


flows past control surfaces with such large deflection angles will be highly three-dimensional, which is likely to change the picture. The situation is similarly difficult if the flow is transitional [35].

Example: Three-Dimensional Laminar Flow. Ramp-type interaction can occur also at wings. In [36] the Edney type VI interaction was studied numerically at a vehicle with the double-delta planform type shown in Fig. 6.4, in this case the HALIS configuration at an angle of attack a = 40°. The flow parameters (laminar flow) can be found in Tab. 5.7 in Section 5.6. We see in Fig. 9.12 the plan view and the computed density isolines in the shock


Ramp-Type (Edney Type VI and V) InteractionRamp-Type (Edney Type VI and V) Interaction

Подпись: Fig. 9.12. Plan view of the HALIS configuration with the sketch of the type VI shock/shock interaction [36].

Ramp-Type (Edney Type VI and V) Interactionlayer. The sketch to the left shows the type VI interaction of the bow shock with the embedded wing shock.
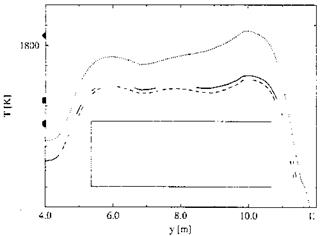
Computed radiation-adiabatic temperatures along the leading edge of the wing’s second delta are given in Fig. 9.13 for different catalytic wall models. The fully catalytic wall gives, as expected, the highest radiation-adiabatic temperatures and the non-catalytic wall the smallest with the results for the finite catalytic wall lying just above the latter.

Подпись: 1600 -Подпись: 1400Подпись: 1200 :Подпись: 10002000

2.0

Fig. 9.13. Computed radiation-adiabatic temperatures T(y) (= Tra(y)) along the wing’s leading edge of the HALIS configuration [36].

Подпись: їїThe fully catalytic wall has kind of a temperature plateau lying mostly below the stagnation point value, whereas for the other catalytic wall models the temperature plateaus lie above the temperature at the stagnation point.

At the end of the leading edge of the first wing delta (y = 4 m) the tem­peratures are approximately 400 K lower than those plateau temperatures. At y « 6 m for each catalytic model a small temperature maximum is dis­cernible which is due to the shock/shock interaction.[162] At y « 10 m for each catalytic wall model a second maximum is present, which is attributed to the impingement of the slip surface on the leading edge. These maxima are as high or even higher than the appendant stagnation point values!

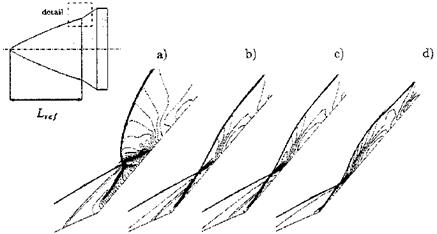
Example: Axisymmetric Laminar Flow. A proper modeling of high – temperature real-gas effects is necessary in any case, as we see in Fig. 9.14 [37]. The axisymmetric hyperboloid-flare configuration has been derived for validation purposes from the HERMES 1.0 configuration at approximately 30° angle of attack [38]. The computations in [37] were made with different gas models for the flight situation with the flow parameters (laminar flow) given in Table 9.4.

Table 9.4. Flow parameters of the shock/shock interaction study on the hyper­boloid-flare configuration [37].

Moo

H [km]

ке» [1/m]

Too [K]

Tw [K]

Lref [m]

25

77

1.46-104

192

700

10

The use of different high-temperature real-gas models results in different interaction types over the flare, which has an angle 5 = 49.6° against the body axis. This is due to the different shock stand-off distances at the blunt nose of the hyperboloid-flare configuration. We have noted in Sub-Section

6.4.1 that the stand-off distance A0 is largest for perfect gas and becomes smaller with increasing high-temperature real-gas effects.

At the left side of Fig. 9.14 the perfect-gas result is given, case a). In this case the bow shock lies most forward and its intersection with the ramp shock results in a type V interaction. Fully equilibrium flow gives the most aft position of the bow shock (smallest bow-shock stand-off distance, Sub­Section 6.4.1) which results in a type VI interaction, case d). In between lie the other two models which also lead to type VI interactions, cases b) and c). Of course the wall pressure and the heat flux in the gas at the wall vary strongly from case to case, the fully equilibrium case giving the largest surface loads, see also [39].

Ramp-Type (Edney Type VI and V) Interaction

Fig. 9.14. Influence of the modeling of high-temperature real-gas effects on the shape of the interaction region and the pressure distribution (isobars) on the hyperboloid-flare configuration (upper left) [37]: a) perfect gas, b) thermal and chemical non-equilibrium, c) thermal equilibrium and chemical non-equilibrium, d) thermal and chemical equilibrium.

The influence of high-temperature real-gas effects on interaction phenom­ena is one issue of concern. While the interaction locations in some instances, e. g., at inlet cowl lips and engine struts, are more or less fixed, they shift in the case of wings and stabilizers strongly with the flight Mach number, and the flight vehicle’s angles of attack and yaw.[163] The understanding of all aspects of interaction phenomena, the prediction of their locations and their effects on an airframe therefore are very important.

Shock/Boundary-Layer Interaction Phenomena

We summarize under this title several phenomena which are of interest in hypersonic flight vehicle design. These phenomena can be found for instance:

— at wings, Fig. 6.4, or stabilizers,

— at a the cowl lip of an inlet, Fig. 6.6,

— at the struts of a scramjet, Fig. 6.7,

— at a control surface, in two dimensions this is a ramp, Fig. 6.1 d) or ahead of a canopy (canopy shock),

— on ramps of the external part of the inlet, Fig. 6.5,

— in the internal part of an inlet (oblique shock reflections), e. g., the shock – train in Fig. 6.5, or in a scramjet, Fig. 6.7,

— at the side walls of the internal part of an inlet, or a scramjet (glancing interaction),

— in the longitudinal corners of the internal part of an inlet, or a scramjet (corner flow),

— at the (flush) nozzle of a reaction-control system, see, e. g., [14].

Shock/boundary-layer interaction phenomena can occur combined with local separation, but can also be connected with global separation. An ex­ample for the latter are cross-flow shocks in the leeward-side flow field of a body at large angle of attack, see, e. g., Fig. 3.20.

Interaction phenomena reduce the effectiveness of control surfaces and in­lets by thickening of the boundary layer or by causing flow separation. Glan­cing shocks induce longitudinal vortex separation, oblique reflecting shocks can result in a Mach reflection, see, e. g., [20], and also [21]. In the attachment region usually an increase of the heat flux in the gas at the wall occurs. More­over also very large and very concentrated heat flux and pressure peaks can be found locally. The interaction can support laminar-turbulent transition and can induce flow unsteadiness.

We do not discuss here all the mentioned phenomena, and refer instead the reader to the overviews [22]-[24], and especially [25]. We concentrate on ramp-type (Fig. 6.1 d)) and on nose/leading-edge-type (Figs. 6.4 and 6.6) interactions. These are Edney-type VI (and V), and Edney type III and IV interactions, respectively.

Shock/shock interaction with the associated boundary-layer interaction probably was the first time observed on the pylon of a ramjet engine that was carried by a X-15. At FFA in Sweden B. Edney was prompted by this event to make his by now classical investigations of the phenomenon [26]. He identified and studied experimentally six interaction types, the type IV interaction, see Fig. 9.15 in Sub-Section 9.2.2, being the most severe one.

Flow Separation

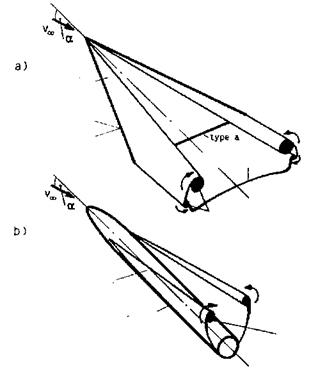
Flow separation is defined by the local violation of the boundary-layer criteria (constant pressure in wall-normal direction, approximately surface-parallel flow), by the convective transport of vorticity away from the body sur­face and the subsequent formation of vortex sheets and vortices behind or above/behind a flight vehicle. This definition goes beyond the classical view on separation. It implies that separation can be present at any flight vehi­cle just because any flight vehicle is of finite length. However, it is justi­fied, because behind or above/behind every flight vehicle with aerodynamic lift always vortex phenomena (vortex sheets and vortices) are present, see Fig. 9.1.

We distinguish two principle types of separation [3]:

– type a: flow-off separation,

– type b: squeeze-off separation (the classical separation).

Flow-off separation happens at sharp edges, which can be leading edges or trailing edges, Fig. 9.1 a). Squeeze-off separation typically occurs at regular surface portions, due to the pressure field of the external inviscid flow, Fig.

9.1 a) and b).

In both cases always two boundary layers are involved. In the case of flow – off separation the boundary layers from the two sides of the sharp edge (at a wing trailing or leading edge those from above and below the wing) flow off the edge and merge into the near-wake. In the case of squeeze-off separation the boundary layers squeeze each other off the same surface [3].

While in two-dimensional flow squeeze-off separation is defined by van­ishing skin friction—actually by the change of sign of the wall shear stress

Flow Separation
Подпись: type b
Подпись: vortex
Подпись: vortex layer
Подпись: vortex
Подпись: ayer

Flow Separationvortex

Fig. 9.1. Schematic of separation types, and resulting vortex sheets and vortices at basic configurations at large—typical for re-entry flight—angles of attack [4]: a) wing with large leading-edge (LE) sweep, b) fuselage. In both cases secondary and higher-order separation phenomena at the leeward side are not indicated, also not indicated are the separation phenomena at the rear end of the fuselage. Flow-off separation is indicated as type a, squeeze-off separation as type b.

tw —such a clear criterion is not available for three-dimensional flow. In three­dimensional attached viscous flow tw vanishes only in a few singular points on the body surface, for instance at the Blunt Delta Wing (BDW) in the forward stagnation point, see, e. g., Fig. 3.16, but also at singular points in the separation region [6].[153] Along three-dimensional separation lines, as well as attachment lines, Figs. 3.16 and 3.17, skin friction does not vanish [1].

In [1] criteria for three-dimensional separation are proposed. A practical indication for a three-dimensional squeeze-off separation line is the converging skin-friction line pattern, Fig. 3.6, and for a three-dimensional attachment line the diverging pattern, Fig. 3.5, see also Figs. 3.16 and 3.17.

Fig. 9.1 shows where on configuration elements, typical for hypersonic flight vehicles, the two types of separation occur. At a delta wing with large leading-edge sweep and sufficiently large angle of attack [7], we ob­serve squeeze-off separation at round leading edges, which are typical for hypersonic vehicles, Fig. 9.1 a). The primary squeeze-off separation line can lie well on the upper side of the wing, as we have seen in the case of the BDW, which has a rather large leading-edge radius, Figs. 3.17 and 3.19. If the leading-edge radius is very small—the sharp swept leading edge is the limiting case—we have flow-off separation at the leading edge, Fig. 9.1 a), type a.

At the sharp trailing edge of such a generic configuration we find flow-off separation, which we find also at sharp trailing edges of stabilization and control surfaces. At round fuselages, Fig. 9.1 b), and also at blunt trailing edges—which can be found at hypersonic flight vehicles—always squeeze-off separation occurs. If local separation (see below) occurs, we have squeeze-off separation with subsequent reattachment.

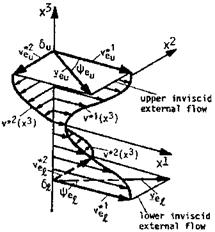
The near-wake resulting from flow-off separation at the trailing edge of a lifting wing in steady sub-critical flight has the general properties indicated in Fig. 9.2.[154] The profile of the velocity component п*1(ж3) resembles the classical wake behind an airfoil at sub-sonic speed. It is characterized by kinematically inactive vorticity, and represents locally the viscous drag (due to the skin friction) and the pressure drag (form drag), i. e., the total drag of the airfoil [4].

This kinematically inactive wake type would appear also if we have a blunt trailing edge with a von Karman type of vortex shedding. (For the latter see, e. g., [8].) Such trailing edges are sometimes employed at hypersonic wings or control surfaces in order to cope locally with the otherwise high thermal loads. This can be done without much loss of aerodynamic efficiency, if the boundary layers, which flow off the trailing edge, are sufficiently thick.

In Fig. 9.2 the s-shape like profile of the velocity component v*2(x3)—in contrast to v*1 (x3)—is kinematically active and represents locally the induced drag. The angles ФЄи and Феі vary in the span-wise direction of the wing’s trailing edge. In sub-critical flow we have ФЄи = —Феі [1].

These near-wake properties are found in principle regardless of the type of separation (flow-off or squeeze-off separation), and whether vortex layers or vortex feeding layers are present, Fig. 9.1.

Flow separation can also be categorized according to its extent [1]:

— local separation,

— global separation.

Local separation is given, for instance, if the flow separates and reat­taches locally (separation bubbles or separation occurring at a ramp or a

Flow Separation

Fig. 9.2. Schematic of a three-dimensional near-wake of a lifting wing in steady sub-critical flight [4]. The coordinates x1 and x2 are tangential to the skeleton surface of the wake, x3 is straight and normal to it. v*1 and v*2 are the tangential velocity components. Su and Sl denote the upper and the lower edge of the wake, where the inviscid flow vectors v£u and have the inclinations ФЄи and Фч against the x1 – axis.

two-dimensional control surface, e. g., Fig. 9.6 c)), or if it is confined oth­erwise to a small region. Shock/boundary-layer interaction, if the shock is strong enough, leads to local separation. In any case local separation is char­acterized by a rather local influence on the flow past a flight vehicle.[155]

Flow-off separation always is global separation with global influence on the vehicle’s flow field. The canonical phenomena are the induced angle of attack and the induced drag, respectively, which appear on a lifting wing.

The basis of this categorization is the locality principle [1]. It says basically that a local change of the flow field, for instance due to separation, but also of the body geometry, affects the flow field only locally and downstream of that location (see in this context also Sub-Section 7.1.4). Of course, due to the strong interaction the inviscid flow field is changed, but then it is a question of its spatial characteristic properties (elliptic, hyperbolic), whether or not upstream changes are induced. Such changes can be significant, if the wake of the body is kinematically active. Then we have global separation, which leads, for instance, to the mentioned induced drag of classical aerodynamics.

At a lifting delta wing, the leeward side vortices, Fig. 9.1 a), induce an additional lift increment, the non-linear lift. This does not violate the locality principle, because this is not an upstream effect. At hypersonic flight with large angle of attack (re-entry flight) leeward side vortices are present, too, see, e. g., Section 3.3, but the hypersonic shadow effect (see the introduction to Chapter 6), annuls the non-linear lift. Also phenomena like vortex breakdown, see, e. g., [9, 10], do not play a role at such flight.

The location of squeeze-off separation (type b) primarily is governed by the pressure field and the Reynolds number of the flow. This is important in particular for the primary separation at the well rounded wing leading edges of RV’s. The Mach number may have an effect as well as possibly also noise and surface vibrations, see, e. g., the numerical study of local separation cases at the border of the continuum regime in [11]. High-temperature real-gas effects probably have an influence on separation only via their influence on the flow field as such.

Global separation regions, for instance the leeward side flow field of the basic configurations shown in Fig. 9.1, exhibit also embedded secondary and even tertiary separation (and attachment) phenomena, as well as cross-flow shocks, which can interact with the attached surface-flow portions, causing local separation phenomena.[156] A classification of such flows is given, e. g., in [12, 13].

In closing this section some words about the simulation of separated flows. In ground-facility simulation it is a question for both global and local sep­aration, whether the Mach and Reynolds number capabilities of the facility permit to get proper results, and whether the flow to be simulated in reality is laminar or turbulent. The surface temperature has an influence, but the question is, how large it is for which flow classes.[157]

Computational simulation today is able to give results of high accuracy as long as the flow is laminar throughout the whole flow field. It also permits to quantify the influence of the surface temperature, if it is governed by radiation cooling. Usually the radiation-adiabatic surface is a good approximation. If a larger amount of heat enters the wall, a flow/structure coupling becomes necessary, see, e. g., [14]. However, if laminar-turbulent transition is present, computational capabilities become limited. The influence of the location and form of the transition zone may possibly be parameterized, at least for simple configurations.

Computational simulation of attached turbulent flow has, more or less, the same status as that for laminar flow. Turbulent separation, which can be highly unsteady, only now is becoming treatable with hybrid or zonal RANS/LES methods, Section 8.5. We show as an example two results of an numerical investigation by V. Statnikov et al. [15] of the experimental study of Mо = 6 rocket base flow by D. Saile et al. [16].

The generic rocket configuration has a cylindrical main body with a rounded conical nose. The base either is blunt or has a nozzle dummy ex­tended from the base. A vertical strut at the top of the main body is the support of the wind tunnel model, which is modeled in the computation, too. The flow parameters and some geometrical parameters are given in Table 9.1.

Table 9.1. Flow parameters of the generic rocket configuration [15]. D is the diameter, the length is 0.4724 m. The nozzle dummy has a length of 0.1296 m and a diameter of 0.043 m.

Tfoo

Too [K]

Poo [Pa]

D [m]

R&oo, D

6

57

1.14-103

0.108

1.728-10®

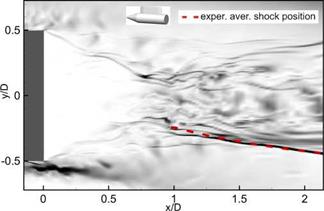
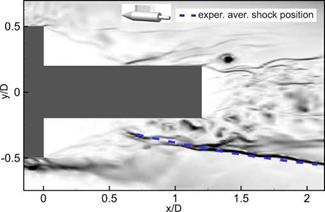
We give only two characteristic results of the numerical investigation in Figs. 9.3 and 9.4, which show time-averaged numerical schlieren pictures. Indicated in each picture is the location of the recompression shock.

Flow Separation

Fig. 9.3. Numerical schlieren picture in the symmetry plane of the—above inserted—blunt base configuration [15]. The recompression shock found in the ex­periment [16] is indicated by the broken line.

In both cases the good agreement with the experimentally found position of the shock is evident. We note in particular the satisfactory to good agree­ment between the computed and measured base pressure spectra for both cases [15].

An obviously almost not known tool to investigate the structures of ordi­nary separation flows, but also of shock/boundary-layer interaction flows, and to establish credibility of results of experimental and numerical simulations are topological considerations, see, e. g., [6, 17], and also [18].

Flow Separation

Fig. 9.4. Numerical schlieren picture in the symmetry plane of the—above inserted—nozzle dummy configuration [15]. The recompression shock found in the experiment [16] is indicated by the broken line.

Consider the skin-friction patterns at the windward and at the leeward side of the HERMES configuration in Fig. 9.5. The singular points on the vehicle surface can be connected via topological rules, see the examples given in [1] and [14]. Further a surface normal to the longitudinal axis of the vehicle yields a Poincare surface in which attachment and separation lines (lines with diverging and converging skin-friction line patterns in Fig. 9.5) show up as half-saddles, which also, together with off-surface singular points, can be connected with the help of topological rules. We have given an example in Sub-Section 3.3.2.

Flow Separation

Fig. 9.5. Computed skin-friction lines at the windward side (left) and the leeward side (right) of the HERMES configuration in a ground-simulation facility situation at = 10, pt = 10 bar, Tt = 1,100 K, Tw = 300 K, a = 30°, laminar flow [19].

We do not analyze the skin-friction line patterns shown in Fig. 9.5. The reader is encouraged to do this on his own. In this way he can check the plausibility of the computed patterns, and can gain missing information, and indications of, for instance, hot-spot situations at attachment lines on radia­tion cooled surfaces, see in this regard also Section 3.3.

Strong Interaction Phenomena

In Sub-Section 7.1.4 we have noted that if the displacement properties of a boundary layer are of 0(1 / ^/Reref), it influences the pressure field, i. e., the inviscid flow field, only weakly. We call this “weak interaction” between the attached viscous flow and the inviscid flow.[152] If, however, the boundary layer separates, the inviscid flow is changed and we observe a “strong interaction”. This phenomenon is present in all Mach number regimes, in particular also in the subsonic regime [1].

“Shock/boundary-layer interaction”, present in the transonic, supersonic, and hypersonic regimes, also leads through thickening or even separation of the boundary layer to strong interaction. “Shock/shock interaction” with the associated interaction with the boundary layer is a strong interaction phenomenon, too.

In the high supersonic and the hypersonic regime strong interaction hap­pens also if the attached boundary layer becomes very thick, which is the case with large Mach numbers and small Reynolds numbers at the boundary-layer edge. This is the “hypersonic viscous interaction”. Associated with hypersonic viscous interaction are “rarefaction effects” which appear in the continuum flow regime with slip effects, Section 2.3. They are directly related to large Mach numbers and small Reynolds numbers at the boundary-layer edge, too.

We consider the strong-interaction phenomena in general in their two­dimensional appearance. In should be noted that for instance shock/boun – dary-layer interaction usually is less severe in three-dimensional cases compared to strictly two-dimensional cases. The computation of turbulent three-dimensional interactions in general is also less problematic concerning turbulence models. This also holds for ordinary (turbulent) flow separation. On a (two-dimensional) airfoil separation at angles of attack of, say, above approximately 15°, is characterized by vortex shedding. The flow is highly unsteady. This is in contrast to three-dimensional separation at delta wings or fuselage-like bodies. Here the leeward side separation, beginning at an­gles of attack of, say, approximately 5°, is macroscopically steady up to, say, approximately 50°. This shows that an extended classification of separated flows, and strong-interaction flows in general, is desirable in view of turbu­lence modeling [2].

Unsteady pressure loads (dynamic pressure loads), due to separation phe­nomena with vortex shedding, further the intersection of vortex wakes with configuration components (leading to, for instance, fin vibration), and es­pecially also due to unsteadiness of shock/boundary-layer interaction, are of large concern in flight-vehicle design. Like noise they can lead to mate­rial fatigue and thus endanger structural integrity. In hypersonic flows they are usually combined with large thermal loads, which make them the more critical.

All the strong interaction phenomena, which we treat in the following sections, can have large, even dramatic influence on the surface pressure field and hence on the aerodynamic forces and moments acting on the flight ve­hicle, as well as on the thermal state of the surface, and hence on thermal surface effects and on thermal loads.

We aim for a basic understanding of these phenomena and also of the related computational and ground-facility simulation problems.

Turbulence Modeling for High-Speed Flows

In Chapter 7 we have discussed attached high-speed turbulent flow by means of a very simple description, the ^-power law with the reference-temperature extension. Our understanding was and is that such a description can be used only for the establishment of general insights, for trend considerations on typical configuration elements, and for the approximate quantification of at­tached viscous flow effects, namely boundary layer integral properties, the thermal state of the surface, and the skin friction.

For the “exact” quantification of viscous flow effects the methods of nu­merical aerothermodynamics are required. These methods employ statistical turbulence models, which permit a description of high-speed turbulent flows with acceptable to good accuracy, as long as the flow is attached. Turbulent flow in the presence of strong interaction phenomena still poses large prob­lems for statistical turbulence models, which hopefully can be diminished in the future.

In this section we give only a short overview of issues of turbulence model­ing for attached viscous flows on high-speed vehicles. Like in the case of semi­empirical and empirical transition prediction methods and criteria it holds that it is necessary for a given practical application to make first a assess­ment of the flow field under consideration, see Section 1.2. The assumptions

and the modeling in the turbulence model to be used must correspond to the considered flow field.

On RV’s the boundary layer due to the large angle of attack on a large part of the lower trajectory, Section 1.2, is a subsonic, transonic and low supersonic boundary layer with large boundary-layer edge temperatures and steep temperature gradients normal to the surface due to the surface radia­tion cooling, and hence steep density gradients with opposite sign. On CAV’s we have true hypersonic boundary layers at relatively small boundary-layer edge temperatures but also steep gradients of temperature and density, re­spectively, also due to the surface radiation cooling.[149] In the literature tran­sonic, supersonic, and hypersonic boundary-layer flows are all together called compressible boundary-layer flows. For detailed introductions to the topic of turbulent flow see, e. g., [9, 10, 23], [144]-[146] as well as [147]-[149].

A compressible boundary-layer flow is a flow in which non-negligible den­sity changes occur. These changes can occur even if stream-wise pressure changes are small, and also in low-speed flows, if large temperature gradients normal to the surface are present. In addition to these density changes den­sity fluctuations p exist, in particular in compressible turbulent boundary layers.

In turbulence modeling these fluctuations can be neglected, if they are small compared to the mean-flow density: p ^ pmean. Morkovin’s hypothesis states that this holds for boundary-layer edge-flow Mach numbers Me P 5 in attached viscous flow [150].

Morkovin’s hypothesis does not hold for flows with large heat transfer, free shear flows, and turbulent combustion, see, e. g., [151, 152]. It also does not hold if the turbulent flow crosses a shock wave, for instance at the boundary-layer edge in the case of an incident shock wave, see, e. g., [153], and in strong interaction situations (shock/boundary-layer interaction, Sec­tion 9.2), see, e. g., [154]. Hence in flows with edge Mach numbers Me P 5, with shock/boundary-layer interactions, etc., explicit compressibility correc­tions must be applied.

For compressible flows besides the continuity and the momentum equa­tions also the energy equation must be regarded. Hence in turbulence model­ing not only velocity and pressure fluctuations must be taken into account but besides the density fluctuations also temperature fluctuations. This brings us from the Reynolds-averaging to the Favre-averaging, the latter being a mass-averaging process, which also necessitates further closure assumptions [10, 149].

Special issues appear due to turbulent heat conduction and turbulent mass diffusion, the latter in the case of non-equilibrium flow. Analogously to the Prandtl and Schmidt numbers in laminar flow, turbulent Prandtland

Schmidt numbers are introduced. These are usually taken as constant.[150] For the Prandtl number it is known since long that it is not constant in attached high speed turbulent flows [155]. With measured turbulent Prandtl numbers in attached flow 0.8 ^ Prturb ~ 1 usually a mean constant Prandtl number Prturb = 0.9 is employed in turbulence models. It is advisable to check with parametric variations whether the solution for a given flow class reacts sen­sitively to the choice of the (constant) Prandtl number. The same holds for the Schmidt number.

The turbulence models used are in general transport-equation models, see, e. g., [149]. They allow to compute with good accuracy attached turbulent two­dimensional and three-dimensional high-speed boundary layers with pressure gradients, surface heat transfer, surface radiation cooling, surface roughness, and high-temperature real-gas effects. Very important is that the transition location is known or the flow is insensitive to the transition location. For a general introduction to three-dimensional attached viscous flow see [28].

General instructive computational results are given in [156]. There, several two-equation models with compressibility corrections were applied to flat – plate boundary layers with cooled and adiabatic wall in the Mach number regime 1.2 Si Мо 2l 10, to a hypersonic compression corner with cooled surface (two-dimensional control surface) with an onset flow Mach number M = 9.22, and to the flow past the X-38 configuration with extended body flap at Mо = 6 and a = 40° in the wind-tunnel situation.

Once the flow separates, the usual prediction problems, present already in the low-speed regime, see, e. g., [105], arise. In particular in the case of shock-induced separation (shock/boundary-layer interaction at a compression ramp) it is observed, see also [10], that the upstream influence is wrongly computed, the primary separation location is not met, and the computed pressure in the interaction zone is different from the measured one. In the interaction zone typically the heat transfer is predicted too high [157]. (See in this regard the example in Sub-Section 9.2.1.)

Downstream of the interaction zone the relaxation of pressure, skin fric­tion and heat transfer often is different from the measured one. This is of large concern for practical applications, because the asymptotic behavior of, for instance the pressure on the ramp, is important. It governs the efficiency of an aerodynamic trim or control surface, like that of an inlet ramp [1].

Too high estimated thermal loads are not a problem per se, as too low predicted ones would be. They lead, however, to generally unwanted struc­tural mass increments.[151] The reason for the misprediction possibly lies in the large wall-normal mean-flow density gradients present in the interaction zone.

These would warrant the employment of Reynolds-stress turbulence models [158, 159]. Such models have not yet found their place in aerothermodynamic computation methods.

Other reasons could be intrinsic three-dimensionalities in the interaction zone. This does not only concern Gortler vortex phenomena, but also em­bedded unsteady three-dimensional flow phenomena, as were observed in nu­merical simulations of laminar compression-ramp flow [160].

Massive flow separation, which as a rule is unsteady, now becomes treat­able with zonal methods. These methods couple RANS and LES methods, see, e. g., [161]. The computational effort still is high. Nevertheless, these methods have an high application potential. Results of an investigation of high-speed base flow are discussed in Section 9.1.