Category Basics of Aero – thermodynamics

A Few Remarks on Simulation Issues

Thermo-chemical freezing phenomena in the nozzles of hot hypersonic ground – simulation facilities seem not to be a major problem for the simulation of blunt-body (RV-type configuration) flows [24, 25]. The pressure is not much affected, but the bow shock stand-off distance may be wrong, which can be a problem in view of interaction phenomena on downstream configuration elements, Sub-Section 6.4.1. Also the determination of the test section Mach number can be problematic, Sub-Section 5.5.2. The possible large difference between the test section Mach number and the flight Mach number should be no problem, if the former is large enough that Mach-number independence is ensured [6]. However, the Space Shuttle Orbiter experience regarding the pitching-moment anomaly, [26], must be taken very seriously.[52]

Another problem are the thermal surface effects. For RV’s they concern as thermo-chemical effects at least the catalytic surface recombination. In ground-simulation facilities we have in general cold model surfaces. In reality the surface is hot, Tw ^ 2,000 K, and thermal loads determined with a cold model will have deficiencies.

The situation is different for CAV’s. Thermo-chemical equilibrium or non­equilibrium will occur in the nose region, but downstream of it, where the body slope is small, freezing may set in. At a forebody with pre-compression and at the inlet ramps then again the situation will change. It is not clear what effect thermo-chemical freezing phenomena in the facility nozzle flow will have in this case. In [27] it was found that a species separation due to pressure-gradient induced mass diffusion can happen when the frozen free – stream flow passes the body (flat plate) induced oblique shock wave. Whether this can be of importance is not known.

Not much more is known about the influence of frozen nozzle flow on ther­mal surface effects, in this case regarding predominantly viscous flow phe­nomena (viscous effects). Boundary-layer instability and laminar-turbulent transition will be affected, Section 8.2, but for CAV’s the cold model surfaces will lead in any case to major adverse effects.

Regarding computational simulation it depends on the flight speed, the altitude and the flight-vehicle type, and on the critical phenomenon/pheno- mena, whether an equilibrium or a non-equilibrium high-temperature real-gas model must be employed. This concerns not only the pressure field and near- wall/wall viscous and thermo-chemical phenomena, but via the shock stand­off distance also strong interaction effects, Section 9.2.2. Non-equilibrium thermo-chemical, but also radiation phenomena, however, must be regarded in any case at the very high speeds of, for instance, AOTV-type vehicles, see,

e. g., [28].

Surface Catalytic Recombination

If the surface of the flight vehicle acts as a third body in the chemical recom­bination reactions discussed in the previous section, we speak about catalytic surface recombination, which is a “heterogeneous” reaction. Catalytic surface recombination is connected to the thermal state of the surface. We will see that, on the one hand, it is depending on the surface temperature (thermo­chemical thermal-surface effect), but also influencing this temperature. On the other hand, it has an effect on thermal loads. Because of these two ef­fects catalytic surface recombination is of interest for hypersonic flight vehicle design.

We keep in mind that of the flight vehicles considered, Chapter 1, RV’s bear the largest thermal loads. Due to material limitations currently surface temperatures of up to about 2,000 K can be permitted. Because we have radiation-cooled surfaces, these maximum temperatures occur only in the stagnation point region, and then drop fast to values as low as about 1,000

K, depending on flight speed and vehicle attitude.[49] The heat flux in the gas at the wall, qgw, shows a similar qualitative behavior.

A catalyst reduces the necessary activation energy of a reaction, and hence more collisions lead to reactions. Accordingly more reaction heat is released. Hence the surface material (coating) should be a poor catalyst in order to re­duce the release of reaction heat at the surface. Catalytic recombination helps to proceed towards equilibrium faster, but does not change the equilibrium composition of a gas.

As limiting cases regarding high catalycity two conditions are often con­sidered, see, e. g., [18]: equilibrium wall and fully catalytic wall. With respect to the gas composition the two cases are equivalent, given that the conditions (T and p) allow a full recombination.

Regarding the maximum heat flux towards the wall (qgw, max) it is ob­served, that the fully catalytic wall gives a heat flux similar to that of the equilibrium wall. Therefore often the equilibrium wall is taken as the reference case for the largest heat load.[50]

In [19] the two concepts are distinguished in the following way:

— Equilibrium wall: If the flow past a flight vehicle would be in chemical equi­librium, a cold surface—we have seen above, that the surface temperature in our cases is at most around 2,000 K—would shift the gas composition at the wall into the respective equilibrium wall composition. This compo­sition could be, depending on the temperature and density/pressure levels, locally still a mixture of molecules and atoms.

— Fully catalytic wall: The fully catalytic wall, in contrast to the equilibrium wall, would lead at the wall to a recombination of all atoms, even if wall temperature and density/pressure would atoms permit to exist.

We discuss now the basics of catalytic surface recombination in a phe­nomenological way. We introduce the recombination coefficient of atomic species [19]

Here jia is the mass flux of the atomic species ia towards the surface, and ja the mass flux of actually recombining atoms.

The recombination coefficient depends on the pairing gas/surface species, like the surface accommodation coefficients, Section 4.3, and on the wall temperature TW.

It has been observed in experiments, [19], that the energy transferred during the recombination process is less than the dissociation energy (par­tial energy accommodation), so that another recombination coefficient, the energy transfer recombination coefficient can be introduced. The effect, how­ever, seems to be of minor importance and often is neglected in computational methods.

The catalytic recombination rate kWia is a function of the wall temper­ature and of the gas-species properties. It is expressed in the form (Hertz – Knudsen relation):[51]

RqT

27Г Mja


(5.41)


Surface Catalytic Recombination

Yia


With the catalytic recombination rate the mass flux of atoms actually recombining at the surface can be written as

Подпись:ji^r Yia kWia Pia •

The mass flux of the atoms towards the surface is

Jiyr folVia Pi’

Ъа


(5.43)


i


We distinguish three limiting cases:

— Yi, a ^ 0: no recombination occurs, the surface is non-catalytic, the catalytic recombination rate goes to zero: kWia ^ 0.

— 0 < Yia < 1: only a part of the atoms recombines, the surface is partially catalytic, the catalytic recombination rate is finite: 0 < kWia < to.

— Yia ^ 1: all atoms recombine, the surface is fully catalytic. For this case one finds in literature that the recombination rate is considered to be as infinitely large: kWia ^ to.

We discuss now the possible boundary conditions for the mass-transport equations, Sub-Section 4.3.3:

— Equilibrium conditions for the species:

— ui(P, T )|w.

This case would not involve the solution of the species-continuity equations. Hence no boundary conditions need to be considered.

— Vanishing mass-diffusion flux of species i:

jiy w 0.

If this holds for all species, it is the boundary condition for the case of the non-catalytic surface, in which no net flux of atoms and molecules towards the surface happens. The non-catalytic surface does not influence the gas composition at the wall.

— Fully catalytic surface recombination:

^ia w °.

The complete vanishing of the atoms of species i is prescribed.

— Finite catalytic surface recombination:

jia w Pia kWia w.

The partial vanishing of atoms of species i is prescribed.

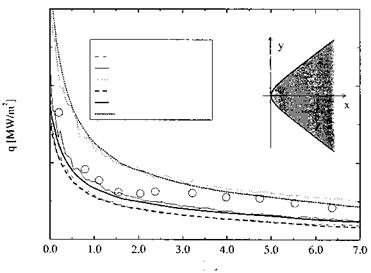
In closing this section we discuss some results from [12] and [20] in order to illustrate surface catalytic recombination effects. In Fig. 5.11, [12], distri­butions of the heat flux in the gas at the wall qgw at an hyperbola with nose radius R = 1.322 m and opening angle Ф = 41.7° are given. The generator of the hyperbola approximates the contour of the lower symmetry line at the first seven meters of the forward part of the Space Shuttle Orbiter. The flow parameters are given in Table 5.6. Although the surface temperature is still rising at that trajectory point, a constant temperature Tw = 800 K was cho­sen, like for the Direct Simulation Monte Carlo (DSMC) computations [21]. The error in Tw is about 5 per cent.

Table 5.6. Parameters of the (laminar) flow past the hyperbola under reentry conditions at 85.74 km altitude [12].

Moo

Vcc [m/s]

Too [K]

pc. о [kg/m3]

UJN2

Uo2

T„ [K]

27.35

7,511.4

187

6.824-1СГ6

0.738

0.262

800

At the chosen trajectory point we are at the border of the continuum regime. Slip effects were not modeled in [12], the comparison with DSMC results served the validation of the Navier-Stokes method CEVCATS.

Fig. 5.11 shows everywhere a good agreement between the results of the two methods. The assumption of a non-catalytic surface yields the smallest heat flux, that of a fully catalytic surface a heat flux approximately twice as large. The finite catalytic case yields results not much higher than that of the non-catalytic case. In all cases we have to a good approximation the cold-wall
laminar-flow behavior of qw ж (x/L)-0-5 as discussed in Sub-Section 3.2.1 (eq. (3.27)). Up to x « 2 m the flight data are met by the finite catalytic case, and after x « 4 m by the fully catalytic case. Here the surface is cold enough to support fully catalytic recombination. The transition from one case to the other is not predicted.

Подпись: 0.10 Подпись: OSTS-l - DSMC, non-catalytic - DSMC, finite catalytic - DSMC, fully catalytic - NS, non-catalytic - NS, finite catalytic NS, fully catalytic

Surface Catalytic Recombination0.15

0.05 0.00

x (ml

Fig. 5.11. Distribution of the heat flux in the gas at the wall (q = qgw) of the Space Shuttle Orbiter equivalent hyperbola with different surface-catalytic recombination models in comparison to in-flight measurements [12] (STS-1: first Space Shuttle Or­biter flight, DSMC: Direct Simulation Monte Carlo [21], NS: Navier-Stokes method CEVCATS).

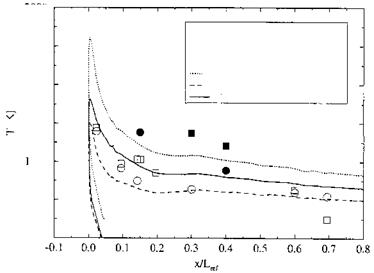
In Fig. 5.12 we show a comparison of computed, [12], and flight-measured distributions, [22], of the radiation-adiabatic temperature along the lower symmetry plane of the Space Shuttle Orbiter. The configuration used in the computations is the, on the leeward side simplified, Space Shuttle Orbiter configuration, known as HALIS configuration, which was introduced in [23].

The flow parameters are given in Table 5.7. The surface temperature is assumed to be the radiation-adiabatic temperature. The surface emissivity is assumed to be e = 0.85. Computations with CEVCATS were made for the non-catalytic, the finite catalytic, and the fully catalytic case. Results are shown up to approximately 75 per cent of the vehicle length.

Presented in Fig. 5.12 are computed data, and flight-measurement data from ordinary tiles, and from gauges with a catalytic coating. In general we see the drop of the wall temperature with increasing x as predicted quali­tatively in Sub-Section 3.2.1. The temperature difference between the fully catalytic and the non-catalytic case is strongest in the vehicle nose region

Moo

Vcc [m/s]

Too [K]

pec [kg/m3]

UJN2

Uo2

Lref [m]

a [°]

6

24

7,027.54

212.65

5.5-10~6

0.738

0.262

32.77

40

0.85

Table 5.7. Parameters of the (laminar) flow past the HALIS configuration under reentry conditions at 72 km altitude [12].

2UUU

Подпись: Simulation finite catalytic
Подпись: 1600
Подпись: OSTS-2 □ STS-3 #STS-2 catalytic coating ■ STS-3 catalytic coating -- Simulation fully catalytic - Simulation non-catalytic
Подпись: 1800

Surface Catalytic Recombination

=2 1400

200 1000 800

Fig. 5.12. Distributions of the radiation-adiabatic temperature (e = 0.85, T = Tra) along the lower symmetry line of the HALIS configuration for different surface- catalytic recombination assumptions. Comparison of in-flight measurement data with CEVCATS data [12].

with approximately 450 K. The results for the finite catalytic case lie be­tween the results of the two limiting cases. The measured data are initially close to the computed finite catalytic data, and then to the non-catalytic data. This in contrast to the data shown for the heat flux in Fig. 5.11. The data measured on the catalytic coatings partly lie above the computed fully catalytic data.

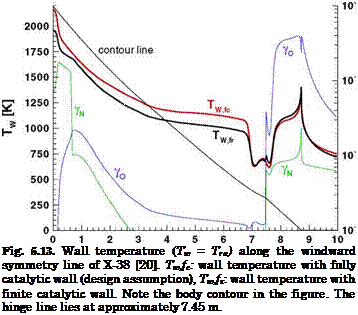
Finally results from [20] are presented. The objective of that study was to determine the influence of the assumptions “fully catalytic” and “finite catalytic” wall on the wall temperature along the windward side of the X-38 with deflected body flap. The computations were made with the Navier – Stokes code URANUS with an axisymmetric representation of the windward symmetry-line contour. In Table 5.8 the flow parameters are given.

Fig. 5.13 shows that the computation with finite catalytic wall results in smaller temperatures than that with fully catalytic wall. The differences

Подпись: Table 5.8. Parameters of the (laminar) flow past the X-38 at 60 km altitude, and surface material (S: downward deflection angle of the body flap) [20]. Moo Vco [m/s] ЯЄСО }L L [m] a [°] 4 П Є Nose cone Body Body flap 20 6,085.5 6.2-Ю5 9.14 40 20 0.87 SiC SiOn SiC
are about —200 K in the nose region and at parts of the body, but small and reverse at the flap. The atomic nitrogen recombination coefficient yn is large at the nose and again at the flap, indicating strongly catalytic behavior regarding N. The atomic oxygen recombination coefficient yo is moderate at the body and very large at the flap. There the finite-rate temperature Tw, fr is even larger (about 50 K) than the fully-catalytic temperature Twjc. This is due to the very strong catalytic behavior of the surface with regard to O and the resulting transport of atomic species in the boundary layer towards the wall. For the TPS design these data constitute the uncertainties range, which must be covered by appropriate design margins.

Подпись:
contour length [m]

Nozzle Flow in a “Hot” Ground-Simulation Facility

In [14], see also [15], results of a numerical study of flow and rate phenomena in the nozzle of the high-enthalpy free-piston shock tunnel HEG of the DLR in Gottingen, Germany, are reported. We present and discuss some of these results.

The computations in [14, 15] were made with a Navier-Stokes code, em­ploying the 5 species, 17 reactions air chemistry model of Park [7] with vibration-dissociation coupling. For the expansion flow thermo-chemical equi­librium and non-equilibrium was assumed. For the description of thermal non-equilibrium a three-temperature model was used (Ttrans/rot, TVibrN2, and TVibro2). The vibrational modes of NO were assumed to be in equilibrium with Ttrans/rot, which applies to this nozzle-flow problem [14]. No-slip con­ditions were used at the nozzle wall, fully catalytic behavior of the wall was assumed.

Geometrical data of the contoured nozzle and reservoir conditions of the case with tunnel operating condition I, for which results will be shown, are given in Table 5.4. The nozzle originally was designed for a condition which is slightly different from condition I, therefore a weak re-compression happens around 75 per cent of nozzle length.

Table 5.4. Geometrical nozzle data of HEG and reservoir conditions of operating condition I [14].

Lriozzle

Dthroat

D exit

Area ratio

Test gas

pt

ht

Tw

3.75 m

0.022 m

0.88 m

1,600

air

386 bar

20.19 MJ/kg

300 к

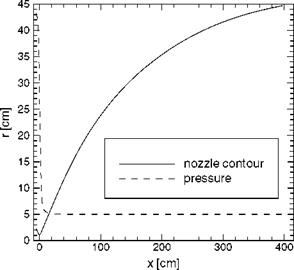
Fig. 5.7 shows the nozzle radius r(x) and the computed pressure p(x) along the nozzle axis. The expansion process is characterized by a strong drop of the pressure just downstream of the throat.

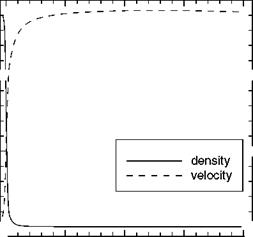
This drop goes along with a strong acceleration of the flow and a strong drop of the density, Fig. 5.8. Consequently the number of collisions between the gas species goes down. Vibrational energy will not be de-excitated, and dissociation will be frozen.

Comparing the flow variables and parameters at the nozzle exit for thermo-chemical equilibrium and non-equilibrium, Table 5.5, one sees, that the velocity u and the density p are rather weakly, the pressure p somewhat more, affected by the choice of equilibrium or non-equilibrium. This is due to the fact, that the distribution of these variables along the nozzle axis is more or less a function of the ratio of ‘pressure at the reservoir’ to ‘pressure at the nozzle exit’, and, of course, of the nozzle contour, i. e., that it is largely independent of the rate processes in the nozzle, see, e. g., [16].

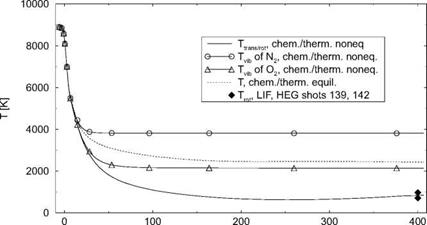
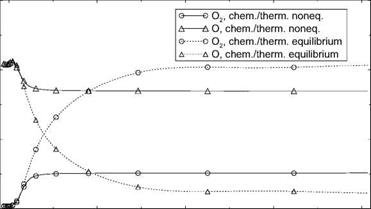
The different temperatures, Fig. 5.9, and the mass fractions—we present only O(x) and O2(x)—Fig. 5.10, however, are strongly affected by the choice of equilibrium or non-equilibrium, hence the vastly different nozzle exit Mach numbers and unit Reynolds numbers for these cases in Table 5.5.

Fig. 5.9 shows that freezing of the vibrational temperature TvibN2 happens at a location on the nozzle axis shortly behind the nozzle throat at x « 16 cm,

300


Nozzle Flow in a “Hot” Ground-Simulation Facility

2000


4


0


Nozzle Flow in a “Hot” Ground-Simulation Facility

0 100


Fig. 5.8. Velocity u(x) and density p(x), non-equilibrium computation, along the axis of the HEG nozzle [14].


Nozzle Flow in a “Hot” Ground-Simulation FacilityNozzle Flow in a “Hot” Ground-Simulation Facility

Table 5.5. Computed flow variables and parameters at the exit of the HEG nozzle for thermo-chemical equilibrium and non-equilibrium [14].

Case

uexit [m/s]

Pexit [P&]

pexit [kg/m3]

T£xit [K]

Mexit

Reexit [1/m]

Equilibrium

5,908.5

1270.7

1.77-10~°3

2,435.3

6.49

137,993

Non-equilibr.

5,689.4

678.6

2.44-10~°3

836.3

8.99

378,299

whereas Tvib02 freezes somewhat downstream of this location at x « 23 cm. The solution for thermo-chemical equilibrium yields a temperature, Tequil, which drops along the nozzle axis monotonically, with a slightly steepening slope around x « 320 cm, due to the weak re-compression, to Tequil = 2,435.3 K at the nozzle exit.

For thermo-chemical non-equilibrium Ttrans/rot is much lower than Tequil. It drops to a minimum of approximately 550 K at x « 260 cm and rises then, also due to the weak re-compression, to Ttrans/rot = 836.3 K at the nozzle exit. At x = 400 cm, in the test section of the HEG facility, the computed Ttrans/rot compares well with measured data.

Nozzle Flow in a “Hot” Ground-Simulation Facility

x [cm]

Fig. 5.9. Computed temperatures along the axis of the HEG nozzle [14].

Freezing of the composition of oxygen in the non-equilibrium case happens on the nozzle axis at x « 18 cm, with aO, noneq ~ const. « 0.17 and ao2,noneq « const. « 0.05 downstream of x « 50 cm, Fig. 5.10. The mass fraction of atomic oxygen in the equilibrium case falls monotonically from aO, equil « 0.21 at the nozzle throat, with a slightly steepening slope at x « 320 cm, to aO, equil « 0.02 at the nozzle exit. The mass fraction of diatomic oxygen

0. 3

0. Подпись: 0.2Подпись: о a o'1 a 0.1 Подпись:Подпись:Nozzle Flow in a “Hot” Ground-Simulation Facility0

rises monotonically from nearly zero at the throat to ao2,equii ~ 0.21 at the nozzle exit, with a slight increase of the slope at x « 320 cm.

The fact that the equilibrium temperature Tequil is much higher than the frozen non-equilibrium temperature Ttrans, rot, can simply be explained.

We assume for both cases that the temperature in the nozzle is already so low that we can write cp = const. in the relation for the total enthalpy. We write for the equilibrium case

v2 (x)

ht = CpTpquil (x) H— —. (5.36)

If now a part of the total enthalpy is trapped in frozen non-equilibrium vibration or dissociation, it will not participate in the expansion process. Hence we get for the “active” total enthalpy h’t:

Подпись: (5.37)ht < ht.

With

v’2 (x)

h’t = cpT'(x) + , (5.38)

and v’ « v—because, as we saw above, the velocity is only weakly affected— we obtain finally the result that the temperature in frozen non-equilibrium flow, Ttransrot, is smaller than that in equilibrium flow:

As we have seen above, this effect can be very large, i. e., a significant amount of thermo-chemical energy can freeze in non-equilibrium during ex­pansion in the nozzle of a high-enthalpy tunnel. The model then will “fly” in a frozen atmosphere with a large amount of energy hidden in non-equilibrium vibrational degrees of freedom and dissociation, compared to the actual flight of the real vehicle through a cold atmosphere consisting of N2 and O2, where only the degrees of freedom of translation and rotation are excited. Conse­quently the measured data may be not representative to a certain degree. A solution of the freezing problem is the employment of very high reservoir pressure/density, in order to maintain a density level during the expansion process, which is sufficient to have equilibrium flow. This then may have been bought with van der Waals effects in the reservoir and, at least, in the throat region of the nozzle.

The freezing phenomenon can be very complex. In a hypersonic wind tunnel with a reservoir temperature of Tt « 1,400 K for the M =12 nozzle— large enough to excite vibration—de-excitation was found to happen in the nozzle near the nozzle exit [17]. The original freezing took place shortly be­hind the nozzle throat. The de-excitation increased static temperature (TTO = Ttrans/rot) and pressure рж in the test section of the tunnel, and decreased the Mach number MTO. Although the actual Mach-number was not much lower than that expected for the case of isentropic expansion, errors in static pressure were significant. The sudden de-excitation at the end of the noz­zle was attributed to a high level of air humidity [17]: the water droplets interacted with the air molecules and released the frozen vibrational energy.

Rate Effects, Two Examples

In this section two examples from computational studies of rate effects in hypersonic flows are presented and discussed. The first example is a shock­wave flow in the presence of vibrational and chemical rate effects (DAM 1 = O(1)), the second a nozzle flow of a ground-simulation facility with high total enthalpy (“hot” facility) with freezing phenomena (DAM 1 ^ 0).

5.5.1 Shock-Wave Flow in the Presence of Rate Effects

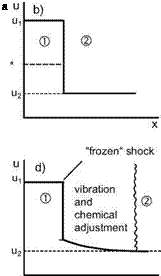
The shock wave, Section 6.1, basically is a small zone in which the velocity component normal to the wave front (vi) drops from supersonic (Mi) to subsonic speed (v2, M2). This is shown for a normal shock wave in Fig. 5.4. The velocity drop is accompanied by a rise of the density and the temperature. Translational and rotational degrees of freedom adjust through this zone to the (new) conditions behind the shock wave, Fig. 5.4 a). Because this zone is only a few mean free paths wide, the shock wave in general is considered as discontinuity, Fig. 5.4 b).

Rate Effects, Two Examples

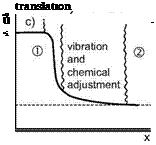
Fig. 5.4. Schematic of a normal shock wave in presence of rate effects (following [1]). ’1’ denotes ’ahead of the shock wave’, ’2’ is ’behind the shock wave’, a) normal shock wave, b) shock wave idealized as flow discontinuity (a*: critical speed of sound (see Sub-Section 6.3.1)), c) shock wave with all rate effects, d) situation c) idealized with “frozen” shock.

The situations changes in high-enthalpy flow. Here the temperature rise in the shock wave leads to the excitation of vibrational degrees of freedom and to dissociation. However, because of the small extent of the zone, the adjustment to the new conditions takes longer than that of translation and rotation. The result is a “relaxation” zone with non-equilibrium flow, and hence a much increased actual thickness of the shock wave, Fig. 5.4 c).

Also here we can approximate the situation. Fig. 5.4 d) assumes, that the adjustment of translation and rotation is hidden in the discontinuity like in Fig. 5.4 b), whereas vibration and chemical reactions are frozen there. Their adjustment then happens only in the relaxation zone behind the discontinuity.

Now to some selected numerical results from a study of hypersonic flow past a cylinder [12]. The flow parameters are given in Table 5.3. The com­putations were made with a Navier-Stokes method in thin-layer formulation with several assumptions regarding thermo-chemical non-equilibrium. The case of perfect gas is included.

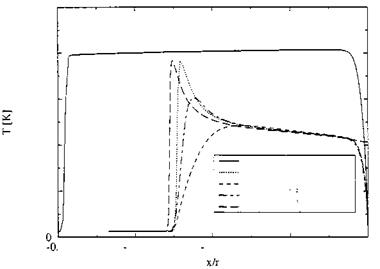
Fig. 5.5 shows for perfect gas a shock stand-off distance of x/r « —0.4, much larger than that for the non-equilibrium cases with x/r « —0.25

Rate Effects, Two Examples(we will come back to this phenomenon in Sub-Section 6.4.1). The temper­ature behind the shock is nearly constant. It reaches shortly ahead of the cylinder approximately the total temperature T0 = 8,134 K and drops then in the thermal boundary layer to the prescribed wall temperature Tw = 600 K.[48]

Table 5.3. Parameters of the flow at the cylinder under reentry conditions at 53.5 km altitude [12].

Moo

Vcc [m/s]

Too [K]

pec [kg/m3]

UJN2

Uo2

T„ [K]

Rcyl [їїі]

12.5

3,988.56

252.5

3.963-10~4

0.738

0.262

600/adiabatic

0.25

The translational temperature together with the rotational temperature initially reaches in the two (one with adiabatic wall) non-equilibrium cases nearly the perfect-gas temperature. It drops then fast in the zone of thermo­chemical adjustment due to the processes of dissociation, Fig. 5.6, and vibra­tional excitation.

10000 8000 6000 4000

Rate Effects, Two Examples

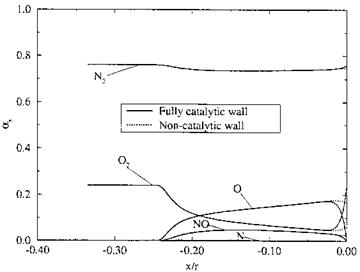
Fig. 5.6. Distributions of species mass concentrations (as = ші) along the stagna­tion line ahead of the cylinder between shock and cylinder surface for two different catalytic wall boundary conditions [12].

With the adiabatic wall case (Tr « 4,000 K) the shock stand-off distance is slightly larger than with the isothermal wall case with Tw = 600 K (see also here Sub-Section 6.4.1). The vibrational temperature of oxygen TvibrO2 adjusts clearly faster than that of nitrogen TvibrN2. Thermal equilibrium is reached at x/r « —0.17.

The distributions of the species mass concentrations are shown in Fig. 5.6 for a fully catalytic and for a non-catalytic surface. We see that the concentration of N2 does not change much. It reaches fast the equilibrium state. At the wall it rises slightly, and in the case of the fully catalytic wall it reaches the free-stream value, i. e., nitrogen atoms are no more present (the mass fraction of N anyway is very small, because the atoms combine with O to NO), and NO also disappears almost completely. The concentration of O2 decreases up to the outer edge of the thermal boundary layer at x/r « —0.025 and then increases strongly in the case of the fully catalytic case, reaching, like N2, the free-stream value. The effect of the non-catalytic wall is confined to the wall-near region.

Thermal and Chemical Rate Processes

We assume the flow cases under consideration to be in the continuum regime, and at most at its border, in the slip-flow regime, Section 2.3. Nevertheless, we used in our above discussion the concept “excitation by collisions”. We apply this concept now in order to get a basic understanding of rate processes, i. e., excitation or reaction processes, which in principle are time dependent.

The number of collisions per unit time depends on the density and the temperature of the gas. The number of collisions at which molecules react is much less than the number of collisions they undergo, because only a fraction of the collisions involves sufficient energy (activation factor), and only a fraction of collisions with sufficient energy actually leads to a reaction (steric factor) [1]. The orders of magnitude of the number of collisions needed to reach equilibrium of degrees of freedom or to dissociate molecules [1] are given in the following Table 5.2.

Table 5.2. Number of collisions to reach equilibrium of degrees of freedom or dissociation.

Phenomenon

Number of collisions

Translation

0(10)

Rotation

0(10)

Vibration

O(104)

Dissociation

> O(104)

The table shows that only a few collisions are needed to obtain full ex­citation of translation and rotation.[47] Knowing the very low characteristic rotational temperatures of the diatomic species N2, O2, NO, Appendix B.1, we understand why for our flow cases in general rotational degrees of freedom can be considered as fully excited. Vibrational excitation needs significantly more collisions, and dissociation still more. We note that this consideration is valid also for the reverse processes, i. e., de-excitation of internal degrees of freedom, and recombination of atomic species.

Since excitation is a process in time, we speak about the “characteristic excitation or reaction time” т, which is needed to have the necessary collisions to excite degrees of freedom or to induce reactions. Comparing this time with a characteristic flow time leads us to the consideration of thermal and chemical rate processes.

We introduce the first Damkohler number DAM 1 [8]:

DAMl = —. (5.22)

T

Here tres is the residence time of a fluid particle with its atoms and molecules in the considered flow region, which we met in another context already in Section 4.1

tres = —• (5.23)

vref

Lref is a characteristic length of the flow region under consideration, and vref a reference speed, Fig. 4.2.

The characteristic time

t = t(p, T, initial state) (5.24)

is the excitation time of a degree of freedom or the reaction time of a species, and depends on the density, the temperature and the initial state regarding the excitation or reaction [1].

We distinguish the following limiting cases:

— DAM 1 ^ to: the residence time is much larger than the characteristic time: tres ^ t, the considered thermo-chemical process is in “equilibrium”, which means that each of the internal degrees of freedom and the chemical reactions is in equilibrium. Then the actual vibrational energy or the mass fraction of a species is a function of local density and temperature only: evibri = evibri(p, T), ші = ші(р, T). In this case we speak about “equilibrium flow” or “equilibrium real gas”.

— DAM 1 ^ 0: the residence time is much shorter than the characteristic time: tres ^ t, the considered thermo-chemical process is “frozen”. In the flow region under consideration practically no changes of the excitation state or the mass fraction of a species happen: e. g., evibri = evibri, ші = шіхі. We speak about “frozen flow” or “frozen real gas”. In Sub-Section

5.5.1 an example is discussed.

— DAM 1 = 0(1): the residence time is of the order of the characteristic time, the considered process is in “non-equilibrium”. In the flow region under consideration the thermo-chemical processes lag behind the local flow changes, i. e., the process is a relaxation process. We call this “non­equilibrium flow” or “non-equilibrium real gas”. We discuss an example in Sub-Section 5.5.

Of course for the aerothermodynamic problems at hand it is an important question whether the thermo-chemical rate process is relevant energetically. The parameter telling this is the second Damkohler number DAM2:

which compares the energy involved in the non-equilibrium process qne with the total energy of the flow H0. If DAM2 ^ 0, the respective rate process in general can be neglected.

We note that the Damkohler numbers must be applied, like any similarity parameter, with caution. A global Damkohler number DAM 1 ^ ж can in­dicate, that the flow past a flight vehicle globally is in equilibrium. However, locally a non-equilibrium region can be embedded. This can happen, for ex­ample, behind the bow shock in the nose region of a flight vehicle, but also in regions with strong flow expansion. At a RV at large angle of attack, for instance, we have the situation that the gas in the stagnation point region is heated and is in some thermo-chemical equilibrium or non-equilibrium state. A part of this gas will enter the windward side of the flight vehicle, where only a rather weak expansion happens. Hence we will have equilibrium or non-equilibrium flow effects also here. The part entering the leeward side on the other hand undergoes a strong expansion. Hence it is to be expected that frozen flow exists there, with a frozen equilibrium or non-equilibrium state more or less similar to that in the stagnation region.

We note finally that in the flow of a gas mixture the Damkohler numbers of each of the thermo-chemical rate processes must be considered separately, since they can be vastly different. This would imply that a multi-temperature model, with, for instance, the translational temperature Ttrans, and vibra­tional temperatures Tvibri(i = N2,O2,NO), and appropriate transport equa­tions, Appendix A, must be employed, see, e. g., [7]. As a consequence of multi-temperature models one has to be careful in defining the local speed of sound of a flow, which is important for the stability of discrete computation methods, but also for the presentation of experimental data with the Mach number as parameter [1, 7].

In the following we consider shortly the basics of rate processes of vibra­tional excitation, and chemical reactions. For a thorough presentation see,

e. g., [1, 7].

For the vibrational rate process of a diatomic species we can write in general [1]

d’evibr _ evibr evibr fr

dt t * ’

Here evibr is the actual vibrational energy, e*vibr the equilibrium energy, and t the relaxation time. The equilibrium energy e*vibr is a function of the temperature T, eq. (5.13). The relaxation time t is a function of temperature and pressure/density, as well as of characteristic data ki, k2, Ovibr of the species (Landau-Teller theory [1]):

Подпись:ki T 5/6e(k2/T )1/3

p(1 — Є Є^іЬт/T ) ’

which for sufficiently low temperatures reads

e(k2/T )1/3

t = c—————— . (5-28)

P

Eq. (5.26) shows, since т > 0, that the vibrational energy always tends towards its equilibrium value. The relation in principle holds for large non­equilibrium, but due to the underlying assumption of an harmonic oscillator, it actually is limited to small, not accurately defined, departures from equi­librium [1].

Above it was said that full vibrational excitation cannot be reached, be­cause the molecule will dissociate before this state is reached. The transition to dissociation, i. e., vibration-dissociation coupling, can be modeled to differ­ent degrees of complexity, see, e. g., [9]—[11]. Often it is neglected in computa­tion methods, because it is not clear how important it is for the determination of flow fields, forces, thermal loads, etc.

Chemical rate processes without vibration-dissociation coupling can be described in the following way. For convenience we consider only the so called thermal dissociation/recombination of nitrogen [7]

N2 + M ^ 2N + M. (5.29)

Here M is an arbitrary other gas constituent. For the dissociation reaction (forward reaction: arrow to the right) it is the collision partner, which lifts the energy level of N2 above its activation, i. e., dissociation, level. For the recombination reaction (backward reaction: arrow to the left) it is the already mentioned “third body” M, which carries away the dissociation energy and conserves also the momentum balance.

The rate of change equation for an

This equation sums up all individual reactions r, which add to the overall rate of change of the species, i. e., the contributions of the reactions with dif­ferent third bodies M. In the case of the thermal dissociation/recombination of nitrogen, eq. (5.29), we have five reactions (r = 5), with M being N2, N, O2, O, NO.

In eq. (5.30) v’ir and v"r are the stoichiometric coefficients of the forward () and the backward (") reactions r of the species i with the third body M. The forward reaction rate of reaction r is kfr, and the backward rate kbr.

If a reaction r is in equilibrium, dcir/dt ^ 0, eq. (5.30) yields

kfr ГГ C – " = kfer ГГ ci " , (5.31)

ii

and the equilibrium constant

к – ^

c hr ■

(5.32)

The equilibrium constant of each reaction can be approximated by the modified Arrhenius equation [1]

Kc = CcTnc e-Gdiss/T,

(5.33)

with Odiss being the characteristic dissociation temperature. reaction rate is approximated by

The forward

kfr = Cf Tnf е-Єлі^^/т,

(5.34)

so that the backward reaction rate is

hr =

Cc

(5.35)

In these equations Cc, Cf, цс, Vf are independent of the temperature T

[1]-

We note that (global) equilibrium flow is only given, if all DamkOhler numbers DAM 1i ^ 0, which means that all reactions r of all species i are in equilibrium.

The constants and characteristic data for the above relations can be found in [1, 7]. Regarding a critical review of the state of the art see, e. g., [9].

Dissociation and Recombination

The excitation of internal degrees of freedom of molecules happens through “collisions”. If a molecule receives “too much” energy by collisions, it will dissociate. Recombination is the reverse phenomenon in which two atoms (re)combine to a molecule. However, a “third body” is needed to carry away the excess energy, i. e., the dissociation energy, which is released during the recombination process. The third body can be an atom or a molecule, but also the vehicle surface, if it is finitely or fully catalytic (catalytic surface recombination). At very high temperatures also ionization occurs. It is the species NO, which is ionized first, because it needs the lowest ionization energy of all species, Fig. 2.5.

Dissociation and recombination are chemical reactions, which alter the composition of the gas, and which bind or release heat [1, 7]. In equilibrium, Section 5.4, the five species N2, N, O2, O, and NO, are basically products of the three reactions

N2 ^ N + N,

O2 ^ O + O, (5.20)

NO ^ N + O.

If ionization occurs, we get for the first appearing product

NO ^ NO+ + eM (5.21)

We distinguish between homogeneous and heterogeneous reactions. The former are given, if only the gas constituents are involved. The latter, if also the vehicle surface plays a role (catalytic surface recombination). In the following Section 5.4 we discuss the basics of homogeneous reactions, and in Section 5.6 those of heterogeneous reactions.

High-Temperature Real-Gas Effects

High-temperature real-gas effects are called those effects, which make a gas calorically imperfect as well as the effects of dissociation/recombination of molecules. We note that a molecule has four parts of internal energy [1]:

e — etrans + erot + evibr + eel• (5.4)

Here etrans is the translational energy, which also an atom has. Rotational energy erot of a molecule is fully present already at very low temperatures, and in aerothermodynamics in general is considered as fully excited.[43] Vibrational energy evibr is being excited in air at temperatures above 300 K.[44] Electronic
excitation energy eel, i. e., energy due to electronic excitation, is energy, which like ionization, usually can be neglected in the flight-speed/altitude domain considered in this book.

The high-temperature real-gas effects of interest thus are vibrational ex­citation and dissociation/recombination. Dissociated gases can be considered as mixtures of thermally perfect gases, whose molecular species are calorically imperfect.

We illustrate the parts of the internal energy by considering the degrees of freedom f, which the atoms and molecules under consideration have. We do this by means of the simple dumb-bell molecule shown in Figure 5.3.

We see that molecules (and partly also atoms) have:

— three translational degrees of freedom,

— two rotational degrees of freedom (the energy related to the rotation around the third axis a—a can be neglected),

— two vibrational degrees of freedom, i. e., one connected to the internal trans­lation movement, and one connected to the spring energy,

Подпись: a) translation f=3 b) rotation f=2 c) vibration f=2

the possibility of electron excitation, dissociation/recombination and ioni­zation.

Подпись: f) ionizationd) electron excitation e) dissociation

^ (a (a –

ion electron

Fig. 5.3. Schematic of degrees of freedom f of a dumb-bell molecule, and illustra­tion of other high-temperature phenomena.

The internal energy of a mixture of thermally perfect gases in equilibrium is, with ші being the mass fraction of species i

n

e = ШіЄі. (5.5)

i=1

The internal energy of a species i is

ei etransi + eroti + evibri + eeli. (5*[45])

The terms etransi and eeli apply to both atoms and molecules, the terms eroti and evibri only to molecules.

The enthalpy of a gas is defined by [1]

h = e + ~. (5.7)

P

For thermally perfect gases we have, in general, with the specific heats at constant pressure cp and constant volume cv, and the gas constant R = cp –

cv

dh = cpdT = (cv + R) dT. (5.8)

Likewise it holds for the internal energy

de = cv dT. (5.9)

The principle of equipartition of energy [1] permits us to formulate the internal energy e, the specific heats cv, cp, and their ratio 7 = cp/cv of atoms and molecules i in terms of the degree of freedom f, which gives us insight into some basic high-temperature phenomena.

We assume excitation of all degrees of freedom (translational, rotational, vibrational) of atoms and molecules. We neglect eel, and obtain the general relations, [1], for a species with molecular weight M, R0 being the universal gas constant (R = R0/M)

— L—9.T – — L—4- — / + ^ До. _ f + 2

Є " 2 MT’ Cv ~ 2 M ’ Cp ~ 2 M ’ 7 " / ’ ^

which we now apply to the air species, Section 2.2.

Подпись: b atorrii 0 ] f - ’ Cl'ato High-Temperature Real-Gas Effects Подпись: = ’’ Д/ 7 7 aton-H = 1-666. (5.11)

Atoms (N, O). For atoms we obtain with three translational degrees of freedom (f = 3):

Molecules (N2, O2, NO)

Подпись: emoleci Подпись: 2 Mi ’ Cv Подпись: 5 До. 2 Mi' High-Temperature Real-Gas Effects High-Temperature Real-Gas Effects Подпись: 1.4. (5.12)

— Molecules with translational and rotational excitation only (f = 5) have:6

6).

This case with a heat capacity twice as large as that of atoms was proposed by M. J. Lighthill in his study of the dynamics of dissociated gases [5]. It yields a good approximation for applications in a large temperature and pressure/density range[46]

ж, cpmoleCi Ж, Imoleci 1.

High-Temperature Real-Gas Effects High-Temperature Real-Gas Effects High-Temperature Real-Gas Effects
Подпись: Ymoleci

— Molecules with an infinitely large number of degrees of freedom (f — ж). This is a limiting case, which means

Actually this is the property of Newton flow, Sub-Section 6.7.1.

Van der Waals Effects

Thermally perfect gases are gases, for which it can be assumed that its con­stituents have no spatial extension, and no intermolecular forces acting be­tween them, except during actual collisions [1]. This situation is given, if the gas density is small. For such gases the equation of state holds

p = pRT. (5.1)

If at the same time the specific heats at constant pressure cp and constant volume cv are independent of the temperature, we speak about thermally and calorically perfect gases.

If the molecular spacing is comparable to the range of the intermolecu­lar forces, “van der Waals” forces are present. This happens at rather low temperatures and sufficiently high densities/pressures. The equation of state then is written

p = pRTZ (p, T), (5.2)

with Z being the real-gas factor, which is a function of the “virial coefficients” B, C, D, … [2]

Z (p, T) = 1 + pB(T) + p2C (T) + p[42]D(T) + …. (5.3)

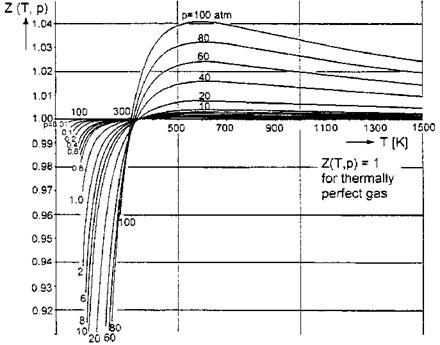
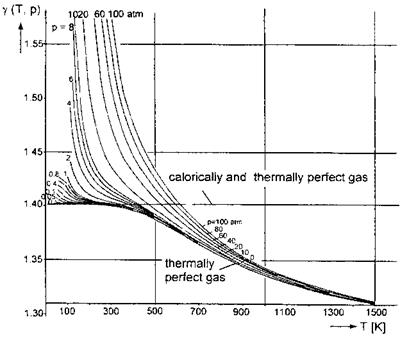
We show for the pressure range: 0 atm < p ^ 100 atm (1 atm = 101,325 Pa), and the temperature range: 0 K < T ^ 1,500 K, the real-gas factor Z(p, T) in Fig. 5.1, and the ratio of specific heats j(p, T) in Fig. 5.2. The data were taken from [3], where they are presented in the cited temperature and pressure range for non-dissociated air with equilibrium vibrational excitation.

Fig. 5.1 exhibits that especially at temperatures below approximately 300 K, and relatively large pressures, and hence densities, van der Waals effects play a role. However, the real-gas factor is rather close to the value one. The same is true for larger temperatures, where even at 10 atm the factor Z is smaller than 1.004.

The ratio of specific heats 7, Fig. 5.2, is similarly insensitive, if the pressure is not too high.3 The critical temperature range, where van der Waals effects appear, even at low pressures, again is below approximately 300 K.

Van der Waals Effects

Fig. 5.1. Real-gas factor Z(T, p) of air [3].

In order to get a feeling about the importance of van der Waals effects, we consider the parameter ranges in hypersonic flight, Sections 1.2 and 2.1, and find the qualitative results given in Table 5.1.

Table 5.1. Qualitative consideration of aerothermodynamic parameters in the flight free-stream, and in the stagnation point region of a flight vehicle.

Item

Speed v

Pressure p

Density p

Temperature T

v. d. Waals effects

Free stream

large

small

small

small

small

Stagnation area

small

large

large

large

small

We observe from Table 5.1 that in hypersonic flight obviously the tenden­cies of pressure/density and temperature are against van der Waals effects. In the free stream at small temperatures also pressure/density are small, whereas in the stagnation area at large pressures/density also the tempera­ture is large. Therefore in general we can neglect van der Waals effects in the flight regime covered by hypersonic vehicles in the Earth atmosphere.

Van der Waals Effects

Fig. 5.2. Ratio of specific heats y(T, p) of air [3].

The situation can be different with aerothermodynamic ground-simulation facilities with high reservoir pressures at moderate temperatures. Here van der Waals effects can play a role, and hence must be quantified, and, if nec­essary, be taken into account, see, e. g., [4].

Real-Gas Aerothermodynamic Phenomena

Real-gas aerothermodynamic phenomena in the context of this book are the so-called real-gas effects and flow phenomena related to hypersonic flight. Hypersonic flight usually is defined as flight at Mach numbers M ^ 5.[40] Here appreciable real-gas effects begin to appear. In this chapter we discuss the important real-gas phenomena with the goal to understand them and their implications in vehicle design.[41]

The basic distinction regarding real-gas phenomena is that between ther­mally and calorically perfect or imperfect gases. The thermally perfect gas obeys the equation of state p = pRT. A calorically perfect gas has constant specific heats cp and cv. We speak about a “perfect” or “ideal gas”, if both is given.

A gas can be thermally perfect, but calorically imperfect. An example is air as we treat it usually in aerothermodynamics. If a gas is thermally imperfect, it will also be calorically imperfect, and hence is a “real gas”. We note, however, that in the aerothermodynamic literature, and also in this book, the term “real gas” is used in a broader way to describe gases, which are thermally perfect and calorically imperfect. We will see in the following that real-gas effects in aerothermodynamics usually are high-temperature real-gas effects.

We first have a look at the classical “real gas”, the van der Waals gas. After that the high-temperature real-gas effects are treated which are of ma­jor interest in aerothermodynamics. Essentially we treat air due to the flight speed/altitude domain considered in this book as a mixture of the “thermally perfect gases” N2, N, O2, O, NO, implying that these are calorically imper­fect. Rate effects are explained, and also catalytic surface recombination. Finally computation models are considered.

We give only a few illustrating examples of real-gas effects, because real – gas phenomena, like flow phenomena in general, usually cannot be treated in an isolated way when dealing with aerothermodynamic problems of high­speed flight.

Remarks on Similarity Parameters

In the preceding sub-sections we have studied the governing equations of fluid flow. We considered in particular wall boundary conditions and similarity pa­rameters. The latter we derived in an intuitive way by comparing flow entities of the same kind, e. g., convective and molecular transport of momentum in order to define the Reynolds number.

The П or Pi theorem, see, e. g., [23], permits to perform dimensional analysis in a rigorous way. For us it is of interest that it yields parameters additional to the basic similarity parameters, which we derived above.

For the problems of viscous aerothermodynamics the ratio of wall tem­perature to free-stream temperature

T

T w

TO

is a similarity parameter [24].

A more general form is given in [19]:

Tw — Tref

Tref

This usually ignored similarity parameter is of importance, if thermal surface effects are present in the flow under consideration, Section 1.4.

Other similarity parameters are the Damkohler numbers, Section 5.4, con­cerning reacting fluid flow in general, but also the binary scaling parameter pL for flows in which dissociation occurs, see, e. g., [25, 26].

There are two aspects to deal with similarity parameters. The first is that they permit, as we did above, to identify, distinguish, and model math­ematically flow phenomena (“phenomena modeling”), for example, subsonic, transonic, supersonic and hypersonic flow.

The other aspect (“ground-facility simulation”) is that in aerothermody – namics, like in aerodynamics, experimental simulation in ground-simulation facilities is performed with sub-scale models of the real flight vehicle.

That this is possible in principle is first of all due to the fact that our simulation problems are Galilean invariant, Section 4.1. Secondly it is neces­sary that the relevant flight similarity parameters are fulfilled. This is a basic problem in aerodynamic and aerothermodynamic ground-facility simulation, because in general only a few of these parameters can be duplicated. A spe­cial problem is the thermal state of the surface. Nowadays ground-facility simulation models usually have cold and/or thermally uncontrolled surfaces.

For both aspects, however, it is important to use proper reference data for the determination of similarity parameters. For phenomena modeling pur­poses to a certain degree fuzzy data can be used. For ground-facility simu­lation the data should be as correct as possible, even when the resulting similarity parameters cannot be duplicated [27]. This is necessary in order to estimate kind and magnitude of simulation uncertainties and errors [28]. In design work margins are governed by these uncertainties and errors in concert with the design sensitivities [29].

4.3 Problems

Problem 4.1. A flight vehicle model in a ground-simulation facility has a length of 0.1 m. The free-stream velocity in the test section is 3,000 m/s. How long is the residence time tres, how long should the measurement time tmeas = tref be, if a Strouhal number Sr A 0.2 is demanded?

Problem 4.2. Compute /^suth, Mi, М2 for air at T = 500 K. What are the differences A^i and A^2 of Mi and p2 compared to MSuth?

Problem 4.3. Compute kHan, ki, k2 for air at T = 500 K. What are the differences Aki and Ak2 of ki and k2 compared to kHan? Compute k = kEucken with eq. (4.18), too. What is the difference between kHan and that value?

Problem 4.4. Compute cp for air at T = 500 K, and find 7 and Pr, the latter with kHan and with kEucken. Compare the two Pr with the result found from eq. (4.19).

Problem 4.5. Incompressible flow is defined by zero Mach number M. What does M = 0 mean?

Remarks on Similarity Parameters