Category FLIGHT MECHANICS MODELING and ANALYSIS

Takeoff and Landing Tasks

Takeoff and landing tasks are always critical for any aircraft. Since the aircraft would be carrying some loads, cargo, passengers, etc., for the takeoff task, the required high speed must be reached before the wings can generate the sufficient lift to balance the weight, and hence it has to travel a long distance on the runway [6,10]. The landing may be required at any time. The aircraft may have to land on a short runway.

7.2.2.1 Approach and Landing Task

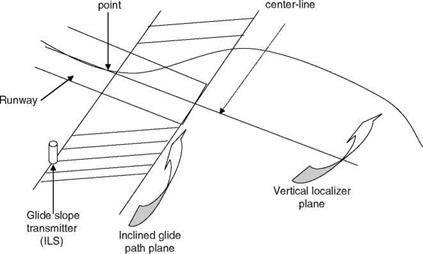
The landing-related portion consists of approach, flare, and landing. Normally, the approach altitude is 16 m (50 ft). This is a very crucial task, for which first the aircraft is maneuvered into a certain vertical plane called the ‘‘localizer’’ plane that is generated electronically by the ILS (instrument landing system) [6]. While in level flight, once intercepted, the nominal path intersects with a second ILS-plane called the ‘‘glide path’’ plane, the baseline of which is perpendicular to the runway center­line as shown in Figure 7.2. The intersection of the two ILS-planes provides the glide path or glide slope. The pilot concentrates his or her attention on the primary flight instruments and the ILS deviation indicator during the following sequentially inter­connected flight phases: (1) the first interception, (2) tracking of the localizer, and

Aircraft

landing touch-down Runway

image111

FIGURE 7.2 Landing flight path for an aircraft. (From Mooij, H. A., Criteria for Low Speed Longitudinal Handling Qualities (of Transport Aircraft with Closed-Loop Flight Control Systems), Martinus Nijhoff Publishers, The Netherlands, 1984.)

(3) getting into the glide path. The pilot decelerates the aircraft and gets into the landing configuration (while lowering the undercarriage), at the same time counter­acting atmospheric disturbances and any other deviations. While switching to the outside visual scene, the pilot initiates the landing by gradually rotating the aircraft. The velocity vector virtually changes into horizontal direction. The aircraft is flown with the main (rare) wheels against the runway surface and a soft and positive touchdown is made. The nose wheel is then lowered to make ground contact and the aircraft is decelerated to the taxi speed. The ground portion of the landing consists of aero/wheel braking and stop. The pilot should be able to minimize the distance required to land. Some very crucial conditions of the landing are (1) testing the landing for various weights, (2) height/elevation, and (3) the brakes are most important ingredients and must be evaluated for their precise performance. The data/information generally required are airspeed, pressure altitude, distance along the runway; engine revolutions per minute (rpm), temperatures/pressure measure­ments; and wind-related measurements.

7.2.2.2 Takeoff Task

The takeoff is also very critical task. This task is divided into two portions: (1) the ground acceleration and (2) takeoff/climb. The pilot uses a suitable method for the first segment, based on the flap settings, control settings, and steering methods. He or she will accelerate the aircraft sufficiently to obtain sufficient speed and then apply the stick control to obtain the best altitude for takeoff. When the aircraft is airborne the speed will be controlled to obtain the best angle for the climb. The landing gear would be retracted to reduce the drag effects. For trial fights the landing gears are kept in down position. The rotation maneuver should be smooth and the pilot should acquire and maintain the speed for best angle of climb. The takeoff and climbing tasks should be carried out for a few possible climb speeds and deployment of flaps. The pilot should minimize the distance required on the runway to takeoff. The required data/information are almost similar to that required for landing.

Flight Test Evaluation of a Transport Aircraft

Guidelines for the flight test evaluation of transport airplanes [2,3] provide an acceptable means of demonstrating confirmation with the applicable airworthiness requirements. Many of these procedures are also applicable to fighter aircraft. These methods have evolved over several years of flight testing of several such airplanes in air as well as on ground flight simulators and careful analysis of the data gathered. The guidelines are not mandatory; however, it would be definitely advisable to follow them to help compliance with the airworthiness (authorities’) requirements for a given transport aircraft undergoing flight testing. Some important aspects of flight testing from aircraft certification point of view are [2,3,8] (1) effect, if any, of altitude on controllability, stability, trim, and stall characteristics should be evaluated and studied, (2) performance of the aircraft in terms of stalling speed, takeoff speed, takeoff path, takeoff distance, climb, and landing should be evaluated during flight tests, (3) controllability, static stability, and maneuverability should be evaluated, (4) longitudinal and lateral-directional (LD) dynamic stability should be demon­strated and evaluated, (5) stall characteristics should be demonstrated/evaluated and stall warning system/software (SW) should be evaluated, (6) critical engine performance should be evaluated, and (7) vibration, buffeting, and other high-speed characteristics should also be evaluated.

PLANNING OF FLIGHT TEST MANEUVERS

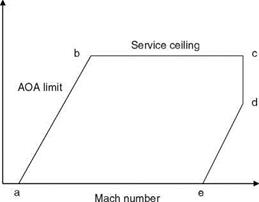
An aircraft should generally fly in the specified flight envelop defined by the altitude and Mach number (and for any required configuration parameters). A typical flight envelope is shown in Figure 7.1 [9]. The low speed limit ‘‘a’’ is stipulated by the maximum lift that can be generated by the aircraft wings. The high speed limit is governed by a constant dynamic pressure contour. One can see that as the speed is reduced from point ‘‘d’’ to point ‘‘e,’’ the air density is increased due to the reduction in altitude. This would maintain the dynamic pressure nearly constant. At higher altitudes the speed of the aircraft is governed by available maximum thrust. Service ceiling occurs because the engine cannot produce the required rate of climb.

Flight test planning consists of (1) specification of flight conditions, e. g., flight test points in the envelope, (2) aircraft configuration, e. g., mass, center of gravity (CG) (forward, aft), use/deployment of flaps/slats, the undercarriage, i. e., landing gear in up or down position, and carrying of any stores, (3) axis-specific control inputs, e. g., elevator, aileron, rudder pedal, and (4) engine conditions, e. g., single or both engines on. It is also important to specify the instruments/sensors required to monitor, display, or collect the flight responses/data that will be used for analysis. The sensor/instrument package should be at the CG as far as possible, as the case

Altitude

image110

FIGURE 7.1 A typical flight envelope.

may be. If the package is not at the CG, then the offset distance should be known and should be taken into account for correction of the data. Standard sensor/instrument packages should be used for accuracy and reliability of the data to be gathered. Sampling requirements must be specified well in advance. Flight test data processing skills are very important and require knowledge of signal processing and estimation methods. A complete flight test matrix consisting of these aspects with the full list of the requirements should be prepared and discussed with the concerned test pilots/flight test engineers. Flight tests exercises are generally carried out in several phases and often several aircraft versions (called technology demonstrators) are planned to concurrently undergo flight tests. This shortens the overall flight test time to go for certification. However, enough testing should be done in order to get the full confidence in the performance of the aircraft. This would need a gross time of hundreds of hours (that may run from 400 h onward depending on the type of the aircraft that is tested) of flight testing to scan all the important subsystems (propul­sion, landing gears, flaps, airbrakes, electrical systems, cockpit instruments, actu­ators, movement of control surfaces, structural vibrations, head-up displays (HUDs), effect of movement of CG, fuel transfer from one tank to the other, etc.) of the aircraft and many configurations (stores/missiles/tanks, etc.). Thus, flight testing is an iterative exercise and requires a coordinated effort among the test pilots, flight test engineers, design engineers, and subgroups of data analysts. Other important factors to be kept in mind are [1-3,6] (1) for realizing a simple maneuver too much time should not be spent (in air) and (2) the CG shift, weight, and flight envelope should be considered at the outset. Properly planned and conducted flight test experiments save a lot of effort, fuel, and time for the flight test engineers, pilots, managers, and the analysts. For the sake of consistency of the results it is desirable to perform at least three repeat runs (maneuvers) at each flight condition. The flight testing of the aircraft and related systems should cover the following areas: (1) air data calibration (very crucial task for feedback control variables), (2) aircraft loads, (3) excitation and monitoring of flutter, (4) high AOA tests and related data generation maneuvers, (5) preliminary handling qualities (HQ) evaluation, (6) stability and control character­istics evaluation, (7) open/closed loops HQ, (8) testing of aircraft/subsystem failure modes/ states, (9) engine and drag performance tests, (10) critical stores testing, and (11) carefree handling (if applicable).

Flight Test Maneuvers and Database Management

7.1 INTRODUCTION

Flight testing of an aircraft is required for several reasons [1-6]: (1) to test aircraft subsystems in the defined flight test envelope, (2) to validate flight control laws (for fly-by-wire inherently unstable/augmented aircraft), autopilot performance, and to prove core and new technologies, (3) to ascertain the ability of the aircraft to perform conventional and mission-specific maneuvers, (4) to establish the operating envel­ope, initial operational certification, and gradual expansion of the flight envelope based on the flight test results of the previous flights, (5) to demonstrate the compliance with civil aviation/military rules/specifications as per their requirements or advice, (6) to generate the data for future work in the design and development of a new aircraft or modification of the tested configurations for future upgradation, (7) to evaluate the ground effects on low-level flying, (8) to estimate aerodynamic deriva­tives for validation of the (predicted/wind tunnel) aero database used at the design stage of the aircraft, and (9) to evaluate pilot-aircraft interactions/handling qualities.

Flight tests are carried out at various stages of the aircraft modification and for confirmation of these modifications. The generation and establishment of the (updated) aerodynamic database via flight tests is a well-recognized method in an aircraft development program. A reliable and accurate estimation of aerodynamic derivatives from flight test data requires that certain modes of the aircraft are excited properly [7]. For example, it will not be possible to obtain accurate estimates of Cm and Cm if the longitudinal short-period mode is not sufficiently and properly excited, and hence the choice of an input form and shape of the signal is a very important aspect. From the foregoing, it is very clear that an integrated system approach is also important for successful accomplishment of the flight tests.

For a flying aircraft, controlling and monitoring its speed and altitude are very important; however, as one can realize, the aircraft controls, input mechanisms, and connected control surfaces are not designed or mechanized inherently to do this task quite independently. To perform a certain flight maneuver, most often and perhaps always a complex sequence of movements of a few, if not all, controls (surfaces) is required to be carried out. The concept of aircraft energy and its management is the most important aspect in understanding the requirement of flying an aircraft at a certain altitude and speed. The energy cannot be created (the law of conservation energy), but it can be converted from one form to another. The aircraft energy can be represented in the form of Quad-E [8]: (1) kinematic energy acquired as a result of flight speed, (2) potential energy acquired as a result of the aircraft being at a certain altitude, (3) the fuel’s chemical energy, and (4) thermal energy due to the exhaust gases, where applicable. An appropriate interplay of these energies can be advanta­geously used to understand flight maneuvers. The airspeed and altitude can be exchanged as a change in mechanical energy. Some important exchanges of energy are [8] (1) in a climb maneuver, the fuel is used (burnt) to meet the drag force and attain the altitude, (2) in cruise there is no maneuver and hence the fuel is consumed only to meet the drag resistance and there is not much change in airspeed and altitude, (3) in a sudden pullup the aircraft ascend to a new altitude and the airspeed decreases, (4) in a sudden pushover maneuver the altitude is sacrificed and the airspeed is gained; and not much fuel is spent, (5) in an initial portion of the takeoff roll the altitude is not changed but the airspeed is gained—fuel is spent, (6) in gliding the altitude is sacrificed to meet the drag force, and (7) in flare the airspeed is sacrificed to meet the drag force, without muchl change in the altitude and engine power. It is emphasized here that the altitude and airspeed are very closely inter­related. Reference [8] gives very interesting conversion factors, as a rule of thumb: (1) for a loss of 1 knot of speed, one can gain an altitude of 9 ft and (2) for a 1 ton aircraft, the climb by 6300 ft would spend 1 gallon more fuel. The energy exchange guidelines are as follows:

• If at low altitude and low speed, then there is not much energy, and hence more power is required to be added to gain the altitude.

• If at low altitude and with high speed, the energy might be sufficient; moderate stick pull might be required.

• If at high altitude and with high speed, there is too much energy and it might be required to reduce the power.

PC MATLAB®/SIMULINK®-BASED SIMULATION

Example 6.2

(6.38)

image96

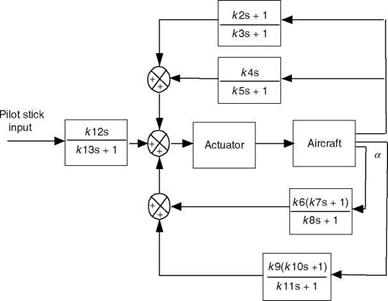
FIGURE 6.13 An unstable aircraft operating in a closed loop. (From Raol, J. R., Girija, G., and Singh, J., Modeling and Parameter Estimation of Dynamic Systems, IEE Control Series, London, 2004.)


q

az


The

The gain values (in the block diagram) used are k2 — 0.125, k3 — 0.212, k4 = 0.519, k5 — 2.0, k6 — 0.519, k7 — 0.13, k8 — 0.3, k9 — 0.0057, k10 — 0.01, k11 — 0.289, k12 — 1.0, k13 — 0.25, and kA — 20.

Solution

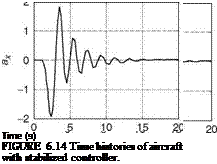
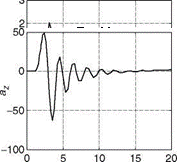
The control blocks and plant in Figure 6.13 are realized in SIMULINK. The relevant files are in “ExampSolSW/Example 6.2FS.’’ The simulation responses are obtained by using a doublet input signal with sampling interval of 1 s. Figure 6.14 shows the time histories of the output dynamics of the aircraft with a stabilized controller. It can be observed from the figure that the output responses settle after some transients, hence the controller stabilizes the aircraft. Moreover, the response of the aircraft can be further modified by adjusting gain values judiciously.

Example 6.3

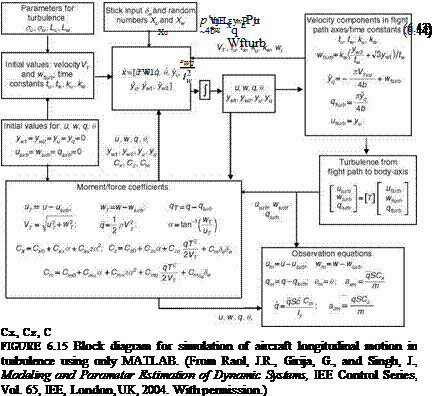
A block diagram representation to generate the aircraft time histories in the presence of turbulence is given in Figure 6.15 [23]. Realize this using MATLAB only. Obtain the responses with and without turbulence. Use the Dryden model for the turbulence and the procedure described here. This model generates moderate turbulence conditions modifying the forward speed, vertical speed, and the pitch rate. The dynamic model of the following form [24,25] is considered:

Подпись: (6.42)

image97
image98,image100

[ Xu + yukufnJDi/tu

Here, yu and yw are random numbers used for simulating the random nature of the turbulence; tu, tw, ku, and k„ are the time constants:

tu — LujVj; tw — LwjVj; ku — (2s2 tu)/ p; kw — (2ст^)/p (6.45)

Here,

Vj — Ju2 E w2; su — sw; Lu — Lw — 1750 ft (6.46)

Подпись: ufturb — xu; wfturb Подпись: qfturb — Подпись: [pxql 4b Подпись: (6.47)

Also, L — 1750 ft and the turbulence intensity is s — 3 m/s. This model of turbulence is incorporated into the flight dynamics state equations and a fourth-order Runge-Kutta integration is used to obtain the flight responses of u, w, q, and U and the turbulence response variables xu, xq, xw, and xw. Using the procedure outlined in Refs. [24,25] the turbulence in forward and vertical velocity and pitch rate can be obtained:

qm

Iy

The Dryden model for simulation of turbulence as described above has been used to generate the responses.

Solution

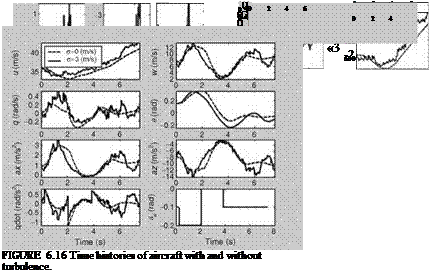
The blocks and their interconnections are realized using MATLAB and the SW is given in “ExampSolSW/Example 6.3Dryden.’’ The aircraft responses with and without turbulence (intensity = 3 m/s) are given in Figure 6.16.

EPILOGUE

The simulation of advanced rotorcraft requires high-fidelity mathematical models. The blade-element theoretic model possesses good fidelity and accuracy for such applications. However, such models with the required complexity would be slow for real-time considerations. Parallel processing would speed up such computations. The blade-element models also possess flexibility. In Ref. [26] an advanced rotorcraft flight simulation model is developed and it is specially suited to implementation on a parallel computer. In Ref. [27] the concept of using flight-recorded data for pilot training via RTS playback of flight maneuvers is developed. It also details the requirements for simulation-based flight reconstruction. A robust KF is used as a

image105,image106,image107,image108

state-estimator flight simulator driver. The methodology is validated for UH-60 helicopter nonlinear simulation. A procedure that combined the three steps is presented in Ref. [28]: identification of derivatives in linear/nonlinear models, comparison of the results to the original database, and update of the database if necessary. Further development of the nonlinear model can be found in Ref. [29]. In Ref. [30] the complete development of a 3DOF motion-based flight simulator is described. Nowadays well-validated flight simulation/control analysis SW packages are available [3,15,31].

EXERCISES

6.1 The aero database is given in the form of lookup tables (Section 6.2.1). Explain the theory of the Table lookup.

6.2 A system of equations with a wide variety of time constants, for the same dynamic system, is known as a stiff system of equations. What problem would it pose for the solution of these equations by the Runge-Kutta (RK) method?

6.3 The following are nonlinear state-space equations: x(f) = u(t)). Linearize

this system of equations using Taylor-series expansion.

6.4 Obtain the TF, Bode diagram, and step response of the elevator actuator model of Table 6.1. Also, use the booster dynamics: s2+52 293+3283 3 in conjunction with the actuator TF and obtain the composite TF model, its Bode diagram, and step response.

6.5 Obtain the Bode diagrams for the inner ears’ models of Equations 6.2 and 6.3.

6.6 Represent the basic elements’ operations of an INS in the form of a block diagram.

6.7 Take appropriate SI units and verify the formula dimensionally/units wise:

Qo = CdiAo^f.

6.8 In an actual aircraft what is the mechanism for trimming? In which way would a trim device help the pilot?

6.9 What is trimming IFS with respect to the EOMs/flight dynamics? Explain with reference to the state-space Equation 2.10.

6.10 In computer simulation of the dynamic equation of an aircraft or other systems, we may have to slow down or obtain a fast solution. For this, scaling is required to be done: t = at, where t is the computer time and “a” is the scale. Explain the significance of this with an example of a second-order system.

Flight Simulation Model Validation Using Direct Update

Another approach based on parameter-estimation technique that allows direct updates to the aerodynamic coefficient is briefly discussed [20]. It has the merits of capturing the nonlinearities in coefficients, joint dependence of a particular coeffi­cient on one or more independent variables, like a, b, d, and Mach number, and can encompass a process of model structure determination using splines and modified regression methods. The wind-tunnel predictions using the method of incremental coefficients determined from the flight data have been studied in Refs. [21,22]. In the present approach the nonlinear aerodynamic functions are obtained in the table lookup form. First, a nonlinear short period model to account for nonlinearities is postulated:

Подпись: "a = ■Z(a) V 1 + 'ZSe ' A. M(a) Mq_ q .Me,. (6.32)

The functional dependency on more than one variable can also be considered:

Подпись: a Z (a, d,)' 'Zqq' rvt* a ' Z(a, d,, q) ' .q. M(a, 8e) і .Mqq. U! .q. M(a, d,, q)_ (6.33)

To represent a nonlinear term (say, between two breakpoints) the interpolation formula can be used for the pitching moment as

(M2 – Mi)

M(a) = Mi + ————— (a — ai)

(a2 — ai)

(6.34)

(a2 a) (a ai )

M (a) = f-2——— L Mi + ±^ M2

(a2 — ai ) (a2 — ai )

(6.35)

M (a) = Wi(a)Mi + Wr (a)M2

(6.36)

Here, the nonlinear function is expressed in the form of a linear combination of the weights and the components of the moment variable at the breakpoints. Similarly, the expressions for 2-D formulae to represent the dependent variable as a function of two variables can be obtained:

M(a, b) = Wn (a)Wt2(b)Mij + Wa (a)Wr2(b)MiJ+1 + Wri(a)Wa(b)Mi+ij

+ Wr1(a)Wr2(b)Mi+1J+1

Подпись: -1 01 23456789 (a) a (°)
Подпись: (b) a (°)

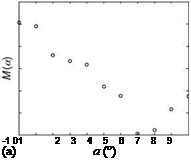
FIGURE 6.12 Aero data base validation: comparisons using direct method. (a) Estimate from flight data and (b) estimate compared with true value.

Подпись: (6.37)

With a 2 [a,-, ai+1] and b 2 b,,bi+1]. The weights can be computed separately for each dimension as done for the 1-D equation. Moment-related dependent variables are unknowns. The nonlinear functions M(a), Z(a) are estimated treating them as the function values at selected breakpoints expressed in the form of the following equation:

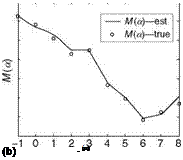
The above equation can be written in short as Y=Xb, with b as the parameter matrix, which is estimated using LS method: b = (XTX)^1XTY. Figure 6.12a shows a typical result obtained from the flight data of a supersonic fighter aircraft and Figure 6.12b shows the validation of the concept. The procedure is versatile and it should be validated using various flight databases.

Flight Simulation Model Validation Using the Concept of Coefficient Matching

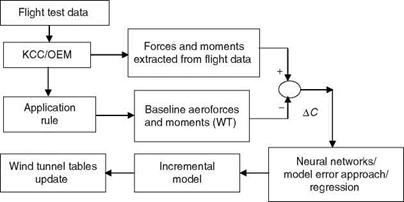
Although flight-control laws would have been designed using the linear math models of the aircraft, it is necessary to validate the entire design using nonlinear flight-simulation procedures. If required the models used in the design procedures should be modified based on the feedback from the flight tests conducted on the aircraft and its versions [19]. Most of the techniques for validation of the simulation model depend on estimating the linear models of the aircraft from flight test data at several flight conditions. However, as seen in Section 6.2.1, the aerodynamic database is given in the coefficient form and direct comparison is difficult and this approach of validation does not give a scope of updating the database that is in ‘‘lookup table’’ forms. An alternative approach is to estimate the aerodynamic coefficients from the flight data and determine the differences between the estimated coefficients and the ones obtained from the tables by applying the application formulae. Then an appropriate method can be used to model any discrepancies. The procedure requires a thorough validation of these models based on several sets of flight data and many flight conditions for getting consistent results. The discrep­ancy can be modeled by using either feed forward neural network (FFNN) or polynomial models.

Nominal aerodynamic coefficients can be computed from the application for­mula, which uses the aero database. The aerodynamic coefficients from flight/flight – like responses are estimated using suitable parameter estimation/Kalman filtering method. Direct use of the flight responses to compute the coefficient would give inaccurate results due to noise in the measure data. The estimation technique would be more accurate due to filtering out of the noise processes. It is obvious from Section 6.2.1 that all the signals/variables used for computing the coefficients from the application formula and parameter estimation would not be the same. However, within the structure of the rule used for these computations consistent sets of the flight variables/data should be used. Primarily the comparison should be carried out for the same flight conditions. A procedure of using this method is outlined below:

1. Compute the (nominal) force and moment coefficients using the application rule and related data.

2. Compute the coefficients from the flight responses by using an estimation technique.

3. Obtain the differences between these coefficients.

4. Fit FFNN or a polynomial model to these differences as functions of selected/required flight parameters.

5. Incorporate these incremental models into the nominal database models; this is likely to bring the upgraded coefficients closer to the actual ones.

6. Incremental models are compact ways to incorporate any future data – dependent variations into the database/coefficient base, i. e., new flight data can be used to get an updated database.

7. Model structure selection methods would be required to be used for getting adequate fit to the difference time histories of the coefficients.

image90

FIGURE 6.10 Processofvalidation/upgradingofaerodatabase. (FromSingh, G.K., Singh, J., and Basappa, K., Aerodynamic Data Update via Coefficient Comparison, National Aerospace Seminar in Hindi, organized by NAL, NAL, Bangalore, 27-28 July, 2006. With permission.)


image91,image92,image93

Figure 6.10 depicts the process of this method of validation and upgrading of the aero database. A typical result of the application of this process with simulated data is shown in Figure 6.11. Other important aspects to be kept in mind are the flight data should be in proper time-stamped form, accurate flow angle data should be used, and

there should be variation of mass and CG. The task of determining the terms in the aerodynamic model buildup that should be revised is not easy. It is an iterative process and requires considerable engineering judgment. The team should have extensive knowledge of the aerodynamic effects on stability, control, and perform­ance of the aircraft for which this exercise is being done.

Flight Simulation Model Validation for a Rotorcraft

The flight-control system should be evaluated in a nonlinear simulation mode with a larger portion of the flight envelope and with larger amplitude maneuvers. For this purpose the nonlinear control system elements, like rate limiting, etc., should be modeled and included in the flight simulator evaluation experiments.

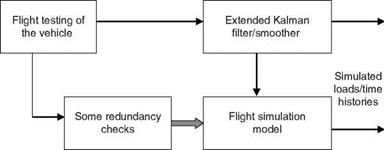
A systematic approach to flight simulation model validation for a rotorcraft would have the following specific aims [18]: (1) to identify a consistent set of vehicle states and inputs. The data-processing methods should be employed to check the consistency and these data must be consistent to justify model changes based on the flight test data; (2) the aerodynamic loads should be estimated from the flight test data. This is a major uncertainty in rotorcraft simulation. These estimates must be compared with simulation results for identical flight conditions; (3) once the discrepancies are identified, the math model of the vehicle (rotorcraft) should be upgraded using the model structure determination and parameter-estimation methods by matching the flight test results. The idea is to drive both the simulation flight controls and the simulation states with the flight test time histories (see Figure 6.9). If the aerodynamic loads compare well, then the trajectories should match well when the fuselage DOF equations are integrated. If these loads do not match, then the simulation is not generating some of the aerodynamic loads. The KF/smoother estimates biases and misalignment errors and reconstructs the net aerodynamic forces and moments. If there is a mismatch, then a comparison between simulated and measured flapping should be done to isolate the problem. This could identify a problem in the main rotor. The regression method was used to identify correlation between the simulation error and the vehicle states and the structure of the math model was upgraded for the US Army/McDonnell Douglas AH-64 Apache attack helicopter [18]. This is a practical example of the use of system identification and state-estimation methods for validation of nonlinear helicopter simulations from the flight test data.

Estimated

loads/time

histories

image89

SIX DOF SIMULATION AND VALIDATION

A 6DOF flight simulator is required for a fighter aircraft development program to carry out full nonlinear flight dynamics simulation and for aiding the design of flight – control laws, via iterative validation of these laws. Also, it is required for evaluation of the control laws during the design process and even during and after the flight tests of the prototype aircraft. A simulator would consist of (1) visual system hardware—projector, screen, instrument panel/virtual instruments, (2) visual soft­ware—terrain, runway near airfield, clouds/rains visuals, (3) cockpit with throttle handle, pitch-roll control stick, rudder pedals, and the pilot’s seat, (4) computers mainly PCs, to solve flight dynamics equations, atmospheric models, and execution of software to link various subsystems/models, and (5) data acquisition system.

The generation of visual imagery is very crucial to obtain good fidelity of the simulator [4]. Video films/CCTV (close circuit TV) camera can be used for visual scene creation. The CCTV camera captures the terrain view (from its physical model) and the view is projected on the screen of the simulator. Computer generated imagery (CGI) is used to generate the required imagery in real time. This is the most widely used system for visual generation/simulation.

The steps for generating visual imagery are (1) definition of objects—runway, roads, trees, buildings, clouds, terrain, and lights—this defines a viewing volume, (2) creating the objects with appropriate texture and level of detailing (LOD) required

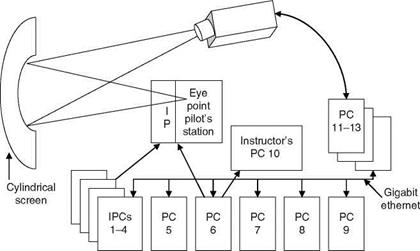
and storage of these data/information, (3) creating the visuals by appropriate defini­tions of all the required/desired objects with respect to some reference coordinates system, and (4) linking of the virtual world to the dynamics of the flight by appropriate timing and coordinate transformation and projecting the visuals on to 2D screen form the pilot’s eye point. This is called a rendering-projecting-timing cycle for visual simulation with delays of less than 100 ms and a screen refresh rate of about 60 Hz. If the monitor screen has to display the graphic picture of 1280 x 1024 pixels with depth complexity 4 units, then at the rate of 60 Hz, the pixel transfer rate needed is 4 x 60 x 1024 x 1280 = 312 Mpixels/s [4]. This can be provided by four raster managers with 80 Mpixels/s. The raster-type computer display is generally used for this purpose. It draws the images by dots or pixels and each pixel is represented by a sequence of bits. The map of one screen represented in the form of bits is termed as bitmap and the location of the corre­sponding bit in the computer memory is called the frame buffer. A display controller passes the contents of the frame buffer to the screen at the rate of 30 Hz to avoid flicker. Interestingly, many powerful visual software modules are available now­adays, but could be very expensive. Development of such SW could be very time­consuming and involves a lot of effort. A good picture of interconnectivity of various HW/SW modules of a PC-based flight simulator is given in Figure 6.8. The pilot’s eye point is rigidly linked to the aircraft altitudes and positions in relation to the Earth. The variables that change during flight progression update the visuals (visual scenery) as observed by the pilot.

image88

FIGURE 6.8 Schematic outline of a PC-based flight simulator. (IPCs 1-4: instrumentation data/simulation; PC 5: flight model, autopilot; PC 6: data acquisition system; PC 7: avionics simulation; PC 8: data storage/feel system simulation; PC 9: aural simulation; PC 10: instructor’s station; PC 11-13: visual system/SW; IP: instrument panel/displays.)

Computation of Linear Models for Control Law Design

Not always, but more often than not, it is wiser and simpler to use the linear approach for the design of control laws. For this, one needs the linear dimensional models of the aircraft dynamics at several flight conditions in the flight envelope. These linear models are computed by a sophisticated program within the structure of nonlinear flight simulation, which uses aero database. The linear models are obtained by specifying Mach number, trim angle of attack, altitude, slat deployment, if any, and undercarriage up or down position. The linear simulation software would give linearized models along with the modal characteristics like eigenvalues and damping ratios of the longitudinal and lateral-directional modes (Chapter 5). Several thousand linear models would be required because of the variety of flight conditions and configurations in the entire flight envelope, as can be seen from the application formula. These linear models are then studied to arrive at important flight mechan­ics parameters (Chapters 4 and 8). It is important to evaluate the flight mechanics parameters of the aircraft from the aero database to assess the need for control-law design. These parameters would help assess the aircraft’s capability as well as deficiencies in the dynamics. These deficiencies could then be compensated by designing proper flight-control algorithms/laws/systems. Also, it is important to evaluate the dynamic characteristics and responses of the aircraft and study its handling qualities with flight simulation exercises while in the process of develop­ment of the aircraft (program). The flight mechanics parameters and linear models of the aircraft can be obtained using the equilibrium analysis of the aircraft dynamics.

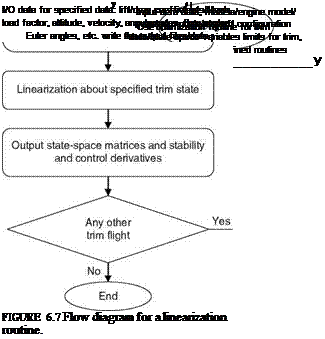
In fact, an aircraft is required to be trimmed for a given flight condition and then the linearization routine is used to obtain linear models at these flight conditions. Figures 6.6 and 6.7 give the flow diagrams of these routines. The derivation and development of linear models for an aircraft and related programming aspects are detailed in Refs. [16,17]. Such a program would consist of several modules [14] for (1) input data, (2) aerodata, (3) aerodynamic models, (4) engine model, (5) trim routine that would satisfy the required trim constraints according to the trim condi­tions set. This routine would also convert the trim parameters to control surface deflections, and (6) output results module, which will give the linear model stability and control derivatives, all the state-space matrices, and modal parameters of the aircraft dynamics at the chosen flight conditions.

The linearization can be done using the finite difference method. Let the non­linear equation for the aircraft dynamics be given as

Define a certain operating point as x0 = f(x0, u0) and use Taylor’s series linearization to obtain

df df

x(t) ffi x0 + (x — x0) + (u — u0) + (higher-order terms neglected)

dx du

df _ df _

x(t) — JC0 = ~ + u

Подпись:

image85,image86

dx du


The linearized equations would be represented as

x(t) = A’x + B U (6.30)

Подпись: /1 (xp + Dx1, up) - / (x0, up) Ax1 Подпись: /1 (xp + Ax„, up) - /1 (xp, up) Ax„

The numerical linearization routine would obtain the elements of the matrices A’, B’, (and C’, D’ of measurement equation) using a finite difference method, as shown for matrix A below:

Подпись: A0

Подпись: fn(xp + Axj, up) - /1 (xp, Up) . Ax1 Подпись: /„(x0 + Ax„, up) - /„(x0, up) Ax„

(6.31)

Similarly for matrix B, the point (x0) is kept fixed and the point (u0) is perturbed by a term (Au,) for each element appropriately. A similar procedure can be followed to obtain the elements of the linearized measurement matrices C’ and D’. The step size for evaluating the numerical difference is typically given as

Ax, ! 10-7* x,

Forward differencing has been found to be quite accurate for the numerical compu­tation. Alternatively, a fixed value of 10e — 7 can also be used for the step size.