Category FLIGHT MECHANICS MODELING and ANALYSIS

Rate of Climb and Turn Coordination Flights

In some of these the steady-state flight conditions do not apply, since with the change in the altitude the atmospheric density varies. In steady turning flight f, p, q, r will not be zero. Once the rate of climb is determined, the linearized models can be used for nonzero flight path angles. The turn is specified by ф = V, with rt as the turn radius. The angular rates can be computed from kinematic equations. A coordinated turn is such that the aircraft is banked/rolled at a required angle in order that there is no Y-axis force. This will necessitate solving the constraints for roll angle and the pitch attitude simultaneously. Following Refs. [2,15] we have the following equation for the flight path angle (assuming the wind velocity as zero):

sin g = a1 sin U — a2 cos U (6.16)

Here, a1 = cos a cos b and a2 = sin f sin b + cos f sin a cos ft. The pitch attitude is given as

a1a2 + sin g {a2 — sin2 g + a2} p

tan U =—————– 2————————– , with U = ±— (6.17)

a21 — sin2 g 2

In wings-level for b = 0, we have U = a + g.

In a coordinated turn the force Fy is assumed zero and with the steady-state condition V = 0 (the Y-axis velocity), we obtain from Equation 3.23, assuming full nonlinear EOM:

We have the conditions ф = 0 = 0, and we use the following equations

P

1

0

— sin 0

■ф’

Q

=

0

cos ф

sin ф cos 0

0

(6.19)

R

0

— sin ф

cos ф cos 0

.ф.

to obtain the expressions for P and R as follows:

P = —ф sin 0

Q = cos ф + ф sin ф cos 0 (6.20)

R = ф cos ф cos 0

We also have the following expressions for the aircraft velocities:

U

Vt cos a cos b

V

=

Vt sin b

(6.21)

W

Vt sin a cos b

Then, substituting for R, U, P, and W in Equation 6.18 and just simplifying, we obtain the following equation:

g sin ф cos 0 = фVt cos b [cos ф cos a cos 0 + sin 0 sin a] (6.22)

Finally, we obtain the required constraint condition for the coordinated turn

Подпись: (6.23)sin ф = – фVt cos b[cos ф cos a + tan 0 sin a]

g

Next, the solution of Equations 6.17 and 6.23 together yields [2,15]:

(a — b2) + b tana^Jc(1 — b2) + g2 sin2 b


tan ф = gc cos b sec a


(6.24)


a2 — b2(1 + c tan2 a)


Here, gc = ф V, the centripetal acceleration, a = 1 — gc tan a sin b, c = 1 + g’^ cos2 b, and b = sin g sec b. It must be emphasized here that Equation 6.24 would be solved by the trim routine when other required information is supplied to it. Then the value of the pitch attitude can be obtained from Equation 6.17. When the flight path angle is zero we obtain from Equation 6.24, since b is zero, the following expression:

gc cos b

cos a — gc sin a sin b

When the slide slip angle is very small, and since the flight path angle is zero, we have from the following equation:

„ , gc ФУ,

tan f = = (6.26)

cos a gc cos U

Steady-state flight and trim conditions

It is important to obtain steady-state flight conditions for obtaining the linearized mathematical models of the aircraft at various flight conditions, since these models are required for the design of control laws [2,9,13]. An aircraft is considered to be in

an equilibrium state when all its state derivatives become zero simultaneously, the mass being assumed constant. This is a stringent requirement and it may not be possible to attain this in all types of flight conditions. The conditions like wings-level and level turn, wherein the rotational and translational accelerations are zero and with Euler angular rates as constants, are practically feasible situations and hence useful to study. Such conditions are called quasi-steady states. To obtain steady-state equilibrium of aircraft (dynamics), the trim state should be obtained by estimating the control settings such that the accelerations have zero values. The equilibrium point is f (x, x, u) = 0, with x = 0, u = 0, or constant. Due to this condition the system is at rest. The aircraft then flies in steady wings-level and can have steady turning flight. Also, a wings-level climb and a climbing turn are possible. The steady flight is defined in terms of the following variables: p, q, r, V, a, 3 = 0; u = constant.

Flight-specific constraints are

Steady wings-level: f, f, U, ф = 0 (p, q, r = 0);

Steady turning : U, f = 0 (turn rate ф)

Steady pullup : f, f, ф = 0 (pullup rate (?)

Steady roll : U, ф = 0 (roll rate f)

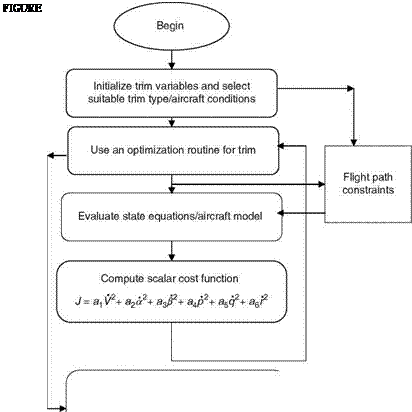
The condition p, q, r = 0 dictates that the angular rates and aerodynamic and thrust moments should be zero or constant. Also, V, a, 3 = 0 dictates that the aerodynamic forces should be zero or constant. In order to arrive at steady-state conditions, a set of nonlinear simultaneous equations need to be solved. Due to the complexity of the EOMs, a numerical routine is necessary to adjust the independent variables to meet required criteria/constraints. The knowledge of aircraft behavior would be useful to specify steady-state conditions and achieve the required trim. A trim routine flow diagram is given in Figure 6.6. For steady translational flight, the constraints are p, q, r, f = 0. The trim surface positions and other variables are determined by numerically solving the nonlinear equations for translational and rotational acceler­ations. The pitch attitude can be determined from the attitude rate.

For pullup/pushover the trim is computed with the following conditions: p, r, f = 0. The pitch rate is computed as:

q = {mg(n + cos(a — ()) — ZT cos a + XT sin a} (6.13)

Vm cos 3

There are other trim conditions possible: (1) thrust-stabilized turn trim, (2) specific power trim, and (3) 3 trim. The thrust-stabilized condition yields a constant nonwings-level turn with a nonzero altitude rate. The constraints are the same as the level turn. The altitude and the Mach number are specified for the thrust – stabilized trim condition. The specific power trim situation yields a level turn at specified altitude, thrust trim parameter, specific power, and the Mach number. The specific (excess) power is given by (see Exercise 7.9)

dh V dV d t g d t

image84
Then the velocity rate is obtained, with the altitude kept constant:

V = pf (6.15)

The other states p, q, r, a, /3 would be zero if the required trim point is obtained. Other constraints need to be satisfied for this specific power trim [14].

Example 6.1

Develop trim routine based on MATLAB following the flow diagram given in Figure 6.6. Aircraft geometry/configuration data need to be provided for the chosen aircraft. Also aerodynamic derivatives (or the aero database/aerodynamic coefficients are needed [2]). This builds up the math model of the aircraft. The cost function needs to

TABLE 6.2

Results of Aircraft Trim Routine

Altitude

Airspeed

Cost

Throttle

Elevator

Alpha

(ft)

(ft/s)

(Approximate)

Value

(°)

(°)

0

150

2.0e-25

0.254

— 18.2

22.8

20k

300

2.02-24

0.176

4.29

8.88

be tailored to specific aircraft/sets of equations. MATLAB’s “fminsearch” can be used for minimization of the chosen cost function.

Solution

The programs (for a transport aircraft/for three degrees of freedom (3DOF) model) written in MATLAB are given in the directory ‘‘ExampSolSW/Example 6.1Trim.’’ The file ‘‘main. m’’ needs to be run in MATLAB. You can specify speed and altitude. Some results are given in Table 6.2.

Flight Dynamics

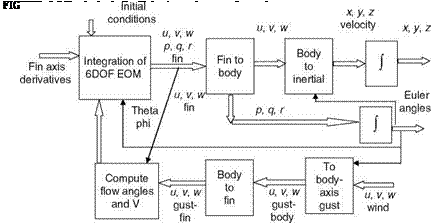
The flight dynamics of a vehicle to be simulated should be fairly accurately known. It is important to know the aerodynamic coefficients at all the flight conditions in the aircraft flight envelope. These are obtained from the wind-tunnel aero database and by application formulae. The EOMs are given in Chapter 3, and axes-transformation relations are given in Appendix A. Figure 6.5 depicts a flight dynamics simulation block diagram for a typical missile. The fin axis aerodynamic derivatives are first specified. The fin to body (noted as ‘‘b — f’’) transformation is done using the following matrix (angle f is generally 45 °):

Подпись:

image83

1 0 0 0 cos w — sin w 0 sin w cos w

Body velocities are converted to inertial by using the direction cosine matrix. The inverse transformation is obtained by transposition of the respective matrices. The deterministic gust effects are transformed to fin axis for flight simulation. For numerical integration of nonlinear flight dynamics, generally the Runge-Kutta (R-K) method is used. It works well for a good number of such simulation problems, even with moderate discontinuities. In fact, it approximates the Taylor series method. Certain aircraft flight simulation aspects are illustrated by Examples 6.1 and 6.2, which demonstrate the complexity of the problem. Development of complete flight simulation is a highly complicated process.

Turbulence and Gust Models

The aircraft flies in an atmosphere where its responses are affected by atmos­pheric disturbances (Appendix A) and these create additional forces on the aircraft. These disturbances are (1) gust, (2) turbulence, (3) wind shear, and (4) cross wind. The turbulence is a random phenomenon (Example 6.3). The other effects are represented by suitable deterministic models, which are usually obtained from experimental data.

6.2.12 Sensor Modeling

Sensors are used to derive the measurements of the aircraft’s positions, angular rates, accelerations, and other information of importance for monitoring the flight performance as well as for the use of sensed variables in the computation of control laws. Rate and acceleration sensors can be modeled as first-order lag. The vanes used for deriving the measurement of flow angles can be modeled as second-order TF. Flow angles can also be determined from the pressure probes that measure local and impact pressures. The computation of the flow angles from these data involves a computational delay. A first-order lag model can be used for the flow angle simulation.

Motion Cues

The pilot in the actual flight of the aircraft experiences the natural motion cues; this is more so in the case of a fighter aircraft. Some motion (cues) aid the pilot in stabilizing and maneuvering the aircraft by confirming that the pilot’s internal model response and the aircraft responses match very well. Some other motions of the aircraft alert the pilot to ensuing system failures [1]. In a fixed-base flight simulator motion cues are absent and the only cue is via the visual cues from the instruments and the simulated view of the outside world. These visual cues of motion are very important low-frequency cues. The vestibular system of the human is a sensor of motion and position. The semicircular canals in the inner ears are the rotational and motion sensors. They act as damped angular accelerometers. Three such canals form an almost orthogonal axes system in each ear and sense angular accelerations as low as 0.1 °/s2. The linear motion is sensed by the otoliths of the inner ears. They sense specific forces, the external or nongravity force, with the threshold as low as 0.02 m/s2 and can detect a tilt of 2°. A system approach to human perception of orientation and motion has been developed. The vestibular sensors are modeled as mechanical systems. The parameters of these models have been validated by several experiments of human perception IFSs. The semicircular canal model is given as [1]:

Afferent firing rate (°/s2) 0.07s3(s + 50)

Physical stimuli (°/s2) (s + 0.05) (s + 0.03)

The velocity threshold for this model is 2.5°/s. The otolith TF is given as

Подпись: (6.12)yoto _ 2.02(s + 0.1)

f _ (s + 0.2)

The velocity threshold for this model is 0.2 m/s. There are other physiologically based cues like the visual, proprioceptive, and tactile cues. In general the proprio­ceptive sensors are associated with the vestibular system, the joints, muscles, and the internal organs of the human body. Very interestingly the processing of the sensor signals by the central nervous system can be effectively modeled by a steady-state KF. The spectrum of sensing spans a lower frequency (visual) to higher band due to proprioceptive and other cues, thus the earliest recognition of the motion is possible and hence the usefulness and importance of motion cues/sensing in flight-training simulators. The motion system’s bandwidth should be at least slightly greater than the simulated aircraft’s rigid body dynamics. Also, various tasks which need to excite the motion cues (sensors) should be such that they fall within the bandwidth of 0.1—1.5 Hz, the body sensors’ active sensitive region. In general elaborate visual cues are effective for many piloting tasks IFSs; however, human eyes are slow in perceiving motion. Before any visual cue sensing takes place the human brain receives the acceleration cues. Many body sensors detect the acceleration and the signals are communicated to the brain in milliseconds. If the motion cues are needed then, the motion system should be systematically designed and integrated. This will enhance the quality and utility of motion cues.

Control Loading and Sound Simulation

resistance to its movement. This resistance is ‘‘felt’’ by the pilot on the stick, if it is a reversible system. Thus, the pilot gets the feel of the forces acting on the control surfaces when these are moved. This should be simulated in the flight simulator to enhance its fidelity. This aspect is achieved by the control loading system (CLS), which produces the feel forces on the simulator flying controls [1]. To achieve the correct control feel, it would be necessary to utilize a good math model of the system. This math model can be formulated from the aircraft manufacturer’s control data. The information on wiring diagrams, mechanical gearing, graphical representation of forces, and control surface deflection would be used. The models are derived from the analysis of these data with associated features. The numerical values of position limits, inertias, control surface gearings, and autopilot drive rates are included in the model. In most cases, the second-order models are used to represent both the ends of the control arms. Aircraft surface actuator is modeled using a first-order TF. The pilot’s applied force is obtained from the load cell data and the autopilot drive is synthesized in the host computer. The minimum interaction rate required for the computer is 500 KHz so that the simulated feel is properly integrated with the pilot’s senses.

If required, sound simulation should be incorporated in the flight simulator. The current trend is the use of DSP and a totally digital sound system can be integrated with the other systems. Often the actual sound recording is done from the aircraft (engine/propulsion systems) and the sound is synthesized using filtering algorithms and DSP.

Landing Gear

The study of the landing gear subsystem is important in simulation (and also in control analysis) of touchdown and ground roll. Landing gear dynamics play an important role during and after the touchdown and before takeoff. Also, the suspension geometry (cantilever or telescopic, lever or trailing link, semiarticulated), the braking system, and nosewheel steering and other related aspects should be kept in mind. Some important typical landing-gear elements to be modeled are described next [10].

Oleo-pneumatic strut: It contains two chambers telescoping into each other. It is partially filled with compressed air and oil. When the strut is extended or com­pressed, the oil flows between the chambers via a metering orifice. The damping is due to the viscosity of the fluid and the compressed air acts as a spring. The spring action is nonlinear and follows Boyle’s law: PVg = constant. Here, P is the chamber pressure of the gas, V is the chamber volume, and the exponent is the gas constant.

The damping effect is based on the orifice flow as expressed by Q0 = CdiA0 y/2DP.

Here, Q0 is the flow rate through the orifice, Cdi is the discharge coefficient, A0 is the area of the orifice, DP is the differential pressure across the orifice, and r is the density of the oil. The composite force across the strut is the sum of the spring and the damping forces and this model is equivalent to a spring and damper systems in parallel.

Tire Dynamics: The pneumatic tire acts as a spring in the vertical axis. As a first approximation the characteristics of an automobile tire can be used. The forward direction frictional force helps the aircraft to decelerate.

Engine Model

This is a crucial subsystem for any aircraft. The power plant is a jet engine or a low bypass turbofan. The thrust attained at the equilibrium depends on the power lever angle, altitude, and Mach number. It is very important to model the engine transient response during takeoff and landing. A jet engine has three major stages: (1) the compressor, (2) the combustion chamber, and (3) the turbine stage. The intake and

Saturation

image82

FIGURE 6.4 Shaping model for power lever angle PLAO-PLA output to access static thrust database.

the diffuser are the other important stages. For the purpose of the flight simulator it is not necessary to use the complete nonlinear model that models all the stages of the engine. IFS it is enough to excite the engine model at sufficient points in the flight envelope and determine the time constants. Predetermined time constants and inter­polations can be used during the simulation. A first-order model can be used as shown in Figure 6.4 [10,12].

Actuator Models

A typical actuator comprises electric, hydraulic, and mechanical elements. A comprehensive mathematical model of an actuator is required for the design of flight-control laws and nonlinear flight simulation. For control-law design, a small – amplitude linear model is sufficient. The large-amplitude behavior is also very important for nonlinear simulation. This behavior is characterized by a first-order system dynamics with limits of position, rate, and accelerations of the actuator (and the control surfaces). The typical actuator model constants for a transport aircraft are given in Table 6.1 [9].

The actuators used on aircraft are of two types: direct drive valve (DDV) and electro-hydraulic servo-valve (EHSV) [10]. DDV is designed to produce a large force to overcome forces due to flow, stiction, and acceleration or vibration, and the force motor is directly attached to and positions a spool valve (the force motor directly couples to the main control valve). A position feedback from the spool position to the input voltage is present. In the EHSV the first stage of a hydraulic preamplifier multiplies the force output of the torque motor to a sufficient level for overcoming the opposing forces. A direct position feedback through a flapper and nozzle arrangement is obtained in EHSV. The actuator consists of an electric force motor driving a main control valve, which in turn drives the main ram piston against the load. This is achieved by the flow of hydraulic fluid across it. The actuators themselves have two position feedback loops. DDV and EHSV can be modeled as a first-order transfer function (TF):

Подпись:x_ K /T e _ s + 1/T

Here, x is the valve position and e is the input voltage to the valve. If necessary a second-order model can be used. The model of the valve flow can be obtained as described here. The load flow can be expressed as a function of the valve position

TABLE 6.1

Control Surface Actuator Model Parameters

Elevator

Aileron

Rudder

DC gain

0.89

0.73

0.795

Time constant (s)

0.06

0.07

0.07

Position limits (0)

-19 to 16

—21 to 21

— 30 to 30

Rate limits (0/s)

—30 to 30

—79 to 79

—50 to 50

and the load pressure, neglecting the return pressure and for a constant supply pressure:

Подпись: (6.4)Q = f (x, P)

The expression in terms of small changes can be obtained as

df df

DQ=Dx+@PDP (6-5)

since f is essentially a function of Q variable

@Q @Q

DQ = – Q Dx + @Q DP (6.6)

Next, we define the sensitivities as Kx = @Q as the flow gain and Kp = as the flow

pressure coefficient to obtain

DQ = KxDx + Kp DP (6.7)

We can also define the pressure sensitivity as Kpx = @Q = K- Kx = K, and insert­

ing this into linearized expression we obtain

Kx

DQ = KxDx + KL dp (6.8)

Kpx

DQ = Kx ^ Dx + ^ (6.9)

Finally, in the form of perturbation variables (using the same symbols) for small amplitude variation, we get

Q = Kx[x + K^) (6.10)

The main rotor ram assembly model can be found in Refs. [10,11]. The hydraulic subsystems are hydraulic pumps, accumulators, and hydraulic lines. The pump can be modeled as first-order lag dynamics. The lines’ dynamics can be approximated as lumped parameter coefficient.

Instrumentation System

In modern simulators, most of the traditional instrumentations/instrument panel would be replaced by multifunctional displays and soft instruments or virtual instruments. The point is that if AOA is needed to be displayed, it does not matter what mechanism drives the AOA ‘‘pointer,’’ which could be a ‘‘soft pointer’’ and not the physical hard pointer of the classical instrument. Thus, the computed values of the flight variables are displayed by the soft instruments. This shifts a considerable amount of burden from hardware mechanisms of driving motor, etc. to software tasks. This reduces/eliminates the wear and tear of the instruments/driving motors as well as the maintenance and heating of the hardware components. However, for safety, there should be some redundancy provided via analytical means or some important instruments should be still provided in the traditional hardware.

6.2.2 Inertial Navigation System

The inertial navigation system (INS) consists of a stable platform with gyros and accelerometers. The gyros maintain the platform’s accelerometers in a steady posit­ion in relation to the Earth’s surface so that accurate measurements of accelerations are provided [1]. These acceleration data are integrated to produce aircraft velocities. The computer platform heading resolves the velocities through the heading angle to produce North/South and East/West components of the velocity, which in turn are integrated to obtain the distance. This distance with the datum latitude and longitude gives an accurate present position. The INS platform and the computer form the INU. Software simulation of INU is often used. Software simulation has several merits: (1) ease of availability of the required data, (2) ease of update of the SW, and (3) reasonable simulation computer core and time requirements.

6.2.3 Flight Management System

aircraft performance data. The crew use these data to perform (1) navigation, (2) guidance, (3) electronic flight instrument system (EFIS) support, and (4) data displays. The outputs are command data to flight control. The usual practice is to replicate the (aircraft’s) HW FMS for the simulation also and not perform the SW simulation of the FMS [1].