Our heavyweight helicopter equal in the world does not have
In Rostov started production of the most load-lifting rotary-wing car The Russian holding «Helicopt[...]

Everything about aircrafts and helicopters. News and events in aviation worldwide. Civil, transportation, military helicopters and airplanes.

Everything about aircrafts and helicopters. News and events in aviation worldwide. Civil, transportation, military helicopters and airplanes.

Everything about aircrafts and helicopters. News and events in aviation worldwide. Civil, transportation, military helicopters and airplanes.

Everything about aircrafts and helicopters. News and events in aviation worldwide. Civil, transportation, military helicopters and airplanes.


This is the inverse of the transform given in Equations A.27 and A.28. To transform from body axis to earth axis, the transformation matrix TEB is given by
|
T11 |
T12 |
T13 |
||
|
Teb = |
T21 |
T22 |
T23 |
(A. 34) |
|
T31 |
T32 |
T33 |
where
T11 = cos U cos C T12 = sin U sin f cos C — cos f sin C T13 = sin U cos f cos C
+ sin f sin C
T21 = cos U sin C T22 = sin U sin f sin C + cos f cos C T23 = sin U cos f sin C
— sin f cos C
T31 = — sin U T31 = cos U sin f T33 = cos U cos f
(A.35)
The Euler angles C, U, f are the basic angles of the direction cosine matrix T required to transform a vector from earth to body axes. The relation between the Euler angles and angular rates is given by [8]
The matrix T of direction cosines to transform from earth to body axis is given by
|
T11 |
T12 |
T13 |
||
|
T = |
T21 |
T22 |
T23 |
(A.27) |
|
T31 |
T32 |
T33 |
 |
 |
 |
||
where
The singularity encountered as pitch angle U approaches 90° can be avoided with the use of quaternions. The four components of quaternions are expressed in terms of Euler angles and to the body-axis angular rates as follows:
![]() я1 = cos(C/2) cos(U/2) cos(f/2) + sin(C/2) sin(U/2) sin(f/2) я2 = cos(C/2) cos(U/2) sin(f/2) — sin(C/2) sin(U/2) cos(f/2) я3 = sin(C/2)cos(U/2) sin(f/2) + cos(C/2) sin(U/2) cos(f/2) я4 = sin(C/2)cos(U/2)cos(f/2) — cos(C/2) sin(U/2) sin(f/2)
я1 = cos(C/2) cos(U/2) cos(f/2) + sin(C/2) sin(U/2) sin(f/2) я2 = cos(C/2) cos(U/2) sin(f/2) — sin(C/2) sin(U/2) cos(f/2) я3 = sin(C/2)cos(U/2) sin(f/2) + cos(C/2) sin(U/2) cos(f/2) я4 = sin(C/2)cos(U/2)cos(f/2) — cos(C/2) sin(U/2) sin(f/2)
 (A.30)
These four components я1, я2, я3, я4 satisfy the constraint
a2 + a2 + a3 + a4 = 1 (A.31)
The elements of the transformation matrix T, in terms of the four components of quaternions, are given by
T11 = 2(я2 + я2) — 1 T12 = 2(я2Я3 + Я1Я4) T13 = 2(я2Я4 — Я1Я3)
T21 = 2(я2 Я3 — Я1Я4) T22 = 2(я2 + я|) — 1 T23 = 2(я3Я4 + Я1Я2) (A.32)
T31 = 2(я1 Я3 + Я2Я4) T32 = —2(я1Я2 + Я3 Я4) T33 = 2(я2 + я4) — 1
The Euler angles can be obtained from the quaternions as follows:
The sequence of rotation is important for accurate axes transformation. The first rotation is through angle C about the Z-axis, then through U about the Y-axis, and finally through angle f about the X-axis.
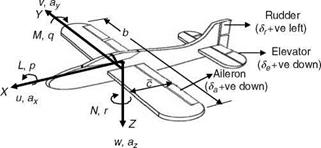
The universally accepted aircraft nomenclature representing the translational and rotational motions, the flow angles, and the aerodynamic forces and moments acting on the aircraft are mentioned here [1,7]. The forward edge of the wing is called the leading edge and the rear edge is called the trailing edge. The line joining the leading edge to trailing edge is called the chord. If b is the wing span and S represents the area of the wing, then the AR of the wing is given by AR — b2/S. A reference point of considerable importance is the aerodynamic center. This is the point about which there is no change in the pitching moment as the AOA is increased.
Figure A7 shows the aircraft primary control surfaces and the normally accepted sign conventions. All surface positions are angular in deflection. The elevator
|
|
|
TABLE A1 Aircraft Axes and Notations Longitudinal X-axis |
Lateral Y-axis |
Vertical Z-axis |
|
|
Velocity components |
u |
v |
w |
|
Angular rates |
Roll rate p |
Pitch rate q |
Yaw rate r |
|
Euler angles |
Roll angle f |
Pitch angle U |
Heading angle C |
|
Accelerations |
Longitudinal acceleration ax |
Lateral acceleration ay |
Vertical acceleration az |
|
Aerodynamic forces |
X |
Y |
Z |
|
Aerodynamic moments |
Rolling moment L |
Pitching moment M |
Yawing moment N |
|
Control deflections |
Elevator 8e |
Aileron da |
Rudder dr |
|
Moment of inertia |
^xx |
Iyy |
deflection causes the aircraft to pitch about the Y-axis, aileron deflection causes the aircraft to roll about the X-axis, and the rudder deflection causes it to yaw about the Z-axis. In addition to these primary control surfaces, canard is another control surface (not shown in Figure A7) found in fighters. Canard is a control surface ahead of the wing and is positioned to produce a positive lift. However, it interferes with the smooth flow over the wing and is therefore not found in every fighter aircraft. Some other control surfaces are the strakes and TEFs. Strakes are small fins placed in the horizontal plane on the aircraft forebody projecting into the airflow. This is a passive device, which increases the vortex breakdown AOA. Flaps found on the trailing edge of the wing are called TEFs. The downward deflection of these flaps causes a significant increase in lift coefficient and lift to drag ratio. The most effective range of downward deflection is from 0°-20°.
The flow angles a, b and the three Euler angles C, U, f describe the aircraft heading angle, pitch altitude, and roll angle and have already been discussed and illustrated in Chapter 3. The notations for the aircraft motion variables body-axis system are put together in Table A1 for better understanding.
Turbulence Models
The movement of the air in the atmosphere creates turbulence. The velocity of air may vary in a random fashion in both space and time. The two popular mathematical model forms that explain the random behavior of turbulence are the Dryden and the von Karman model.
![Подпись: 2s% 1 pV [1 + (Lu V)2] SLv 1 + 3(LvV)2 pV [1 + (LvV)2]2 SWLw 1 + 3(LwV)2 pV [1 + (LwV)2]2](/img/3131/image628.gif) |
||
The power spectral density for the turbulence velocity given by the Dryden model (Example 6.3) is as follows:
where V = v = 2p, V is the spatial frequency, v is the circular or temporal frequency, V is the aircraft speed, l is the wavelength, Lu, Lv, Lw are the scale of the turbulence and su, sv, sw are the turbulence intensities. The subscripts u, v, w represent the turbulence velocity components.
![Подпись: 2sULu 1 p [1 + (1.339 Lu V)2] 5=6 2s2 Lv 1 + 8/3(1.339 LyV)2 p [1 + (LvV)2]11/6 2s2wLw 1 + 8/3(1.339 LwV)2 p [1 + (1.339 Lw V)2]11/6](/img/3131/image631.gif) |
||
von Karman’s spectral representation of turbulence is given by [1]
The spectral representation given by von Karman is widely used to simulate turbulence effects.
Longitudinal Model with Gust
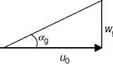
The rigid body airplane equations of motion were discussed in Chapter 3 and the aerodynamic models for force and moment coefficients, in terms of Taylor’s series, were discussed in Chapter 4. Here, we present the longitudinal aerodynamic model assuming one-dimensional gust (only wg, i. e., up and down gust), since wg is mainly responsible for normal accelerations. The upward gust is assumed positive as it produces positive increment in the AOA (Figure A6).
|
|
FIGURE A6 Upward gust.
The AOA and pitch rate due to gust are given by [6]
Wg
°g =— and qg = —° g
U0
The aerodynamic model equations for vertical force and pitching moment coefficient can therefore be expressed as
Cz = Cz°° + °g) + Czq(q – °g) 2^ + Czdpe
c c
Cm — Cm°(° “b °g) “b Cfflq(q °g) “h Cm°° “b ^°g) “h Ст§уе
2U0 2U0 e
Load factor is defined as the ration of lift to weight, i. e.,
n = — (A.23)
W
In straight and level flight, since L = W, the load factor n would be unity. For a turning flight, n > 1. The load factor is also referred to in terms of g’s, e. g., during a turn, if the lift is four times that of the aircraft weight, the aircraft is said to be making a 4g turn. The higher the load factor, the smaller will be the radius of turn. The load factor gradient is defined as: na = WL. This quantity is widely used in HQ
specifications.
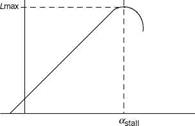
Stall
As the AOA increases, beyond a certain value, the lift suddenly drops and the aircraft is said to have stalled (Figure A4). This is caused by flow separation on the wing surface. The slowest speed at which the aircraft can fly straight and level is called the stalling speed Vstall and is given by
The aim is always to make Vstan as small as possible. This is achieved by increasing C—m„ with the use of high lift devices, e. g., trailing edge flaps (TEFs).
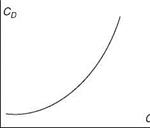
Drag Polars
The C— vs. CD plot is called drag polar (Figure A5). This is typically plotted for specified Mach and altitude and for a given location of centre of gravity. Systematic evaluation of the drag polars of an aircraft using dynamic maneuvers can be carried out over the full AOA range of the aircraft. Reference [5] describes several para – meter/state estimation methods for determination of drag polars from flight data.
Lift
It is easier to understand the concept of aircraft lift with Newton’s laws rather than Bernoulli. The Bernoulli principle/approach is the one that is generally used to describe lift [4]. This explanation focuses on the shape of the wing. It does not satisfactorily explain the inverted flight and ground effect. The description of lift based on Newton’s laws can explain power curve, high-speed stalls, and ground effect. It is conventionally believed and explained that the wing produces the lift due to the fact that air travels faster over the top of the wing, which creates a lower pressure than the bottom of the wing, and this differential pressure produces the upward lift. It is not clear here why the air moves faster on the top. According to Newton’s laws, the wing changes air’s momentum, which generates the force on the wing. Thus, the wing continuously diverts lot of air downwards. Thus, the lift of a wing is directly proportional to the quantity of the air diverted down and the downward speed of the mass of air. This downward velocity is called ‘‘downwash.’’ As the wing moves along, the air is diverted down at the rear and the air is pulled up at the leading edge resulting in ‘‘upwash.’’ This combination of upwash and
downwash, in general, contributes to the overall lift. Thus, as the air is bent around the top, it is pulled from above and this pulling causes the pressure to become lower above the wing. The acceleration of the air above the wing in the downward direction is responsible for giving the wing lift. The air is moving up at the leading edge, and at the trailing edge it is diverted downward, with the top air accelerating towards the trailing edge. The air being fluid, when it is moving and comes into contact with a curved surface it will try to follow that surface. This is known as the Coanda effect. Here, Newton’s two laws are useful: for the air (any fluid) to bend there must be a force acting on it, and the air must put an equal and opposite force on the wing surface that caused it to bend. The air follows a curved path due to its viscosity, which is a property of any fluid—the resistance to flow, a property of stickiness of the fluid. The relative velocity of the air molecules nearest to the surface (with respect to the surface) is zero, and it progressively increases as we move away from the surface. Since the air near the surface has a change in velocity, the air flow is bent towards the surface. The volume of the air around the wing seems attached to the surface and this phenomenon is known as the boundary layer. Effectively the wing is forcing the air down, or pulling the air downward from above. The wing that produces the lift would be at a certain angle of attack (AOA) that determines the lift (Figure A4). The AOA is adjusted to get a certain lift for the speed and the load. The lift begins to decrease at a certain AOA; it could be 12°-15°. The force necessary to bend the air to such a steep angle is much greater than could be supported by the viscosity of the air. This is the cause of the separation of the air from the wing and leads to the stall of the wing, the reduction/loss of the lift.
We have seen that the lift of the wing is proportional to the amount of the air diverted down times the downward velocity of that air. As the aircraft’s speed increases more air is diverted. The AOA is reduced to maintain a constant lift. At higher altitudes the air density is lesser and lesser, and hence the air diverted for the same speed is less. This requires an increase in AOA. The air is left in motion after the aircraft passes ahead, the still air ends up with a downward velocity, and thus the air is infused with energy. The lift thus requires power (being supplied by the engine or by gravity). This power is proportional to the amount of air diverted down times the square of the velocity of the diverted air. We know that the lift of the wing is proportional to the amount of the air downward times the downward velocity of the air. Hence, the power required to lift the aircraft is proportional to the load (weight)
|
|
times the vertical velocity of the air. If the aircraft speed is doubled, the amount of air diverted doubles. The AOA should be decreased to reduce the vertical velocity to half for the same lift. Thus, the power required for the lift has been reduced to half. The power to create lift is, in fact, inversely proportional to the speed of the aircraft.
The amount of air in the downwash also changes along the wing. The downwash comes off the wing in the form of a sheet. The wing at the root diverts more air (than at the tip), the net effect is that the downwash sheet begins to curl outward around itself, producing the wing vortex, tightness of the curling of the vortex being proportional to the rate of change in the lift along the wing. At the wing tip the lift is nearly zero, and the tip vortex is tightest.
Near the ground the upwash is reduced due to the fact that the ground reduces the circulation of air under the wing, requiring reduced downwash of the air (to provide the lift). The AOA is reduced and hence the induced power. This makes the wing more efficient due to the ground effect. Thus, the ground effect, the improved efficiency of the wing, is more correctly explained rather than as the result of the air compressed between the wing and the ground.
Drag
Drag is the force experienced by an aircraft moving forward with TAS V. It is a retarding force that acts parallel to and in the direction opposite to V. Mathematically, it is expressed as
D = CoqS (A.21)
where CD is the drag coefficient (Figure A5), q is the dynamic pressure, and S is the reference wing area. The total drag coefficient at subsonic speeds is given by
CD = CDp + CD;
where CD is the profile drag, which is made up of skin friction drag and the pressure drag due to separation. CD is the induced drag coefficient, which varies as the square of lift coefficient and is given by
C2
 |
CDi=pAe
where A denotes the wing aspect ratio (AR) and e is the span efficiency factor, which generally varies from 0.8 to 0.95. The drag coefficient is also expressed in the form
c2
Cd = CDa + — (A. 22)
pAe
where CD is the zero lift drag coefficient. In addition to these drag components, another component is the wave drag, which occurs at supersonic flows and is the result of the pressure increase across the shock wave. Wave drag can be minimized by keeping the supersonic airfoils thin with sharp leading edges.
The Mach number is a very important similarity parameter, which comes out of the fluid dynamic equations of motion and captures the compressibility effect. It is defined by the following relation:
![]() TAS _ TAS
TAS _ TAS
a pgRT
An expression for Mach number can also be obtained in terms of PT and Ps, by integrating Bernoulli’s equation [2].
Equation A.19 can be used to compute Mach at subsonic speeds, i. e., for M < 1. The aircraft is said to be flying at supersonic speeds when M > 1.
Reynold’s Number
Reynold’s number is the ratio of inertia force to the viscous force and is defined as
mass x acceration
The ratio of inertia force to viscous force =—————————-
mVd
density x d3 x velocity/time density x d2 x V2
=——————————————- =————————– and hence, we have
mVd mVd
Re = pVd (A. 20)
m
where d is the characteristic length (usually the mean aerodynamic chord), V is the TAS, and m is the coefficient of viscosity. If during a wind-tunnel (WT) test on an aircraft model, the Reynolds and Mach numbers are the same as the full-scale flight vehicle, then the flow about the model and the full-scale vehicle will be identical.
Viscosity
The frictional force in a flowing fluid is termed as viscosity of the fluid. Higher the friction, higher is the viscosity. In that sense, liquids are more viscous than gases. Mathematically, if t represents the frictional force per unit area (also called shear stress) and du/dy represents the velocity gradient, then the coefficient of viscosity can be obtained from the relation:
The viscosity of gases increases with an increase in temperature as per the relation (Rayleigh’s formula):
m / t3/4
The ratio of absolute viscosity m to density p is called the kinematic viscosity v, i. e.,
P
The continuity equation relates density, velocity, and area at one section of the flow to the same quantities at another section. In Figure A2, the flow is shown to be bounded by two streamlines. The mass flow rates at section 1 and 2 are given by [3]
m 1 = pjAr V and m2 = P2.A2V2
Since mass can neither be created nor destroyed,
m 1 = m 2 or p1A1V = p2A2V2
This is the continuity equation for steady flow.
 |
Another popular equation that relates pressure and velocity at one point in the flow to another point is the Bernoulli’s equation. It essentially follows from the Newton’s second law, which states that
I
![]()
![]()
![]()
![]()
 FIGURE A3 Forces on a fluid element for developing Bernoulli’s equation.
Force = mass x acceleration
In Figure A3, if P is the pressure on top of the fluid element (shown by a cuboid), the net force is given by
F = P dx dy — P + — dz dx dy
or
F = — (dx dy dz) dz
Since mass is density multiplied by volume
m = p(dx dy dz)
Also, along the z-axis, acceleration is given by the rate of change of velocity
dV _ dV dz _ dV dt dz dt dz
From Newton’s second law
F = ma
Substituting for F and a from the above, we have
dP dV
F = — (dx dy dz) = p(dx dy dz) V
dz dz
or
This equation is called the momentum equation for steady, inviscid flow. Considering point 1 with quantities p and V and point 2 with P2 and V2 in a flow, the momentum equation can be integrated to yield
1 2 1 2
P1 + 2 pv = P2 + 2 pv| (A-16)
This is called the Beroulli’s equation for inviscid incompressible flows with gravity terms neglected. As speed increases, compressibility effects need to be accounted for and density can no longer be assumed constant. Bernoulli’s equation for compressible flows with gravity terms included is given by [1]
g P 1 2
———— V – V2 + gz = constant (A. 17)
g – 1 P 2
where g is the acceleration due to gravity.
First, it is essential to mention the speed of sound, which is given by
a = л/yRT (A. 10)
where g is the ratio of specific heat (with constant pressure to constant volume) and taken as 1.4, R is the gas constant with a value of 287 J/Kg K. For sea-level conditions, where temperature T is 288 K, the speed of sound is computed to be nearly 340 m/s.
It has already been mentioned that the pitot-static tube can be used to measure the airspeed. The (PT — Ps) measured by the pitot-static tube is passed on to an indicator, which is calibrated to standard sea-level conditions. The airspeed read from this instrument is called the indicated airspeed (IAS). IAS will be affected by instrument and position errors. Instrument errors could arise from mechanical inaccuracies while position errors are caused by the location of the pitot-static tube in the flow field, which is distorted because of the interference from fuselage or wing. Correction for these errors in IAS will yield what is known as calibrated airspeed (CAS). Modern aircraft have airspeed indicators that directly read CAS [1,2].
True airspeed (TAS) is the actual airspeed of the aircraft relative to the air. The relationship between TAS and ground speed is given by
TAS = Vg + Vw
where Vg is the speed with respect to the ground and Vw is the wind speed.
Equivalent airspeed (EAS) is defined as the speed at standard sea-level conditions, which produces the same dynamic pressure as the TAS, i. e.,
2 P0CEAS)2 = 2 p(TAS)2 or
EAS p
TAS =—where s = — (A.11)
Vs P0
Thus, TAS results when EAS is corrected for density altitude. When TAS is known, Mach number can be computed using the relation
M = = JgRr where a is the speed of sound (340 m/s at sea level).
In terms of total pressure PT and static pressure P at a given flight altitude, TAS and EAS for subsonic flight (M < 0.3) can be obtained using the relation:
![]() 2(PT — P)
2(PT — P)
V P0
where po is the air density at sea level. Interestingly, Mach number can be viewed as the ratio of inertia force to elastic force.
For high subsonic flight (M > 0.3), TAS and CAS are given by
![]()
(A. 13)
where a is the speed of sound at given altitude, a0 is the speed of sound at sea-level conditions, and P0 is the static pressure at sea level (taken as 1.01325 x 10⁵ N/m2). In other words, the relationship between TAS and CAS can also be expressed as
Aircraft/speeds are classified as subsonic M < 1; transonic 0.8 < M < 1.2; supersonic 1 < M < 5; and hypersonic M > 5.
An atmospheric vehicle moves in the ‘‘flow field of air,’’ the atmosphere being highly dynamic. There are temperature and pressure gradients. Air pressure, temperature, and atmospheric gust and turbulence are important considerations in the study of atmospheric flight vehicles—so aptly named! In any flight mechanics study and analysis three aspects are very important: aircraft performance, stability and control, and dynamic trajectory analysis.
In the main text we have concentrated on dynamic analysis via system theoretic approach and some related highlights on stability and control. In this appendix some important useful concepts and definitions are collated.
A1 AERODYNAMIC CONCEPTS AND RELATIONSHIPS
Air Pressure
Pressure is defined as force acting on a unit area. The pressure on aircraft is usually measured by using a pitot-static system of the kind shown in Figure A1; it measures the total and static air pressure. The pressure tube is a concentric with a center tube measuring the total pressure and the outer tube measuring the static pressure. As the aircraft moves forward, the airflow comes to rest at the mouth of the pitot tube. This is known as the stagnation point and the pressure at this point is given by
Pt = Ps + 2 pV2 (A.1)
Here, Pt is the total pressure which, for flight test aircraft, is often measured at the nose boom. Ps is the static pressure upstream away from the body and V is the free stream velocity. The value of pressure 1 pV2 is termed as the dynamic pressure and is generally denoted by q. Note that dynamic pressure depends on both the density as well as the square of the velocity. Equation A.1 holds good only for low-speed flights where the compressibility effects can be ignored.
Note that both dynamic and static pressure act on the inner tube while only static pressure acts on the outer tube. The difference between the two is the dynamic pressure, which is used to determine the velocity V of the aircraft. At high speeds (M > 0.3), the pitot measurements must be corrected for compressibility effects. The corrected dynamic pressure qc can be written as [1]
Airflow oooo______
![]() * Чі-
* Чі-
Holes for static
pressure measurement
FIGURE A1 Pitot-static tube.
It is also worth mentioning here that static pressure is subject to errors called position errors. It is a known fact that for any given static source location, the position error varies with change in speed and altitude. The normal atmospheric pressure at sea level is 101 kN/m2. It is often expressed in terms of bars: 1 bar = 100 kN/m2. Thus, one millibar = 100 N/m2 = Pa (Pascal).
Air Density
Density is defined as the mass per unit volume:
p = mass/volume
The relation between pressure, density, and temperature is given by the equation
P = pRT (A.3)
where R is the gas constant and its value is 287 J/Kg K.
Another factor related to density, which occurs in many formulae, is the ratio of the air density p to the sea-level density p0 (its value at sea level is 1.225 kg/m3), i. e.,
s = — (A.4)
P0
The related quantity, the specific weight, is defined as weight/volume = m x g/volume. Air Temperature
The temperature of the atmosphere varies with altitude and can be represented by a linear relation
![]() T = T1 + Ih
T = T1 + Ih
where l is the lapse rate, which indicates the rate of change in temperature with altitude. In an aircraft, a temperature probe is used to measure the total temperature of the air. Assuming adiabatic conditions (no loss of heat), the total temperature Tt in terms of ambient temperature T is given by
Altitudes
In aeronautics, we talk about several types of altitude, the primary among them being the absolute, geometric, and geo-potential altitude. Geometric altitude is the altitude/height from mean sea level. It does not vary with temperature or with the change in gravity. The absolute altitude is measured from the center of the earth. If Ha denotes the absolute altitude, HGM denotes the geometric altitude, and Re is the radius of earth, then
Ha = Hgm + Re (A.7)
If g represents the acceleration due to gravity and g0 is the gravity at sea level, then the geometric altitude can be computed from the relation [1,2]:
![]()
![]()
![]()
![]() g_ g0
g_ g0
The geo-potential altitude HGP is in fact a fictitious altitude defined based on the reference gravity at sea level (g0 = 9.8 m/s2). The relation between geometric and geo-potential altitude is given by
The difference between HGM and HGP is small for lower altitudes, but it grows as the altitude increases. Other altitudes that we frequently come across in the literature are pressure altitude, density altitude, and temperature altitude. We know that static pressure varies with altitude. A sensor called altimeter, calibrated using the standard atmosphere, measures the static pressure and relates it to altitude. The altitude indicated by the altimeter is therefore the pressure altitude. The density and the temperature altitudes, likewise, are altitudes in the standard atmosphere corresponding to the measured density and temperature. The density altitude is often used for piston engine aircraft since their power is generally proportional to air density.
Some call geometric altitude the system altitude. Some define an absolute altitude as the height above the surface of the earth at any given surface location. If the aircraft is above the mountain, then the absolute altitude is the vertical clearance between the aircraft and the surface of the mountain. Also, true altitude is defined as the height above the sea level. The pressure altitude is defined as the height from the reference where the pressure is 29.921 in. (760 mm) of mercury (Hg). Other related definitions are the Geoid height is the height of the actual surface of the Earth from the surface of the ideal spheroid of the Earth, elevation is the height from the actual surface, and geodetic height is height from the spheroid.