Category Flight Vehicle Aerodynamics

Axisymmetric Boundary Layers

Axisymmetric Boundary Layers Axisymmetric Boundary Layers

Boundary layer analysis readily applies to axisymmetric flows, such as the one shown in Figure 4.15. Ex­tending the 2D profile drag analysis in Appendix C to the 3D case, or following the analysis in Section 5.6, we obtain the 3D profile drag in terms of the far-downstream momentum area 0W.

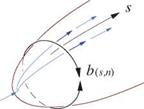
For the axisymmetric 3D boundary layer and wake case, the integral (4.60) is best put into axisymmetric form using the local width parameter

as shown in Figure 4.16. The body shape is given by the local radius function R(s), with R = 0 in the wake. The second approximate form above makes the assumption that dR/ds ^ 1, which is reasonable for slender bodies, although the exact form can be used with little complication.
Axisymmetric Boundary Layers

Top View

Axisymmetric Boundary Layers


Unwrapped flow

Axisymmetric Boundary Layers


Figure 4.16: Transverse area element b dn inside boundary layer with lateral divergence, which is quantified by lateral width parameter b(s, n).

The transverse area element now becomes dS = b dn, so that at any body location the momentum area, and also the displacement and kinetic energy areas, can now be defined using the usual transverse coordinate n.

A*(s)

0(s)

0*(s)

■ne


pu ) b dn

(4.62)

peue )

u pU b dn

(4.63)

Ue ) PeUe

І) pU b dn

(4.64)

Ue/ peue


1


0


Axisymmetric Boundary Layers

Axisymmetric Boundary Layers

The integral equations which govern these integral areas have nearly the same form as in 2D,

d0

– c±b –

– 2

(H + 2 –

Me2 )

0 dUe

(4.65)

ds

ue ds

d0*

= 2cd bavg

/2 H**

+ 3

– Me2

0* due

(4.66)

ds

V H*

Ue ds

except for the lateral width friction factor bw = b(n=0) = 2nR, and the bavg dissipation factor which is a local dissipation-weighted average over the boundary layer thickness. The shape parameters have the same definitions as in 2D. For example, H = A*/0, etc.

A significant simplification results if we replace n in the b(s, n) definition (4.61) with a representative height in the shear layer, the rational choice being the usual 2D displacement thickness (see Figure 4.4).

b{s) ~ 2-7Г (^R + 6*/1 — (dE/ds)2j ~ 2tt(R + 5*) (4.67)

This approximate b(s) can now be taken outside of the integral area definition integrals (4.62)-(4.64), making them simply related to the usual 2D thicknesses.

Подпись: (4.68)A* = 5*b, 0 = 9 b, 0* = 9*b

The assumptions


b

— bavg


bw


—b


can also be made if we assume 5* ^ R on the body, and bavg — 5* in the wake.

Substitution of 0 = 6 b etc. into (4.65) and (4.66) gives essentially the 2D integral equations,

(4.70)

(4.71)

except for the appearance of the lateral divergence terms involving db/ds. The streamwise changes in the thicknesses 6,6* resulting from these terms can be seen to be the result of a given amount of boundary layer fluid being spread over a varying perimeter b(s). However, the perimeter changes do not affect the overall amount of viscous fluid at any streamwise location, and hence cannot directly affect the overall momentum and kinetic energy areas 0, 0*. This can also be seen by the absence of explicit db/ds terms in equations (4.65), (4.66). An important consequence is that the predicted far-downstream 0TO and hence the drag will be insensitive to the details of the b(s) approximation (4.67) used here.

2 H* ~H~*

6* due ue ds

Axisymmetric Boundary Layers

Axisymmetric Boundary Layers

Figure 4.17: Momentum area 0(s) evolution along axisymmetric body and wake. Over the rear of the body, the momentum thickness 6(s) increases faster than in 2D, due to the viscous fluid flowing onto a progressively smaller perimeter.


Axisymmetric Boundary Layers

Self-Similar Turbulent Boundary Layers

Подпись: n(s,n) Подпись: n S(s) Подпись: + AU(s,n) U(s,n) — Ue(s) At/, (5,77) = = U-j- (s) UT (s) Подпись: (4.54)

For the laminar case we saw that the n, u ^ n, U variable rescaling (4.51) led to a self-similar boundary layer flow for a power-law edge velocity. A suitable corresponding rescaling for the outer layer of a turbulent boundary layer is

where the normalizing velocity is now the shear velocity ut, defined in terms of the wall shear stress.

UT = у-y = Ue sjc. f/2 (4.55)

Note also that this transformation addresses the defect velocity AU = U—Ue, rather than U itself.

f (at/+)2 d??. _ 1

/ — A u+ d n sj Cf /2

6* dp Нв dt/,e

tw ds Cf /2 Ue ds

Подпись: G в Self-Similar Turbulent Boundary Layers Подпись: (4.56) (4.57)

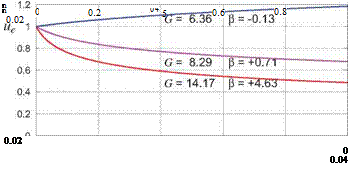
Turbulent self-similar boundary layers, also known as equilibrium flows, are theoretically possible when plotted in terms of the n, AU+ variables, and were first demonstrated experimentally by Clauser[14]. They are characterized by streamwise-constant values of the Clauser parameters G and в.

An empirical relation between G and в for equilibrium flows is known as the G-beta locus.

G(в) – A (1 + Вв)1/2 , A -6.7 , B ~ 0.75 (4.58)

This can be considered to be the turbulent-flow equivalent of the H(A) laminar self-similar flow relation implied by Table 4.1. The form of (4.58) is based on theoretical physical models of the turbulent boundary layer (see Coles [15]), and the values of its two constants A, B are obtained from measurements of equilib­rium boundary layers from Clauser [14], Simpson et al [16], and others. Figure 4.14 shows three turbulent equilibrium flows for three values of в.

Note that в > 0 is an adverse pressure gradient which results in a rapid thickening of the boundary layer, while в< 0 is a favorable pressure gradient with much slower growth. All the velocity profiles for each flow all collapse to the same AU+(n) curve for that flow. This is directly analogous to the self-similar laminar wedge flows sketched in Figures 4.11 and 4.13, whose profiles all collapse to the normalized profiles shown in Figure 4.12. The good fit to the experimental data validates the turbulent equilibrium flow concept.

The special case of a very large G corresponds to a turbulent incipient-separation boundary layer flow, analogous to the laminar H = 4.0 Falkner-Skan flow. Flows of this type have been used by Liebeck [17] to design airfoils with the fastest-possible pressure recovery without separation, which results in extraordinarily high maximum lift. A distinctive feature of Liebeck’s airfoils is a “concave” Ue(s) distribution on the upper surface, comparable to the G = 14.17 case shown in Figure 4.14.

Self-Similar Turbulent Boundary Layers Self-Similar Turbulent Boundary Layers
Подпись: 5

Figure 4.14: Three turbulent self-similar (equilibrium) flows, each with a constant Clauser pressure gradient parameter в, and corresponding constant G given by the G-beta locus (4.58). Each flow has an initial momentum-thickness Reynolds number ue6/v = 1500 at s = 0. All the velocity profiles of each flow collapse to a single normalized defect profile on the right plot. Experimental data (symbols) is from Simpson et al [16].

Wedge flows

Wedge flows Подпись: s Wedge flows
Wedge flows

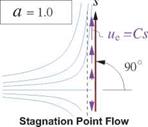
The Falkner-Skan solutions are strictly valid only for flows with the power-law edge velocity distribution. It is fortuitous that such potential flows do indeed occur over simple geometries, the so-called wedge flows. Three particular wedge flows are shown in Figure 4.13, and their boundary layer solution parameters are also listed in Table 4.1. The case of a = 1, called stagnation point flow, occurs in practically every aerodynamic flow which has a body with a blunt leading edge, such as a common airfoil. For this flow we have 6FS = ■Jv/C, so that the boundary layer thickness near a stagnation point is locally constant.

Figure 4.13: Three particular wedge flows. Displacement effect not shown.

The case a = 0, corresponding to a constant pressure and edge velocity, is commonly called flat plate flow or Blasius flow. For this case we have <SPS = fvsjC, so that the boundary layer thickness grows as л/s. A Blasius boundary layer is commonly used as a first approximation to laminar boundary layer flows which have nearly-constant pressure or edge velocity over most of their extent.

The last case a = -0.0904 shown in Figure 4.13 is called incipient separation flow, which has zero skin friction everywhere. This wedge flow is mainly a mathematical curiosity, since the top and bottom flows occupy the same space above the plate which is physically impossible. A more plausible example is a thin airfoil whose camber shape is such that it has the ue(s) ~ s-0 0904 edge velocity distribution on one side. However, since the incipient-separation boundary layer is theoretically infinitely sensitive to any ue(s)
perturbations and hence to geometric irregularities, such an airfoil flow would still be virtually impossible to realize in practice. Incipient separation flow is also very susceptible to transition to turbulent flow, as will be discussed in Section 4.14, and therefore can exist only at relatively low Reynolds numbers. In this case it will have large viscous displacement effects, which will further complicate the realization of such a flow.

Besides providing physical insight and quantitative results for the special case of wedge power-law flows, the Falkner Skan solutions are also very useful for “calibrating” approximate integral solution methods for general boundary layer flows. These will be treated in Section 4.11.

Self-Similar Laminar Boundary Layers

Подпись: n V(s’n) = 7— d(s) Подпись: U (s,n) Подпись: u(s,n) ue(s) Подпись: (4.51)

Most finite-difference methods for solving the boundary layer equations (4.21), to be summarized in Sec­tion 4.10.2, actually solve transformed versions of these equations. One example is the following transfor­mation n, u ^ p, U using the local normal-length and streamwise-velocity scales 5(s) and ue(s).

The local length scale 5(s) can be chosen arbitrarily. However, it is advantageous to define it such that it is roughly proportional to the physical thickness of the boundary layer, so that the s-p computational grid grows along with the layer, as shown in Figure 4.11 on the left. This makes the U(s, n) velocity profiles stay within the s-p grid, which considerably simplifies the finite-difference solution procedure when it is applied on this grid, instead of on the physical s-n grid.

Self-Similar Laminar Boundary Layers

One practical complication of the length scale choice 5 = ne shown in Figure 4.11 is that the boundary layer’s edge location is somewhat subjective, since u approaches ue only asymptotically. Alternative choices for 5 are 5[2], в, etc., which have the advantage of being unambiguously defined.

Another feature of the transformation (4.51) is that it fundamentally simplifies the problem for a special class of incompressible laminar boundary layer flows where ue(s) has a power-law form,

Подпись: (4.52)Подпись: ue(s)= Csa

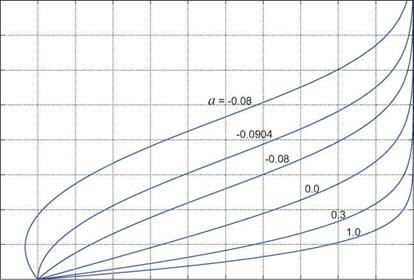
we have the Falkner-Skan Transformation [12], [11]. The resulting transformed boundary layer equations no longer have any dependence on s, so their solution has the form U = U(n;a). This is called a self-similar boundary layer flow, in that all the velocity profiles are “similar,” or more precisely they have the same normalized U(n) at each streamwise location s. The situation is pictured in Figure 4.11 on the right. The U(n) shape does depend on the power-law exponent, however, so we get a different flow for each value of a.

The Falkner-Skan solution velocity profiles are shown in Figure 4.12 for several values of a. Their numerical parameter values of interest are listed in Table 4.1. Note that because 5FS is significantly smaller than the boundary layer thickness ne, the n values are considerably greater than unity.

Self-Similar Laminar Boundary Layers

Подпись: ue(s) Self-Similar Laminar Boundary Layers

8 7 6 5

n = n I Sfs 4

3

2

1

0

0 0.1 0.2 0.3 0.4 0.5 0.6 0.7 0.8 0.9 1

U = u I ue

Figure 4.12: Falkner-Skan velocity profiles, for several values of ue ~ sa power-law exponent a.

Each U(n) profile describes the entire self-similar velocity field u(s, n;a), via (4.51), (4.52), (4.53).

Numerical parameter values of interest for these profiles are listed in Table 4.1.

Although these solutions apply only to self-similar (power-law) laminar boundary layer flows, they reveal a number of important characteristics which apply to more general laminar boundary layer flows. They also confirm the general effects of pressure gradients which were qualitatively examined in Section 4.4. •

• The small minimum achievable negative value of amin = -0.0904 indicates that laminar flows cannot tolerate significant adverse pressure gradients, or equivalently, significant decreases in ue(s). For example, over a doubled laminar run distance, s2/s1 = 2, the minimum tolerable velocity decrease is ue2/uei = (s2/si)“min = 0.939 which is only a 6.1% deceleration.

a

8*

8fs

в

8vs

H

H*

ft*3 f

Rflxcv

A

r

Fe

2.00000

0.47648

0.21775

2.18820

1.63101

1.71507

0.97666

0.09483

0.37345

-0.04742

1.00000

0.64790

0.29235

2.21622

1.62575

1.23259

0.71291

0.08547

0.36034

0.00000

0.60000

0.79760

0.35483

2.24783

1.62006

0.97532

0.57484

0.07554

0.34608

0.05036

0.30000

1.01961

0.44196

2.30702

1.61009

0.72574

0.44474

0.05860

0.32075

0.13672

0.10000

1.34787

0.55660

2.42161

1.59308

0.49657

0.33251

0.03098

0.27639

0.27882

0.00000

1.72080

0.66412

2.59109

1.57259

0.33206

0.26109

0.00000

0.22053

0.44105

-0.05000

2.11777

0.75148

2.81815

1.55196

0.21348

0.21867

-0.02824

0.16043

0.59294

-0.08000

2.67173

0.82973

3.22000

1.52916

0.10155

0.19031

-0.05508

0.08426

0.74351

-0.09043

3.49786

0.86814

4.02916

1.51509

0.00000

0.18014

-0.06815

0.00022

0.82179

-0.08700

4.14726

0.84989

4.87975

1.52470

-0.04678

0.18303

-0.06284

-0.03976

0.78515

-0.08000

4.75540

0.80734

5.89021

1.55216

-0.07361

0.18800

-0.05214

-0.05943

0.70399

Table 4.1: Falkner-Skan solution parameters for self-similar boundary flows with ue(s) = Csa. The local Reynolds number is Rex = ue(s) s/v. Parameters A, T, Fe will be defined in Section 4.11.1.

. Integral defect / profile drag relations

Подпись: D' = P^ = J rwds + j-‘m "“^r airfoil airfoil+wake Подпись: (4.40)

As derived in Appendix C, the airfoil’s profile drag is equal to the far-downstream wake momentum defect PTO. Noting that PTE in (4.37) is the sum of the upper and lower surfaces’ P(s) given by (4.36) at the trailing edge, we then have the following result from (4.37). The D’ limit is indicated in the bottom of Figure 4.10.

Подпись: D' . Integral defect / profile drag relations

It is useful to compare the two terms in (4.40) with the friction+pressure drag components, both of which will be further addressed in Chapter 5. Choosing the x-axis to be parallel to V we have

Dfriction — Tw ■ x ds, Dpressure — pw n ■ x ds (4.41)

airfoil airfoil

where n is the airfoil-surface outward unit normal, and Tw is the surface viscous stress vector. Evidently, the first integral in (4.40) can be interpreted as the friction drag, while the second integral must then be the

remaining pressure drag part.

^friction – Tw ds (4.42)

airfoil

^pressure = D’- fiction ~ j~m^dS = I 6*fsdS (4-43)

airfoil+wake airfoil+wake

The friction drag estimate (4.42) is only approximate because the viscous surface force vector Tw is very nearly parallel to the surface, while an exact match with the friction drag definition (4.41) would require Tw to be parallel to the freestream VA along x. However, the angle between Tw and VA is small over most of the surface, especially for thin airfoils, so the friction and pressure drag component estimates (4.42) and (4.43) are still useful conceptually. In particular, the integrals in (4.43) indicate that most of the pressure drag is produced where there is an adverse pressure gradient in the presence of a large mass defect m or displacement thickness 5*. This combination typically occurs over the rear portion of the airfoil at high lift, and can be clearly seen in the top of Figure 4.10 for s > 0.6c.

To relate the kinetic energy defect result (4.38) and (4.39) to profile drag, we first write P and K in terms of the velocity defect Au.

A u =

u — ue

(4.44)

P=

У (ue — u) pu dn =

(—Au pu dn

(4.45)

K=

{u%.— u2) pu d? t =

—Au, (tte + jAw) pu d??.

(4.46)

If Au is very small compared to ue, then K and P become simply related to a good approximation.

K — J-Auu, e pu dn = Pue (if Au ^ ue) (4.47)

This occurs in the far-downstream wake where Au goes to zero as the wake spreads and mixes out. And in the far wake ue also approaches VA, so that the two defects become exactly related far downstream.

Подпись: PA kA(4.48)

Подпись: D' kA = KA = Подпись: D ds airfoil+wake Подпись: (4.49)

Combining this with (4.40) then gives an alternative expression for the overall profile drag in terms of the far-downstream wake kinetic energy defect, and also the dissipation everywhere.

This rather simple result has a power balance interpretation: The drag D’ must be balanced by an external thrust force which moves at speed VA relative to the airmass, and thus exerts a power of D’VA which is all dissipated in the viscous layers. The conclusion is that profile drag is uniquely related to viscous stresses as quantified by the distribution of the dissipation integral D(s), and this dissipation contributes positively to the drag everywhere since D> 0 always. This strictly-positive dependence of drag on viscous forces isn’t immediately obvious from the alternative momentum-based profile drag expression (4.40). Its second pressure term always has some locally negative contributions to the total drag, and its first friction term also has locally negative contributions in separated regions which exhibit reversed flow and hence Tw < 0.

Invoking the friction and pressure drag definitions (4.41), the power-balance relation (4.49) gives an alter­native relation for the friction plus pressure drag.

-^friction + -^pressure = ТГ I V (4.50)

^ airfoil+wake

Since the D and Dfriction terms both depend only on the viscous stresses т(s, n) via their definitions (4.34) and (4.41), the remaining pressure drag ressure term then also depends only on the viscous stresses. In this power balance view, we can then conclude that the pressure field is not the cause of pressure drag, but rather it’s a necessary additional power-transmission mechanism (the surface friction forces alone are insufficient) from the body surface to the flow-field interior where the viscous power dissipation takes place. This has implications for aerodynamic design as will be discussed in Section 4.11.4.

Integral defect evolution

Integral defect evolution Integral defect evolution Подпись: (on airfoil surface) (in wake) Подпись: (4.36) (4.37)

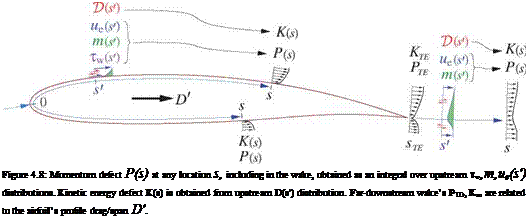
To gain insight into how the integral defects evolve along a boundary layer, and how they relate to 2D profile drag, we integrate the dimensional von Karman equation (4.26) on each airfoil side and in the wake. On the airfoil surfaces the integration runs from the stagnation point s = 0 to some surface location s, while in the wake it runs from the trailing edge sTE to some wake location s, as sketched in Figure 4.8.

Since the stagnation point momentum defect P(0) is zero, it was dropped from (4.36). And since the wall shear is zero in the wake, the Tw term was dropped from (4.37). The initial wake defect PTE in (4.37) is the sum of the upper and lower surface defects at the trailing edge.

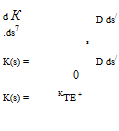
Подпись: s Подпись: d К .ds7 D ds/ s K(s) = D ds/ 0 K(s) = KTE + Integral defect evolution Подпись: (on airfoil surface) (in wake) Подпись: (4.38) (4.39)

The same integration can be applied to the dimensional kinetic energy equation (4.31).

Подпись: Figure 4.8: Momentum defect P(s) at any location s, including in the wake, obtained as an integral over upstream TW,m,ue(s') distributions. Kinetic energy defect K(s) is obtained from upstream D(s') distribution. Far-downstream wake’s PTO, Кто are related to the airfoil’s profile drag/span D'.
Integral defect evolution

The 5** term in (4.31) has been neglected since it vanishes in incompressible flow, and is usually small in any case. For adiabatic compressible flows Sato [13] has incorporated the 5** term into a modified dissipation integral D, so the forms of the integrated K(s) expressions (4.38) and (4.39) are generally valid.

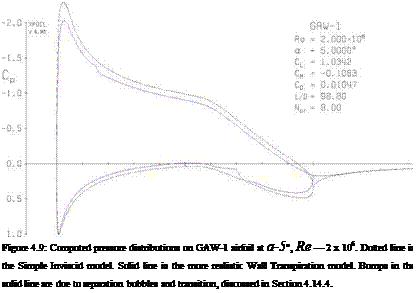
We now examine the P(s) and К(s) distributions on the GAW-1 airfoil. Figure 4.9 shows its Cp distributions at а = 5°. Figure 4.10 shows the tw(s) and D(s) distributions on the upper surface and wake, and also the corresponding defects P(s) and К(s). Also shown is the friction-only defect Pfriction(s), which then also indicates the remaining pressure defect Ppressure(s) as the difference from the total P(s).

Подпись: Pfriction(s) TW ds 0 fs due

PpressureO = j d<§ = P – Pfl’iction

Подпись: Figure 4.9: Computed pressure distributions on GAW-1 airfoil at а-5°, Re — 2 x 10⁶. Dotted line is the Simple Inviscid model. Solid line is the more realistic Wall Transpiration model. Bumps in the solid line are due to separation bubbles and transition, discussed in Section 4.14.4.

We see that tw dominates the P(s) development over the front of the airfoil, but — m due/ds dominates over the back of the airfoil. In the wake, the latter term decreases P(s) due to the wake’s favorable pressure gradient, or due/ds> 0. In contrast, К(s) is strictly monotonic since its only source term D(s) is everywhere positive, including in the wake. In particular, the evolution of К(s) does not depend on the pressure gradient, except indirectly via the pressure gradient’s relatively weak influence on D.

Integral Boundary Layer Relations

4.5.1 Integral momentum equation

Integral Boundary Layer Relations Integral Boundary Layer Relations Подпись: дт dn Подпись: (4.25)

The integral momentum analysis begins by combining the continuity and s-momentum equations as follows.

^ і x*dP tw To

ds

Integral Boundary Layer Relations Подпись: * due rw - peued —— ds Integral Boundary Layer Relations

Integrating JQne[ equation (4.25)] dn term by term then gives the dimensional form of the von Karman integral momentum equation,

where we see the reappearance of the mass defect m = peue5* and momentum defect P = peu)0 which previously appeared in Section 4.2.2 in the mass and momentum flow comparisons between viscous and inviscid flows.

Integral Boundary Layer Relations Подпись: (4.28)

Dividing equation (4.26) by peu2 produces the exactly equivalent dimensionless form,

Подпись: 5* H = в cf = Tw 1 „ _ ‘ 2 РеЩ Me = Ue ae Подпись:Подпись:where the following new dimensionless parameters have been defined.

shape parameter skin friction coefficient

edge Mach number

The edge Mach number appears in (4.28) via the isentropic relation (1.78) between density and velocity differentials, which is valid for the edge quantities since these are in the inviscid flow.

dpe

Pe

The dimensional von Karman equation (4.26) is seen to govern the evolution of the momentum defect P, while the dimensionless form (4.28) governs the evolution of the related momentum thickness 0. The solution of (4.28) to determine 0(s) will be addressed in later sections.

4.5.2 Integral kinetic energy equation

Integral Boundary Layer Relations Подпись: 0

Подпись:

Integral Boundary Layer Relations Integral Boundary Layer Relations Integral Boundary Layer Relations Подпись: (4.30)

An equation for the kinetic energy is obtained by multiplying the momentum equation by the velocity u. The mass equation is also incorporated to put the result into divergence form as follows.

— = V + ue6**

ds e ds

where the kinetic energy defect К = 0* appealed previously in Section 4.2.2 in the kinetic energy

flow comparisons between viscous and inviscid flows. New quantities which appear here are

Integral Boundary Layer Relations Integral Boundary Layer Relations

Integrating J0”e [ equation

the density flux thickness which measures the work done (positive or negative) by the pressure gradient in conjunction with density variations across the boundary layer, and D is the dissipation integral which measures the local rate of flow kinetic energy dissipation into heat by the shear stress т acting on the fluid which is deforming at the shear strain rate du/dn. Note that 5** = 0 in incompressible flow where p/pe = 1, while D is always present and is virtually always positive (pt < 0 is very unlikely).

dfl*

ds

2 H **
II*

9* due ue ds

Подпись: 2 CD Подпись: + 3 - Me2 Подпись: (4.35)

Dividing equation (4.31) by ^peuI produces its exactly equivalent dimensionless form,

where the following new dimensionless parameters have been defined.

H * =

9*

~9

kinetic energy shape parameter

H**

5**

~f

density flux shape parameter

CD =

V

Petl’e

dissipation coefficient

The dimensional kinetic energy equation (4.31) is seen to govern the evolution of the kinetic energy defect K, while the dimensionless form (4.35) governs the evolution of the related kinetic energy thickness 9*. The dimensionless kinetic energy equation (4.35) is used in some advanced integral calculation methods. See Rosenhead [11], Schlichting [12], and Drela et al. [6] for examples.

Boundary Layer Response to Pressure and Shear Gradients

Подпись: du pUlLs Подпись: due peUe-7— ds Подпись: дт dn

If we temporarily redefine s, n to be parallel and normal to some particular streamline, then locally v = 0 in these coordinates, and the s-momentum equation becomes

which provides an estimate of the change in a fluid element’s velocity Au over some small distance As.

du peue 1 дт

All, ~ — as = ————————- Aue + —— as (4.24)

ds pu pu dn

Boundary Layer Response to Pressure and Shear Gradients Boundary Layer Response to Pressure and Shear Gradients

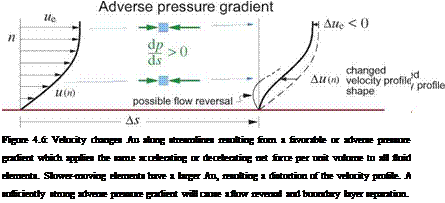
The first term on the right in (4.24) represents the effect of a streamwise pressure gradient dp/ds. Of particular importance is the factor peue/pu which “magnifies" any edge velocity change Aue into a larger change Au inside the boundary layer, as shown in Figure 4.6.

When dp/ds < 0 we have a favorable pressure gradient. This corresponds to due/ds > 0, so this is also called an accelerating boundary layer. As pictured at the top of Figure 4.6, the pressure gradient applies the same accelerating force per unit volume to all the fluid elements in the boundary layer, but the slower element responds more strongly due to its larger peue/pu factor in (4.24).

When dp/ds > 0 we have an adverse pressure gradient. This corresponds to due/ds < 0, so this is also called a decelerating boundary layer, pictured at the bottom of Figure 4.6. In this case we have the possibility of flow reversal near the wall, which results in flow separation where the bulk of the shear layer lifts off the wall as shown in Figure 4.4 on the right. This also results in rapid increases in the mass defect, and thus produces strong viscous displacement effects on the outer potential flow.

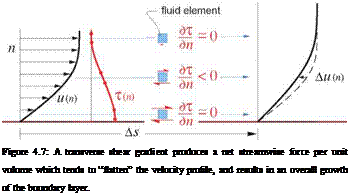
Unlike the streamwise pressure gradient which is uniform across the boundary layer thickness, the transverse shear gradient дт/dn varies strongly across the layer and applies different streamwise forces to different fluid elements, as shown in Figure 4.7. These variations in the shear forces persistently tend to “flatten” the velocity profile, and their cumulative effect is to cause the overall boundary layer to thicken downstream. The shear gradient also provides a negative feedback in the streamwise momentum equation, in that it acts to partially counter the possibly rapid u(n) profile shape distortions caused by streamwise pressure gradients.

Подпись: Figure 4.7: A transverse shear gradient produces a net streamwise force per unit volume which tends to “flatten” the velocity profile, and results in an overall growth of the boundary layer. —— Tin)

Characteristics of turbulent boundary layers

A turbulent boundary layer features small-scale, rapid, chaotic velocity fluctuations, which result in turbu­lent mixing which transports momentum across the boundary layer. This momentum transport is an apparent Reynolds shear stress, also called turbulent shear stress, and is given by Tt = pt du/dn. This adds to the molecular-motion transport which constitutes the usual laminar viscous shear stress т£ = pdu/dn, so that the total shear stress in equations (4.21) is the sum of the laminar and turbulent contributions.

Подпись: (4.23)( du

T{s, n) = T£ + Tt = yp + PtC, n) j —

In contrast to the laminar viscosity p which is nearly constant, the eddy viscosity pt(n) varies strongly across the boundary layer at any given location s, with the result that the turbulent du/dn profile and hence the u profile are markedly different from the laminar case. The various relevant laminar and turbulent profiles are sketched and compared in Figure 4.5.

Characteristics of turbulent boundary layers

Laminar

The key feature which makes turbulent boundary layers so different is that pt is large relative to p over most of the turbulent boundary layer, but falls linearly to zero over roughly the bottom 20% portion called the wall layer. Here the total stress т is approximately constant and equal to the wall shear stress tw. Hence in the wall layer du/dn varies roughly as 1/n, and therefore u(n) ~ ln n. The variation of all the quantities in the wall layer can be summarized as follows.

т(n) ~ tw ~ const.

pt (n) ~ n

Подпись: du/dnПодпись: (assuming p ^ pt)т (n)/pt (n) ~ 1/n

u(n) ~ ln n

The logarithmic profile in the wall layer gives the overall turbulent profile its distinctive “knee." Its greater velocities near the wall greatly increase the turbulent boundary layer’s resistance to adverse pressure gra­dients by a factor of five or more over laminar flow, which is crucial for the lift generation capability of typical airfoils. The main drawback is that turbulent flow results in increased skin friction and profile drag compared to laminar flow, and this discrepancy increases with increasing Reynolds number. For this reason, turbulent flow is generally undesirable wherever its adverse pressure gradient resistance is not needed.

To solve the boundary layer equations (4.21) for turbulent flow, we must also simultaneously determine the entire eddy viscosity pt(s, n) field, inside and outside the wall layer. This is one of the central goals addressed by turbulence modeling, which is an enormous field (see Reynolds [10]). Covering any such models is beyond scope here. Instead, we will only discuss the general features of turbulence on boundary layer behavior, and consider only relatively simple integral turbulent calculation methods which do not need detailed turbulence models for the eddy viscosity.

Boundary layer equations

Applying all the TSL approximations above to the full Navier-Stokes momentum equation (1.36), and using the unmodified mass equation (1.33), produces the following simpler boundary layer equations.

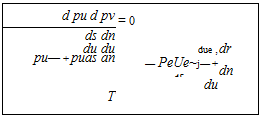
Подпись: d pu d pv = 0 ds dn du du due , dr pu— + puds dn — PeUe~j— + ds dn du T (4.21)

In the shear t definition above, pt(s, n) is the Boussinesq eddy viscosity. This captures the effects of turbu­lence, as will be discussed in the next section.

Подпись: at wall , n = 0: u = 0 , v = 0 at edge , n = ne : u = ue

Appropriate boundary conditions at every s location for a wall boundary layer are

where the boundary condition “at infinity” is now imposed as a specified ue at the edge location ne just outside the boundary layer. The boundary layer equations (4.21) also apply for other shear layer flows such as jets, wakes, and mixing layers. But for these flows different boundary conditions would be used.

If the outer potential flow is incompressible, and in addition there is no significant wall heating or cooling, then the boundary layer is also incompressible and the viscosity is constant, as discussed in Section 1.8. Specifically, in the boundary layer equations (4.21) we have p = pe = constant and p = constant. If pt is also known via some turbulence model, these equations are then closed, meaning that they are solvable for the u, v(s, n) velocity fields.

If significant wall cooling or heating is present, or if the edge Mach number is sufficiently large for signifi­cant frictional heating to occur, then the density and viscosity variation across the boundary layer need to be accounted for via the temperature variation. These compressibility corrections are somewhat beyond scope and will not be treated here in any theoretical detail.