Category Flight Vehicle Aerodynamics

Boundary Layer Governing Equations

4.3.1 Thin Shear Layer approximations

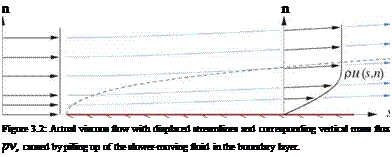
As discussed in Section 1.5.4, at high Reynolds number the viscous layers are thin compared to their stream – wise length. This allows making the following Thin Shear Layer (TSL) approximations in the locally – cartesian s, n surface coordinates (see Figure 3.2).

v

<

u

(4.15)

du

ds

<

du

dn

(4.16)

dp

dn

0

(4.17)

Approximation (4.15) is a geometric consequence of the streamlines having only a small angle away from the wall and the s axis, as shown in Figure 3.2. Approximation (4.16) follows from the relatively rapid variation of the velocity across the layer. Together with (4.15) this allows dropping all but the du/dn term in the 2D version of the full viscous stress tensor (1.22), so that only the off-diagonal shear-stress terms Tsn = Tns = t are significant.

Подпись: Tss Tsn 0 T Tns Tnn T 0 (4.18)

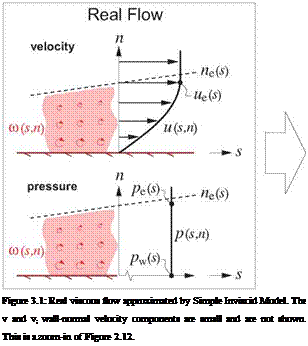
Approximation (4.17) follows from the streamlines being almost parallel within the layer. This was already used in Chapter 3 to give the wall pressure result (3.2), shown in Figure 3.1. Here this approximation allows replacing the n-momentum equation with the simple statement that the pressure across the boundary layer at any s location is constant, and equal to the inviscid flow’s edge pressure at that same s location.

P(s, n) ~ Pe(s) (4.19)

Подпись: dp ds Подпись: d Pe ds Подпись: due peue — ds Boundary Layer Governing Equations Boundary Layer Governing Equations Подпись: (4.20)

Consequently, the streamwise pressure gradient in the remaining s-momentum equation can be replaced by the edge velocity gradient using the inviscid streamwise momentum equation.

Other integral thickness interpretations

9*

Подпись: * Подпись: Пе (1 — U) d n 0 Other integral thickness interpretations Подпись: (4.13) ГПе U — U3) dn (4.14) 0

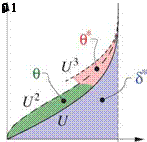
In incompressible flow where p = pe = constant, the displacement, momentum, and kinetic energy thick­nesses have additional interpretations in terms of the geometry of the normalized velocity profile U. By setting p/pe = 1, the thickness definitions (4.4),(4.11),(4.12) simplify as follows.

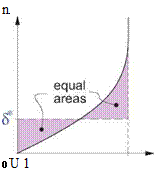
These incompressible thickness definitions can be interpreted as the geometric areas defined by the U, U 2,U3 profiles as shown in Figure 4.4 on the left. The displacement thickness has another interpretation as the height of the line which splits the profile into two equal areas. This is shown in the middle sketch of Fig­ure 4.4.

Other integral thickness interpretations Подпись: n 0 U 1 Подпись: n

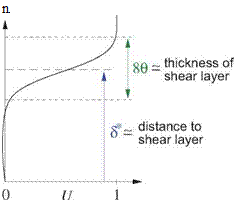
In a separated flow region, such as would occur on the upper rear surface of the nearly-stalled airfoil shown in Figure 3.7, most of the vortical fluid of the boundary layer has lifted off the wall. A typical velocity profile for this type of flow is shown in Figure 4.4 on the right. It is more correct to call this a free shear layer which lies between two distinct flow regions. One is the potential flow region outside the shear layer, and the other is the nearly-stagnant recirculating flow region between the wall and the shear layer. In this case we can interpret 9 as being a measure of the thickness this shear layer (numerically its thickness is approximately 89). In contrast, 5* is a measure of the distance from the wall to the shear layer centerline.

Figure 4.4: Interpretation of the integral thicknesses for incompressible flow, in terms of the geom­etry of the normalized velocity profile U = u/ue, and also U2 and U3. Since the horizontal scale is dimensionless, the areas have the same length unit as the vertical n axis.

Defect Integrals and Thicknesses

As a first step, it’s useful to identify important overall properties of the boundary layer at any streamwise lo­cation s. As in Chapter 3, u, v will denote the s, n axis velocity components, which for a turbulent boundary layer represent the mean flow (e. g. time-averaged flow). The Equivalent Inviscid Flow (EIF) concept, first introduced in Section 3.1, will also be invoked here. Here we will assume that the EIF exactly matches the actual flow outside the boundary layer, and that it’s constant through the boundary layer thickness, so that

ui(s, n) = ue(s) , pi{s, n) = pe{s) (4.1)

at every streamwise station s. The assumption is equivalent to assuming that the boundary layer is very thin compared to the streamwise radius of curvature. This curvature is accounted for in higher-order boundary layer theory, as for example by Lock and Williams [9]. It will not be addressed here.

4.2.1 Mass flow comparison

Figure 4.2 shows the mass flow per unit span passing through the streamtube of height ne, for the real flow and the corresponding EIF. These mass flows might be needed for a control-volume analysis for example.

Defect

8*———- A­

m

Defect Integrals and Thicknesses Подпись: m Подпись: ne Defect Integrals and Thicknesses

The EIF mass flow is greater than the actual mass flow, the difference being the mass defect m. This is seen to be the fictitious mass flow between the real and displacement bodies locally spaced a distance An = 5* apart. This result is closely related to the viscous displacement models shown in Figure 3.3. Those were also based on mass conservation, and hence also depended on the m(s) and 5*(s) of the boundary layer.

Figure 4.2: Comparison of actual and EIF mass flows.

4.2.2 Momentum and kinetic energy flow comparisons

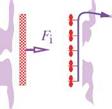
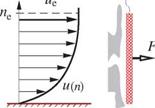
Momentum flow is carried by mass flow, and was already treated in the momentum control volume flow analysis in Section 1.3. Here it will be viewed as the force which acts on a hypothetical barrier which captures the mass flow and brings the fluid’s velocity to zero. Similarly, the kinetic energy flow carried by a mass flow will be viewed as the power obtained from an ideal turbine array which brings the fluid to rest

momentum kinetic energy extractor extractor (barrier) (turbine array)

Подпись:Подпись:Подпись: ‘EiDefect Integrals and ThicknessesПодпись:Подпись: f «- Defect Integrals and Thicknessesr

I

Figure 4.3: Comparison of actual and EIF’s momentum flow and kinetic energy flow, for the same mass flow. Momentum flow is equal to the force on a hypothetical barrier which brings the fluid stream’s s-velocity to zero. Kinetic energy flow is equal to the power from an ideal turbine array which brings the fluid stream’s velocity to zero reversibly.

reversibly. Figure 4.3 compares the barriers and turbine arrays between the actual flow and the EIF. The comparison is done at the same mass flow for all cases, which requires the EIF’s barrier and turbine array to be shorter by the displacement thickness height 5*.

The force and power are obtained by integrating the momentum and kinetic energy fluxes across the profile. The EIF flow case in Figure 4.3 on the right gives the following.

From the final results (4.7) and (4.8) we see that the actual flow has momentum and kinetic energy flows which are less than the EIF’s values by the corresponding defects P and K.

The momentum defect P has also appeared in the airfoil far-field profile drag analysis in Appendix C. The kinetic energy defect K will be seen to be related to the viscous dissipation in the boundary layer, and to the profile drag as well. The associated thicknesses 9 and 9* will also appear in the formulation of integral boundary layer calculation methods considered later in this chapter.

Boundary Layer Analysis

This chapter will treat the physics of aerodynamic boundary layers flows. The objectives include iden­tification of relevant boundary layer parameters, derivation of their governing equations, and formulation of solution methods. Additional objectives are to obtain insight into boundary layer behavior and how it determines overall viscous losses and profile drag.

4.1 Boundary Layer Flow Features and Overview

Подпись: Figure 4.1: Boundary layer and wake development on a typical airfoil, shown by the u(n) velocity profiles. The layer thicknesses are shown exaggerated. Подпись: Far Wake

In general, a boundary layer flow is either laminar with smooth and nearly parallel streamlines, or turbulent with chaotic motion and significant fluid mixing. Most aerodynamic flows over streamline shapes, such as the airfoil flow shown in Figure 4.1, have laminar boundary layers on each side starting from the leading edge stagnation point, which eventually undergo transition and become turbulent. The two boundary layers then merge at the trailing edge into a wake which is almost invariably turbulent. The airfoil’s profile drag is related to the properties of the far-downstream wake, as derived in Appendix C.

The goals of this chapter are description and prediction of the important aspects and parameters of the bound­ary layer flow shown in Figure 4.1. Examples are quantities such as the mass defect m(s) and displacement thickness 5*(s) distributions, already identified in Chapter 3 as being required to model the boundary layer’s effects on the overall potential flow. Both laminar and turbulent boundary layers as well as the transition locations will be considered.

Other goals of this chapter include prediction of profile drag, and prediction of boundary layer behavior in general, in particular its response to pressure gradients. A major motivation is the fact that much of aero­dynamic design can be viewed as “boundary layer management,” in that boundary layers determine profile drag, and their separation also determines the maximum attainable lift, as discussed in Chapter 3. Hence, boundary layer behavior ultimately sets fundamental limits on most aspects of aerodynamic performance.

The focus here will be on 2D flows, which is sufficient to investigate the majority of the important features of boundary layer behavior. Basic 3D effects will also be briefly considered.

Considerations in Flow Model Selection

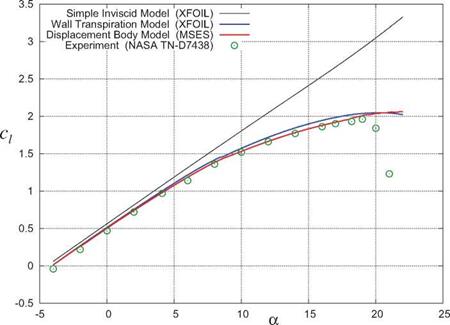
The Simple Inviscid model shown is Figure 3.1 is attractive because it requires only the body geometry and the freestream velocity as inputs. Hence, it’s relatively simple to apply via any inviscid-flow theory or calculation method. For this reason it is often used as a first estimate, and whenever the viscous effects can be considered negligible, as for the small angles of attack in the GAW(1) airfoil example above.

Although the Displacement Body or Wall Transpiration models are clearly superior for all cases, they are considerably more complex to implement and to use. The major complication in their implementation is that they require knowledge of the boundary layer’s mass defect m(s) or displacement thickness S*(s) distributions. These quantities not known a priori, but must come from an analysis of the boundary layer itself (as treated in Chapter 4). Furthermore, the inviscid flow calculation and the boundary layer calculation are also coupled, in that the output of one is the input to the other. For this reason they must be solved in a coupled manner, as for example in the XFOIL 2D airfoil code [5]. This treatment is considerably more complex than the straightforward use of only an inviscid method, such as a panel method, in the Simple Inviscid model, especially for 3D flows. Section 4.12 gives further discussion of the coupling of inviscid and boundary layer flows.

Considerations in Flow Model Selection

Considerations in Flow Model Selection

Considerations in Flow Model Selection

Considerations in Flow Model Selection

clо _ +0-5

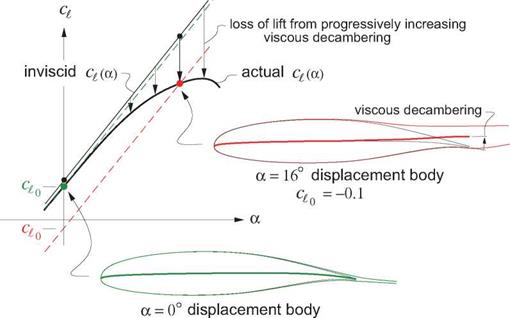
Figure 3.8: Lift curves (dashed) of two GAW(1) displacement bodies with different camberline rear deflections. Viscous decambering correctly models the loss of lift and stall at high angles of attack.

Viscous Decambering Stall Mechanism

The Displacement Body model combined with Glauert’s thin airfoil theory [8], sections D.2 and D.3, pro­vides an intuitive explanation for the loss of lift at stall. This theory gives the general lift result

cg(a) = 2 па + в£0 (3.17)

for any thin airfoil. The lift intercept ci0 depends only on the airfoil’s camberline shape, and is most sensitive to the deflection angle of the camberline over the rear portion of the airfoil. These results also apply to more general airfoils, except with finite thickness the slope dc^/da = 2п will be somewhat larger.

Viscous Decambering Stall Mechanism

Figure 3.5: Comparison of eg (a) lift curves for GAW(1) airfoil at Re c = 6 million, Moc = 0.15, calculated by XFOIL [5] and MSES [6]. Experimental data is from McGhee et al [7].

In light of this result we examine the camberlines of the displacement bodies of the GAW(1) airfoil at the a = 0° and a = 16° operating points, shown in Figure 3.8. The large separation region over the upper rear of the airfoil at high а increases the displacement body offset An there, creating an upward deflection in its camberline which then causes the downward shift in the lift curve for that shape. This upward deflection of the effective camberline is called the viscous flap. The two resulting fixed-camberline eg (a) functions intersect the actual eg(a) curve for the airfoil, which in effect goes through a progression of ever-increasing upward viscous flap deflections which gradually reduce the lift from its strictly inviscid value. Maximum lift and subsequent stall occurs when this viscous flap decambering progression overpowers the inviscid lift coefficient gradient deg/da.

Wall Transpiration model

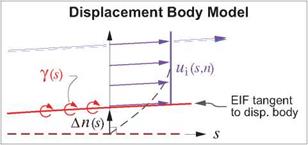
This model places the vortex sheet on the actual body as in the Simple Inviscid Model shown in Figure 3.1. But now a source sheet of some strength A(s) is also added, as shown in Figure 3.3. This generates a fictitious wall transpiration or mass flux distribution {pV)w(s). The resulting EIF is thus intentionally not made tangent to the real body, which enables simulating the displacement effect.

Wall Transpiration model

3.3.3 Wake modeling

The boundary layers on a body merge together at the trailing edge or rear point and trail downstream as a wake. A wake has two edges — upper and lower — where the potential-flow quantities will now be denoted by ()u and ()i, respectively. The particular vertical location of the s-axis, or equivalently the n — 0 point, is not significant, and it can lie anywhere in or near the wake.

If the wake is thin compared to the streamwise radius of curvature, then it has a nearly uniform static pressure across it like a boundary layer. Also, the lower and upper potential flows have the same freestream total pressure, so that the two edge velocities must also be the same, and so both can be denoted by ue.

Pu(s) — pi(s) ^ Uu(s) — ui(s) — Ue(s) (3.12)

The 2D wake has a nonzero mass defect and in general nonzero normal mass fluxes at nu and ni. Repeating the previous mass flux analysis for the wake, the real-flow edge mass flux relation (3.6) becomes a jump condition across the wake.

A(pV) = pV(s, nu) – pV(s, ni)

where m(s)

5*(s)

Note that the m and 5* definitions are the same as for the wall case, aside from the different edge limits.

Repeating the mass flux analysis for the Displacement-Body and Wall-Transpiration models, and requiring that the resulting A (pV) matches the real-flow result (3.13), gives the required displacement body thickness, and the required source sheet strength.

An(s) — 5*(s) (2D-wake Displacement Body model) (3.14)

1 dm

(peUe – pu) dn — peUe5* pu

Wall Transpiration model

(3.9)


Again requiring this to be equal to pV of the actual flow (3.6) gives the the required wall mass flux.


dm

ds


(piVi)w


(3.10)


In a low-speed flow the normal velocity can be imposed using a source sheet, as indicated in Figure 3.3. In this case the airfoil’s interior velocity can still be set to zero when the vortex sheet strength y(s) is calculated by the panel method. The required source sheet strength is then equal to the transpiration velocity, and related to the mass defect as follows.


1 dm. p ds


(Vi )w


A(s)


(3.11)


dm d peue

d7 –


(actual wake) (3.13)


Wall Transpiration model

These are the same as (3.8) and (3.11) for the boundary layer, except that An now only gives the thickness of the wake displacement body. The camber shape of the wake displacement body must be implicitly determined from the zero pressure jump or velocity jump requirement, such that the wake displacement body carries no lift.

Wall Transpiration model

Figure 3.4: Real viscous flow of wake approximated by two EIF models which capture the wake’s displacement effect.

The EIF models resulting from the above matching relations are shown in Figure 3.4. Note that the Dis­placement Body model requires the use of two vortex sheets, which must have equal and opposite strengths as required by zero velocity jump requirement across the whole wake.

Yu(s) + Yi(s) = 0 (3.16)

3.3.4 Improved flow model advantages

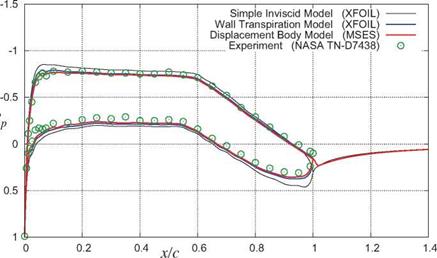
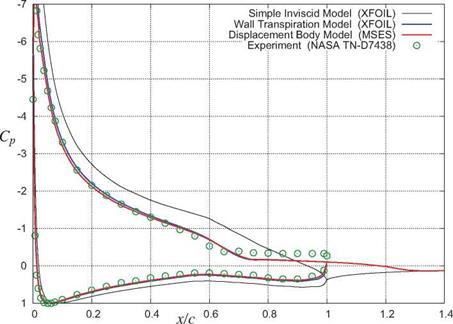
Both the Displacement Body and the Wall Transpiration models quantitatively give very nearly the same results when incorporated into potential flow calculation methods, and both are great improvements over the Simple Inviscid model when separation is present. An example comparison is shown in Figure 3.5 for an airfoil from zero lift to beyond stall. At small lift coefficients where the displacement effects are weak, the three models give comparable results, as shown in Figure 3.6 for a = 0°. At a large lift coefficient with trailing edge separation, the differences are quite significant, as shown in Figure 3.7 for а = 16°.

Improved Inviscid Flow Models

Two improved EIF models considered next are sketched in Figure 3.3. They define the EIF such that it satisfies the normal mass flux matching requirement (3.5), and thus they capture the displacement effect. The result is much better flow-field prediction accuracy, especially for flows with thick boundary layers.

3.3.1 Displacement Body model

This model employs the concept of a fictitious displacement body, which is offset from the actual body by some distance An(s). The EIF is defined to be tangent to the displacement body, and hence can be constructed by a vortex sheet placed on this displacement body, as shown in Figure 3.3, rather than on the

Improved Inviscid Flow Models

Figure 3.3: Real viscous flow approximated by two improved EIF models which capture the real flow’s displacement effect. This mostly eliminates the modeling discrepancies shown in Figure 3.1.

wall as in Figure 3.1. The objective here is to determine what An(s) has to be so that the vertical mass flux matching condition (3.5) is satisfied.

Improved Inviscid Flow Models Подпись: d An PeUe—, + ds d An peUe— ds d(peUe А» ) ds Improved Inviscid Flow Models Improved Inviscid Flow Models Подпись: (3.7)

The EIF’s p[Vi in this situation is computed using the continuity equation, as for the real-flow case. Note that pivi is not zero at the displacement body, since displacement body’s normal vector is tilted away from the n axis by the slope d An/ds. The model is also assumed a priori to give the correct EIF which matches the real flow, so that we can set u; = ue.

Подпись: A n(s) = (s) Подпись: (3.8)

Requiring this pivi to be equal to the real flow’s pv as defined by (3.6), gives

so that the necessary offset for the displacement body is just the displacement thickness (hence the name).

Displacement Effect

3.2.1 Normal mass flux matching

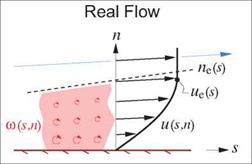
Подпись: n n Figure 3.2: Actual viscous flow with displaced streamlines and corresponding vertical mass flux pv, caused by piling up of the slower-moving fluid in the boundary layer. Подпись: (s)

The major shortcoming of the simple inviscid model shown in Figure 3.1 is that it does not account for the displacement effect of the slower-moving fluid inside the boundary layer. This acts as a wedge, tilting and displacing the outer streamlines away from the wall, as shown in Figure 3.2.

This displacement changes the apparent flow tangency seen by the bulk flow, and thus modifies the overall flow-field. In the simple inviscid model this effect is ignored, which is the main reason for the discrepancies between the EIF’s and real flow’s edge velocity, wall pressure, and lift, shown in Figure 3.1. If the boundary layers are thin, then these discrepancies are small and are often ignored. But if the boundary layers are thick,
perhaps due to a low Reynolds number or the airfoil being close to or beyond stall, then the discrepancies between the real flow and the Simple Inviscid Model’s EIF may be unacceptably large.

Подпись: pV(s,n) = p[V[(s,n) (for n>ne(s) ) Подпись: (3.5)

To mostly eliminate these modeling errors, the EIF must be constructed so that its vertical mass flux equals that of the real flow outside the real boundary layer.

3.2.2 Normal mass flux in real flow

or pV(s, n)

where m(s) S*(s)

Пє

(PeUe – pu) dn = peUe5* J0

>m і An

Taking the d/ds derivative outside the integral is allowed provided the integrand is zero at the upper limit, which is the reason for the n>ne requirement for the final relation (3.6). The mass defect is the difference in the mass flow between the EIF and the real flow, integrated across the shear layer, and the displacement thickness is the resulting physical displacement of the potential flow away from the wall.

It must be stressed here that calculation of m(s) and S*(s) requires an analysis of the boundary layer itself, which will be treated in Chapter 4. Here they are assumed to be known properties of the boundary layer.

Viscous Effects in Aerodynamic Flows

This chapter will examine the changes in an aerodynamic flow caused by the presence of viscous wall boundary layers and trailing wakes. The objective is to model and quantify these changes and to explain their associated phenomena such as loss of lift at stall.

3.1 Inviscid Flow Model

Lumping of the vorticity in the viscous layers into vortex sheets, as illustrated in Figure 2.12 in Chapter 2, produces a fictitious strictly-potential Equivalent Inviscid Flow (EIF) velocity field u;, v;(s, n). The EIF also has a pressure field pi(s, n) related to u;, v; by the Bernoulli equation (1.109).

Pi(s, n) = p^ + ^pv* – ^p(u?+vf) (3.1)

Here u, v will denote velocity components along the local orthogonal sheet coordinates s, n.

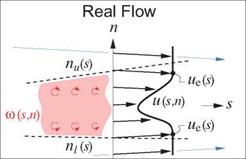
Подпись: Figure 3.1: Real viscous flow approximated by Simple Inviscid Model. The v and v; wall-normal velocity components are small and are not shown. This is a zoom-in of Figure 2.12. Viscous Effects in Aerodynamic Flows

Figure 3.1 compares the EIF to the real flow in more detail, for the case where the lumped vortex sheet is placed on the real surface. It is labeled “Simple” to distinguish it from the more advanced and accurate models considered later, which mostly eliminate the modeling discrepancies in the velocity and pressure in

(3.2)

The subscript ()e will in general denote an “edge” quantity in the irrotational flow just outside the edge of viscous layer, which is demarked by the ne(s) curve shown in Figure 3.1. The subscript ()w will denote a wall quantity at n = 0.

If the boundary layer is thin the vorticity-lumping procedure will incur little error, in which case the wall velocity of the EIF closely approximates the edge velocity of the real flow.

Подпись: (3.3)Uiw (s) – Ue(s)

Combining (3.1),(3.2),(3.3) we have

Piw (s) – Pw(s) (3.4)

so that the EIF captures the real surface pressures, and hence should produce reasonably accurate lift forces and moments. Of course the EIF cannot represent the viscous skin friction in the real flow, so that it cannot correctly predict the drag. This will be addressed in Chapter 4.

Although the above discussion assumed incompressible flows, the EIF concept and flow models can be applied to compressible flows. The only differences are that the compressible Bernoulli relation (1.112) would be used in lieu of (3.1), and a grid method would be used in lieu of the vortex-sheet EIF model shown in Figure 3.1.