Category FLUID-DYNAMIC LIFT

INFLUENCE OF SURFACE ROUGHNESS

The consequences of increased skin friction, caused by surface roughness, as to lift-curve slope, are explained in the section on “circulation”, Chapter II. The basic influ­ence on pitching moment is mentioned in connection with figure 32. In the following, roughness will be considered as it affects the maximum lift of airfoil sections and/or airplane wings.

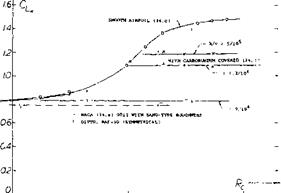
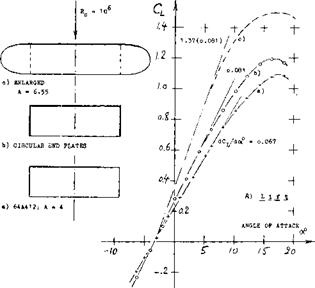
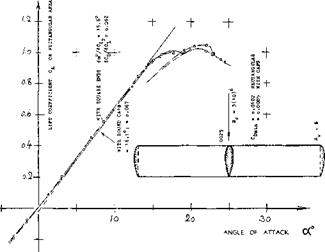
Surface roughness can be local such as at a particular chordwise station of an airfoil, or uniformly distributed over the surface, such as a rough coat of paint, for example. On the lower (pressure) side, roughness tends very slightly to increase the lift at a certain angle of attack. Roughness on the suction side on the other hand, reduces lift and maximum lift coefficient, particularly in well-rounded sections where a gentle type stalling takes place from the trailing edge. As an example of the effect of distributed roughness, figure 28 shows the lift function of an NACA 0012 airfoil tested at RN = 6(10)fe , both in the perfectly smooth condition and after coating the surface uniformly with grains of carborundum. The lift – curve slope is reduced (see figure 28) and the maximum lift is cut down from 1.48 to 1.07.

Maximum-Lift Divergence. As explained, for example in “Fluid-Dynamic Drag”, one consequence of uniformly distributed and closely packed sand-type roughness in the turbulent boundary layer is the fact that the skin-drag coefficient Cp is independent of the Reynolds number and assumes a constant value. As demonstrated in figure 29, the maximum lift coefficient of completely rough airfoil sections is also constant above a certain limiting Reynolds number. Below this Reynolds number, the air­foil behaves as though it were perfectly smooth. Figure 30 shows how the maximum lift coefficient reduces as a function of the roughness grain size. A comparatively small but permissible grain size should apply to this graph too.

і і

INFLUENCE OF SURFACE ROUGHNESS

Figure 29. Maximum lift coefficient as tested on 0012 airfoils with A = 6, as a function of R’number:

a) smooth wind-tunnel models,

b) completely covered with carborundum grains.

Permissible Roughness. As explained in “Fluid-Dynamic Drag”, the permissible roughness size in a turbulent boundary layer approximately corresponds to the grain Reynolds number

R* * w k/v = Rc (w/V)(k/c) ~ 120 (11)

where к = grain diameter and w = local velocity at the spot where the roughness is located. Using equation (1) we can estimate that the NACA 0012 section as in figure 28 and 29, may have a maximum local velocity (some­where at or above the nose) corresponding to w/V^3 at CLX = 1.2 as in graph at Rc somewhat above 106 . For the grain size ratio k/c = 5/105, we thus obtain a critical Reynolds number

R = 120 (10)5/(3.5) = 8(10)5 (12)

INFLUENCE OF SURFACE ROUGHNESS

Figure 28. Lift of an 0012 airfoil tested in A = 6 in the CATunnei (34,c) at R = 6(10)6, in smooth and carborundum covered condi­tion.

This estimate does not agree with the actual divergence Reynolds number 1.2(10)6 as in figure 29. When carrying out the calculation for the re-attachment point (at which the local velocity is lower), satisfactory agreement is ex­pected to be found, however. Now, Extrapolating the results of figure 29 yields

к /с »1/((1 + 2Cl)Rc) (13)

and we tentatively find a permissible grain size ratio к /с below 1/105 at Rc = 4 (10)6 where C Lx = 1.45, as in figure 30.

models by dirt originating in, or “seeping” into, the tun­nel. In conclusion, wherever wind-tunnel tests show maxi­mum lift coefficients leveling off upon approaching Rc = 107, it may be suspected that surface roughness is the cause, unless influenced by compressibility.

INFLUENCE OF SURFACE ROUGHNESS

I06

Ю7

lO8

G__

Ю5


/08

Ю7

Подпись: IObINFLUENCE OF SURFACE ROUGHNESSПодпись: IOb

Roughness in Wind Tunnels. The influence of roughness on CLX has an important implication with regard to the results obtained in either high-speed or pressurized wind tunnels. Consider in particular the NACA’s Variable Den­sity and the British Compressed Air Tunnels operating at 20 and 25 ats, respectively, while testing standard airfoil models having but 5 and 8 inches chord length. At a maximum Reynolds number (as in the CAT of Rc = 7(10) ) the permissible roughness ratio for an airfoil section at CLX = 1.5 is found (for an assumed velocity ratio of w/V = 2) to be in the order of

k/c = 120/ (2 (7) x 10b )~1/105 (14)

The corresponding grain size к is below 1/104” inch or 0.1 mills, or in the order of ^ 2 microns. This roughly represents the surface roughness of “finished” metal. There is evidence such as in (11 ,c) where tests of NACA 63 and 64 series sections (with a chord c = 2 ft) up to Rc = 2.5(10)T show that Cj_x stops increasing in certain sections (see figure 31, a, b, c) between Rc = 104‘ and 107. While it seems to be routinely possible to produce model surfaces sufficiently smooth for this condition, there are reports from other high-speed tunnels indicating that it is a real problem to prevent “sandblasting” of the

INFLUENCE OF SURFACE ROUGHNESS

20-

| SHARP STALL

О ROUND*D TYPE STALL SMOOTH

INFLUENCE OF SURFACE ROUGHNESS

05-

0_

lO5

Figure 31. a) Maximum lift coefficient of two dimensional airfoil sections, NACA 64-012, 63-009 (11), with and without standard roughness.

Figure 31. b) Maximum lift coefficient of two dimensional airfoil sections, NACA 23012 and 0012 (11), with and without standard roughness.

CL,

20-

INFLUENCE OF SURFACE ROUGHNESS

ROUNDED TYPE STALL

0.5-

oL

Ю5

Figure 31. c) Maximum Ijft coefficient of two dimensional airfoil sections, NACA 4412 and 64-418 (11), with and without standard roughness.

Roughness in Full-Scale Operation. The above method for estimating the permissible roughness grain size can also be applied to full-scale airplane operation. Consider, for ex­ample, flow conditions at the suction side near the leading edge of a wing. At lift coefficients above unity the critical local velocity at this point is increased to about 2 times the airplane’s air speed. When flying at 100 knots (for example, takeoff or landing) the maximum local speed is thus in the order of 200 knots (or 340 ft/sec). The permissible grain size of sand-type roughness is then in the order of 0.6 milli-inch, while paint in aircraft mass pro­duction may have a grain size of 1 milli-inch. If it is not the paint, dust and/or insects picked up by the airplanes or the ground or in flight can easily make the nose of the wing section sufficiently rough, so as to affect its maxi­mum lift coefficient in the manner as shown in figures 28 and 29. Note also, that in a turbulent boundary layer the permissible grain size is a function of speed, and not of wing or aircraft dimensions.

Stimulation of Turbulence. In the practical operation of high-speed airplanes (such as fighters) it is known that the qualities of laminar-type wing sections deteriorate rapidly by picking up dust, mud and insects. To simulate this condition, the sections investigated particularly in (11) were (in addition to their smooth condition) routinely tested with a turbulence-stimulating strip of thinly spread carborundum grains placed over the first 8% of the chord (both on the upper and lower sides). The grain size used was 0.011 inch, equal to somewhat less than 5/1СИ’ of the chord. Consequences of this type of stimulation with regard to lift, are:

(a) Some reduction of the lift-curve slope (up to about 10% in higher thickness ratios).

(b) A reduction of maximum lift of as much as 25% depending on shape and thickness ratio.

Efficiency of Airfoils. The efficiency of airfoil sections can be measured by the ratio CLX /Срт/п. In high-speed sections, the Cp mm is expected to be low (say in the order of 0.005) corresponding to an appreciable percent­age of laminar boundary layer flow. However, when judg­ing the efficiency of an airplane, the drag coefficient of the complete craft should be considered rather than that of the wing only.

Type of Stalling. Maximum lift coefficients of several airfoil sections, tested with “standard” leading-edge roughness, are plotted in figure 31 as a function of the Reynolds number. Three different groups of airfoil sec­tions were found as to the influence of the roughness strip upon the magnitude of CLX •

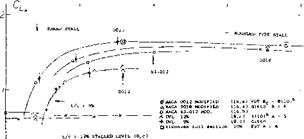
(a) Figure 31,a shows that in symmetrical (and compara­tively sharp-nosed sections) the rise of the maximum lift coefficient above the thin-foil level is prevented by rough­ness. Note that in the smooth condition the two sections shown each end up at a higher but constant level, sug­gesting that the “natural” roughness of their “smooth” surface is dictating that level.

(b) The majority of all airfoil sections belongs to the leading-edge stalling group as in figure 31,b. Their maxi­mum lift coefficient is considerably reduced by the rough­ness strip, the amount growing with the Reynolds num­ber.

(c) The influence of nose roughness on the maximum lift of the sections shown in figure 31,c is to produce a more or less constant reduction. It seems that all sections with typical or exclusive trailing-edge stalling (highly cambered sections, with higher thickness ratios) belong to this group. It appears that the carborundum strip takes away a specific amount of momentum from the suction-side boundary layer, thus reducing pressure recovery at the trailing edge.

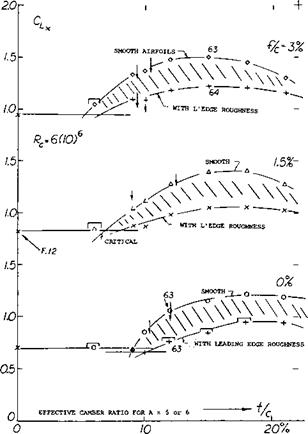
Airfoil Thickness. The size of the “standard” turbulence і stimulation strip used by the NACA (11) is arbitrary. All that the strip tests give in regard to maximum lift is a qualitative indication of the influence of roughness around the nose on the magnitude of CLX. Figure 24 shows that the CLX of sections below 6% or 8% or 10% may not be sensitive to roughness. Sections with thickness ratios between 12% and above 20% can, on the other hand, be very much affected by leading-edge roughness, particularly in effective camber ratios between 0% and 3% (which means all sections used in high-speed airplanes).

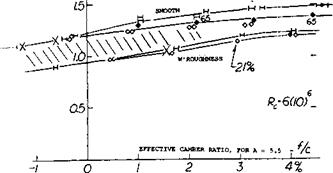
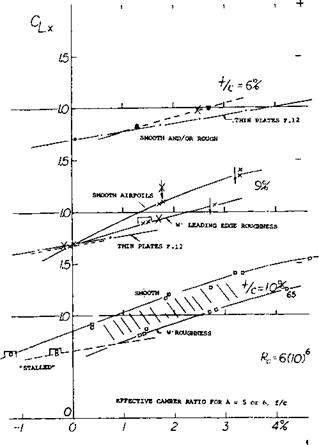
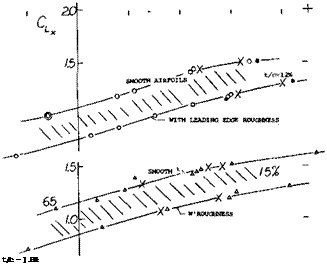
Cambered Sections. Figure 25 illustrates the variation of the maximum lift coefficient of the NACA 63 and 64 series sections (11) as a function of effective camber ratio and shows that:

(a) Sections up to t/c = 6% do not exhibit much of an influence of leading-edge roughness.

(b) The influence of roughness increases systematically as the thickness ratio is increased to 9%, 10% and 12%.

(c) The 12% and 15% thick sections show practically constant differentials of maximum lift due to standard roughness;

ACLX~ -0.3.

The data given in figure 25 shows little difference in the maximum lift coefficient of NACA 63 and 64 series sections in the smooth model condition.

Corrugated Surface. Early Junkers aircraft used cor­rugated sheet metal as a properly stiffened skin for canti­levered monoplane wings. At speeds in the order of 200 mph it was thought that drag may not be too critical while light-weight construction did provide high payload fractions and/or range. To evaluate the effects of a cor­rugated surface three Clark-Y wing models were tested (26,c) at Rc = 2(10)6 with the following results:

(a) smooth airfoil with A = 6; CLX = 1.22.

(b) with corrugations placed on top of contour; C LX = 1.25.

(c) with corrugations cut into the model; CLX = 1.26.

Although drag is generally somewhat increased, the maxi­mum lift coefficient is surprisingly enough not reduced. It must, therefore, be postulated that the corrugations have some “stabilizing” effect on the flow past the suction side, reminiscent of the influence of vortex generators (see Chapter V). This effect is particularly present at angles of attack some 8 above that for C Lx °f the A = 6 airfoils tested.

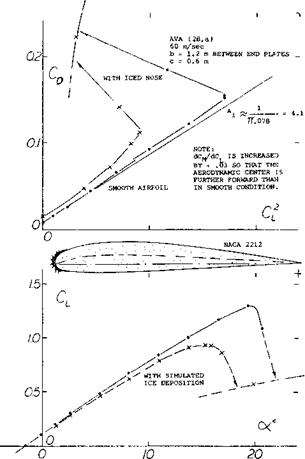
Ice Formation. When flying at temperatures below freez­ing, rain may be deposited, particularly on the leading edge of wings, in the form of ice. Figure 32 presents one example of such deposits, tested (28,a) at Rc =: 4(10) . In comparison to the smooth NACA 2212 section, C ^ is reduced from 1.3 to below 1.0. Not only is the maximum lift of an airplane flying in icing weather reduced but its drag and its weight also grow simultaneously so that eventually it may no longer be possible to keep the craft flying. Ice coatings may be mechanically removed by inflating rubber “boots” (28,b) placed upon (built into) the wing leading edge. Of course, such devices are bound to reduce lift (lift-curve slope) and maximum lift coeffi­cient to a degree, even when not in operation. Naturally, all the types of roughness discussed also increase the section drag, (a) because of stimulation of turbulence and

(b) because of their own addition to skin drag (See Chap­ter V of “Fluid-Dynamic Drag”). [49]

INFLUENCE OF SURFACE ROUGHNESS

Figure 32. Example for lift and drag of a 2212 airfoil, tested (28,a) between end plates, with and without simulated ice forma­tion around the leading edge.

MAXIMUM LIFT AS A FUNCTION OF SHAPE AND REYNOLDS NUMBER

As previously noted, the airfoil shape and the operating Reynolds number strongly influence maximum obtainable lift. Also influenced is the variation of CL with angle of attack or the type of stall encountered by the airfoil. These characteristics are a function of the type of bound­ary layer and its thickness variation along the chord.

Principles. Analysis of boundary layer development along the suction side is very involved. The methods available for predicting the value of the maximum lift coefficient, say as a function of section shape, are lengthy and in­volved and require the use of high speed computers, yet are not completely reliable. For this reason, statistical information are presented in this’ section to provide an insight of the available data. Certain guiding principles can be stated, however, and it can be said that CLX depends:

a) on the sum of the momentum losses incurred along the suction side

b) on the values of the skin friction drag coefficient

c) on the location of the boundary layer transition point along the suction side

Подпись:Boundary layer transition and drag coefficient are both a function of Reynolds number and of surface roughness. Momentum losses are, of course, a function of shape (as explained to some degree in the “stalling” section). Tran­sition from laminar to turbulent boundary layer flow can be strongly affected by wind-tunnel turbulence, or it can be brought about on purpose by stimulation (surface roughness around the leading edge).

Stall Type Prediction. It is useful to determine the type of stall that will be encountered. Prior to discussing the effects of airfoil shape and Reynolds number in terms of the individual parameters. For airfoils such as the NACA four and five digit types, as well as the NACA 6 series, the type of stall encountered is a function of the Reynolds number and the vertical ordinate at the 0.0125% chord, (see figure 8). This curve applies for smooth airfoils and shows the effects of camber and leading edge radius on the type of stall. Note the importance of leading edge radius and the secondary effects of Reynolds number.

Figure 8 is a generalized curve and does not predict the stall type for all airfoils. One notable example is the NACA 23xxx series which have blunt leading edges so that the upper surface ordinate at 0.0125% chord is high, indicating trailing edge stall. However, the stall shown in figure 7 for the 23011 section is sudden and sharp, indi­cating leading edge stall. In spite of this problem, figure 8 is useful in the majority of cases.

(13) Airfoils with A = 6 in NACA V’Density tunnel:

a) Jacobs, 78 Related Sections, T Rpt 460 (1933)

b) Jacobs, Function of R’number, T Rpt 586 (1937).

c) Jacobs, Various Corrections, T Rpt 669 (1939); this report is the best of the series.

d) Pinkerton, Various Sections, T Rpt 628 (1938).

e) Jacobs, 23012 Type, see references (10,b, c).

CLx As a Function of Nose Shape. As previously indi­cated, the flow at the leading edge is critical with regard to separation, and therefore maximum lift. This is illus­trated by considering symmetrical airfoils in which case the flow about the leading edge is a function of forebody shape, or in this case nose radius (see equation 1).

MAXIMUM LIFT AS A FUNCTION OF SHAPE AND REYNOLDS NUMBER

NOSE RADIUS r/c*

ЛІ————— 1———————————– J—————- 1 і

<5 /234

Figure 9. Maximum lift ot symmetrical airfoil sections, as a func­tion of their nose radius ratio r/c.

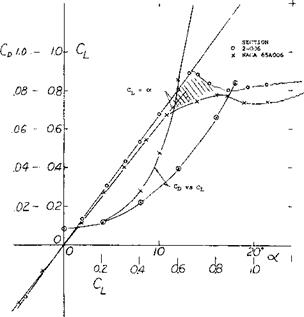
Maximum lift coefficients are plotted versus the nose radius ratio in figure 9. The optimum radius (yielding the peak maximum lift coefficient) is found to be between 1.5 and 2.0% of the chord; and it seems this size radius applies to all thickness ratios between 6 and 18%, results of which are plotted. Nose radii on this order are provided in the NACA 0012 and 63-012 airfoils. From figure 9 it would therefore appear to be advisable to double the nose radius of 4-digit foil sections having thickness ratios be­tween 6 and 9% to improve Clx, while it might do no harm to reduce the radius in sections which are thicker than 15%. Note, however, that camber should also be considered in connection with the nose radius. An ex­treme example of increased nose radius is shown in figure

10. While Clx is duly increased, Cpminmay also be. increased, particularly in comparison with a same­thickness airfoil section providing there is some laminari – zation of the flow, such as the NACA 65-006 for example. As a consequence the parameter of merit, Clx /Сотій, of the highly round-nose section is not in any way higher than a comparable 63/64/65 series section.

(14) Suppose there is a turbulence factor reported, pre­sumably correct for the tunnel’s “cruising” speed, and the tunnel is used at 1/8 of that speed. Corresponding to v^8 = 2, the factor should then be doubled; and when the factor was 1.5, for example, it should be 3 for the low speed assumed.

(15) The Cux value in two-dimensional How can be expected to be some 6% higher than the average in a wing with A = 6. However, the boundary layer along the lateral walls in a two-dimensional tunnel can be suspected to cause some reduction of the average maximum lift test­ed.

(16) Influence on stalling of section nose modifications:

a) Modification of 4-Digit Sections, see (13,a,3)

b) Kelly, 63-012 Section, NACA TN 2228 (1950).

c) Doetsch, Symmetrical Sections, see (8,a).

d) Макі, 64A010 Modifications, TN 3871 (1956).

e) Racisz, Round-Nose 6% Section, NACA RM L53J29.

Подпись: О 2-006 NACA 65A006 Подпись:MAXIMUM LIFT AS A FUNCTION OF SHAPE AND REYNOLDS NUMBERПодпись:Подпись: (8,a) {eh!1 Подпись: Ю* So* Ю6 ю7 icPПодпись:MAXIMUM LIFT AS A FUNCTION OF SHAPE AND REYNOLDS NUMBERr/c = .81%’

MAXIMUM LIFT AS A FUNCTION OF SHAPE AND REYNOLDS NUMBER

Figure 10. Lift and drag of two 6% thick airfoil sections differing in nose radius, tested in A = 4 tapered wings, on fuse] age body at Rc=5(10) in a closed tunnel (16,e).

Sharp Leading Edges. As explained by the thin-airfoil stall mechanism, boundary-layer transition can be precipitated by a sharp leading edge. This is evidently so in flat, and/or cambered plates, at Reynolds numbers below 105 (see figure 11). In that range, such plates, and/or very thin and/or sharp-edged foil sections, develop much higher maximum lift coefficients than any conventional (round­nosed) airfoil shapes. This fact seems to be the reason and/or the explanation why insects and some birds do have thin and possibly sharp-edged wings (12). Birds may also have some turbulence-stimulating roughness (fuzz) which could be particularly useful along the upper side of the leading edge. The jib of a small sailboat also seems to fall into the range below the critical Reynolds number, at least in light breezes, and certainly when trying to get out of a calm. In other words, the shape of a sail stretched irom a wire or a reinforced seam, is an optimum, at least below Rc = 105. Another example where a sharp leading edge has, a beneficial effect is the circular-arc section (as frequently used in marine propeller blades) when used at lower Reynolds numbers. [48]

i1-

MAXIMUM LIFT AS A FUNCTION OF SHAPE AND REYNOLDS NUMBER

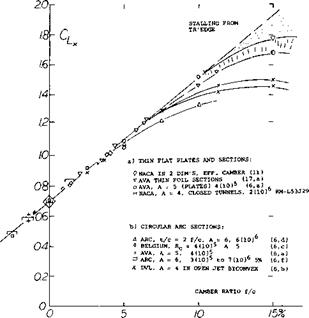
Figure 12. Maximum lift coefficient of sharp-edged sections as a

function of their camber ratio:

a) thin plates, tested in A = 5

b) circular-back airfoils in A = 6

c) biconvex and double-wedge sections.

Effect of Camber. Where camber is used, stalling and Cux become a function of the section-nose curvature between the leading edge and the upper (suction) side. This curva­ture is related to the nose radius, r/c, and the camber ratio, f/c, and increases with f/c. The flow around the leading edge of a thin plate can obviously be facilitated by bending the section “nose” into the oncoming flow. At higher Reynolds numbers, laminar separation and the bubble-plus-re-attachment mechanism might then be mini­mized. For thin sharp-edge sections and airfoil sections, the C [__x increase is given as a function of camber ratio on figure 12. For practical purposes, the values reached seem to be independent of the Reynolds number, providing that the leading edge is reasonably thin (and the camber not too high).
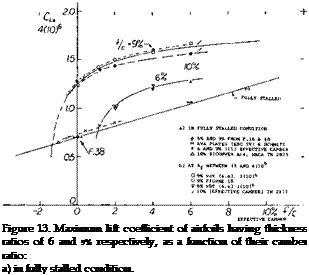
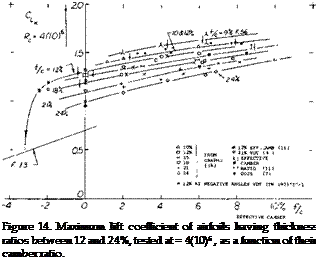
Подпись:Подпись:Camber Ratio. No distinction has been introduced in all graphs presented with regard to the location of maximum camber along the chord. The differences in maximum lift for airfoil sections having their maximum camber located between 30 and 50% of the chord are comparatively small. The main effect of camber is the actual amount of camber. This is illustrated by a few experimental points obtained from a two-dimensional wind-tunnel set-up (11) plotted against camber ratio figures 13 and 14. After adjustment to A = 5 or 6 according to equation (7). Characteristics of thin airfoils, with t/c = 6 and 9% are presented in figure 13. It is seen that for camber ratios between plus and minus 1% their maximum lift co­efficients reduce to the fully stalled level indicated by a straight line connecting points obtained at very high angles of attack (on the order of 30°). The practical use of thin and cambered sections in airplanes is limited by structural considerations. For certain other applications, such as turning vanes in ducts or turbines, the)’ may profitably be used at lift coefficients compatible with their camber ratio. Airfoil shapes with thickness ratios of

12%, and above, represented in figure 14, fall entirely above the stalled level indicated in figure 13. Their maxi­mum lift coefficients grow steadily as a function of cam­ber, to the highest effective camber ratios tested, on the order of 10%.

MAXIMUM LIFT AS A FUNCTION OF SHAPE AND REYNOLDS NUMBER

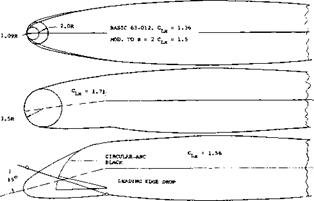
Figure 15. Several leading-edge (nose) modifications tried (16,b) on 63-012 foil section to improve maximum lift (and stalling). Rc = 4.9(10)6 .

Nose Camber. The NACA 63-012 section as tested be­tween walls (16,b) at Rc = 5(10)b and M = 0.18, stalls suddenly from CLx = 1.36, exhibiting violent buffeting and shaking at angles of attack beyond stalling as would be predicted from figure 8. By increasing the nose radius from 1.1% of the chord to 2%, Cue, is increased to 1.50; the sudden type of stalling still remains, however. An attempt was, made therefore, to remedy the situation by pulling down (i. e., drooping) the section nose using nose camber in the form shown in figure 15. Again, CLx is increased; but the type of stalling is still sudden, of the thin airfoil bubble bursting type. Pressure distributions show that stalling takes place on reaching Cpmm = -10. It therefore appears that behavior at and beyond CLX can only be made gentle when stalling occurs from the trailing edge; and that can be done only by camber plus thickness.

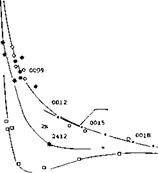
Critical Reynolds Number. The Operating Reynolds num­ber is an important parameter affecting the maximum lift coefficient of airfoils, since it, along with the shape, is a factor which determines the position of airflow separation and thus CLx- As shown on figure 16, the maximum lift coefficients of all but very thin airfoils increase sharply in the vicinity of Rc = 105. This is the critical Reynolds number range where the boundary layer flow turns turbu­lent so that the laminar-type separation from the suction side disappears. Airfoils such as the NACA 0009 also have the same critical change of flow pattern, but at a higher Rc (see figure 16). Because of shape (no camber), transi­tion from the laminar to the turbulent boundary layer is

Подпись: І<3 їхПодпись:Подпись: KfAVA JOUKOWSKY INTERPOL 9%, f = 1.2 (17,a)

GO-358 (10.5/6)% BETWEEN END PLATES, f = 1.2 (4,f)

ARC-CAT (8.6/4.0)% A = 6, f = 2.5 (9,e)

DVL 2409, A = 5, f = 1.1 (8,a)

DVL 2309, A = 5, f = 1 (8,a)

0 AVA GO-622 (8/2.2)% A = 5, f = 1.5 (19)

j_ RAF-28 (907/l.8)% DUPLEX (7,c) and CAT, f = ], (4,b)

* NACA-FST 0009, A = 6, f = 1.0 & 1.2 (7,b)

C DVL 0009, A = 5, f = 1.0 & 1.1 (8,a)

-7 NACA 64-210 A = 6 WING, f = 1 (TN 2753)

A 63 and 64-009, EFF CAMBER 1.8% (11,g)

Л 0008 in 2-DIMENSIONAL FLOW 1.7% (11, f)

X DVL 9% – 0.83, 40, A = 5, f = 1 (8,c)

– DVL 9% – 0.83, 45, A = 5, f = 1 (8,c)

DVL 9% – 0.55, 40, A = 5, f = 1 (8,c)

Г FULL-SCALE T, A = 4, 10% BICONVEX (TN 2823

• RAF-34 IN ARC (10/1.5)% f = 2 (9,e)

MAXIMUM LIFT AS A FUNCTION OF SHAPE AND REYNOLDS NUMBER

1c7 ‘los
delayed to a Reynolds number which is roughly 10 times as high as for most of the other sections having thickness ratios and/or nose-radius ratios larger than the NACA 0009 section. The airfoil nose-radius ratio is thus an important influence with regard to the critical Reynolds number of the section, figure 17. Note that the sections with the smallest curvature tend to have the highest criti­cal Reynolds numbers for the strong increase of CLy.

X AVA JOUKOWSKY 11.5%, A = 5, f = 1.2 (17,a)

» AVA GO-358 (10.5/6)% BETWEEN END PLATES, f = l(4,f)

V SCHMITZ N60 (12.4/4)% f = 1.1 (20,a)

A NACA-VDT 6412/4412, f = 2.9, A = 6 (13,b)

X DVL 23012, A = 5, f = 1 IN OPEN TUNNEL (8,b)

0 DVL CLARK-Y (11.7/3.9)%, A = 5, f = 1 (7,a)

» NACA-FST CLARK-Y, A = 6, f = 1 (7, a)

X 0012 IN 2-DIMENSIONAL, EFF CAMBER 3% (11,c)

▲ ARC-CAT (12.9/6)%, A = 6, f = 2 (9,e)

♦ ARC-CAT CLARK-YH (11.7/3.1)% f = 1 * (9,e)

-H – AVA GO-796 (12/3.7)% BETWEEN WALLS, f = 1.2 (19)

h NACA 23016/09 TAPERED WING (TN 1299)

H GALCIT 2412, A = 6, f = 1.2 to 2.4 (T RPT 558)(12,c)

□ DVL 2412, A = 5, f = 1 (8,a)

Г ARC RAF-34 (12.6/1.8)% f = 1.8 (17,c)&(4,b)

J_ NACA FST 0012, A = 6, f = 1.1 (7,b)

C DVL 0012, A = 5, f = 1.1 (8,a)

© DVL 12% – 1.1, 40, A = 5, f = 1.1 (8, c)

A ARC-CAT 0012, A = 6, f = 2 to 3 (4,b)

+- AVA GO-459 (12.5/0)%, A = 5, f = 1 & 1.5 (17,a)

DVL 0012 – 0.83, 35, A = 5, f = 1 (8,c)

1 DVL 1.1, 35, 11.4 – 0.55, 43, A = 5, f = 1 (8,c)

A SCHMITZ N60R (12.4/3)% A = 5 (20,a)

V DITTO, FULLY STALLED CL, f = 1 (20,a)

MAXIMUM LIFT AS A FUNCTION OF SHAPE AND REYNOLDS NUMBER

Подпись: Kcrit WHERE Подпись: SYMMETRICAL SECTIONSПодпись: - 0 . 0021 Rcrit~c/fПодпись: -D f/c = (4 to 6)%MAXIMUM LIFT AS A FUNCTION OF SHAPE AND REYNOLDS NUMBERПодпись:

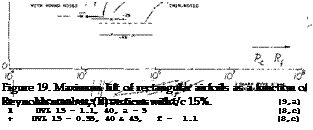
Figure 16. Maximum lift of rectangular airfoils as a function of Reynolds number, (C) sections with t/c = 8 to 10%.

/08 ri

"Lx RISES ‘STALLED

A 6% SECTIONS IN 2-DIMENSIONAL FLOW (ll, c) 1.4% CAMBER Л 9% SECTIONS AS TESTED BY DVL (8,a, c)

• A FEW OTHER FOIL SECTIONS O. SYMMETRICAL 4-DIGIT SECTIONS X from GRAPHS CLx (Rf) for f/c – 2% a FROM VARIOUS GRAPHS FOR f/c = (4 to 6)%

NOTES:

a) RESULTS FROM THE NACA LOW-TURBULENCE TUNNELS (11) TEND TO BE ON THE HIGH SIDE.

b) RESULTS FOR f/c BETWEEN 4 and 6%, TAKEN FROM THE VARIOUS GRAPHS C^ (Rf), MAY NOT BE VERY RELIABLE.

c) WHILE CAMBER BASICALLY COMBINES WITH NOSE RADIUS IN PRECIPITATING TRANSITION, ITS INFLUENCE REDUCES TO NOTHING AS THICKNESS AND NOSE RADIUS GROW TO 21 and 5%, RESPECTIVELY.

10 /0

NOSE-RADIUS RATIO

6ЙГ r/c

– gure 17. Critical Reynolds number of airfoil sections, where >w attaches to the suction side so that the maximum lift coeffi­cient rises above the subcritical stalled level, as a function of the nose-radius ratio.

(18) Lift coefficients are rather low in insects (below 0.1).

(19) Riegels, “Aerodynamische Profile”, Munchen 1958; re­view of theory and experimental results over the past 30 years, a catalog of airfoil sections.

(20) Airfoils at very small R’numbers:

a) Schmitz, Aerodynamik des Flugmodells, Berlin 1942 & Duisburg 1952; Small R’Numbers, Ybk WGL 1953 p. 149.

b) Muesmann in AVA Tunnel, 1956, quoted in (19).

(21) See in Chapter II of “Fluid-Dynamic Drag”. The reduc­tion of maximum lift observed in “well-rounded” foil sections also corresponds with the fact that the drag coefficient of a sphere increases again after the critical drop at Rj := 4 (10)^ see Chapter III of “Fluid- Dynamic Drag”.

(22) Theory and tests of Joukowsky sections:

a) Joukowsky, Zeitschr Flugtech Motorluft 1910 p. 281; also in “Aerodynaminique”, Paris 1916.

b) AVA Gottingen, 36 Sections, Erg III & IV (1927/32).

c) Glauert, Generalized Family, ARC RM 911 (1924).

d) ARC, Series Tested, RM 1241 (1929) & 1870 (1939).

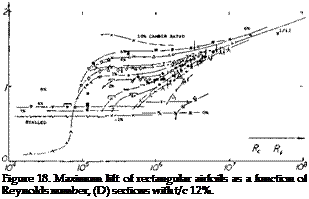
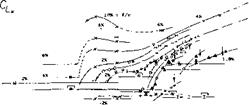
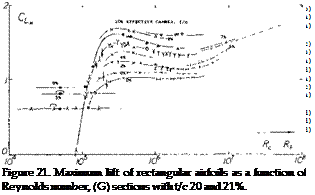
High Reynolds number. Reynolds numbers in the range of 10fe to 107 represent airplanes operating at minimum flying speed at takeoff or landing. The variation of of airfoils in this range of Reynolds number and down to 10b are given in figures 16 and 18 to 22. The principle characteristics for this range are:

(a) Thin plates and airfoil sections up to 3% thickness continue to have essentially constant maximum lift coeffi­cients, corresponding to thin-foil type stalling.

(b) Thin airfoil sections (between t/c = 5 and 10%) display a basic increase in C Ly as their camber ratio is increased from zero to 2% (as in figure 16). Their flow pattern at the angle of attack where Cl = maximum changes from more or less separated (as in thin airfoil stalling) to almost fully attached. The Reynolds number and/or camber ratio at which the change takes place, can be very sensitive to the test conditions.

(c) As seen in figures 16 and 18, in the vicinity of Rc = 10all sections with moderate thickness (between 8 and 12%) and small camber (between 0 and 2%) have a marked tendency for increasing maximum lift coefficient as a function of Reynolds number. This is caused by an improved flow around their noses as the transition to turbulent flow within the boundary layer moves farther toward the leading edge.

(d) All highly cambered and/or thicker airfoil sections (that is, all sections with well rounded noses) do not present “any” difficulties to the flow around the leading edge. Since their maximum lift coefficient is a function of the momentum remaining within the boundary layer
when arriving at ttie trailing edge, the CL* of these thicker sections depends on the average skin-friction drag coeffi­cient along their upper (suction) side. For Reynolds numbers approaching 107 that drag coefficient increases (21) as a consequence of boundary layer transition. As seen, particularly in figures 20 and 21, the maximum lift coefficient of this group of sections is therefore lower in the vicinity of Rc = 10 reaching a minimum somewhere between Rc = 106 and 10 7.

X

GO JOUKOWSKY INTERPOLATED

(17,a)

7

ARC-CAT (16.8/7.6)% f = 1

(9, e)

NACA 23018 in 2-DIMENSIONAL FLOW, f/c 5%

(11,a)

NACA 4418 in 2 DIMENSIONS (6.3%)

(11,a)

A

DVL Cl-Y-18 (18/6.3)%, A = 5

(8,b)

О

AVA GO 390 BETWEEN WALLS f = 1.2

(4,f)

0

2-DIMENSIONAL 63-018, f/c 2.3%

(11,c)

И

DVL 2418, A = 5, f = 1

(8,a)

гл

NACA 0018 – FULL SCALE T, f = 1.1, A= 6

(7,b)

#

DVL 0018, A = 5, f = 1

(8,a)

A

DVL 18 – 1.1, 40, A = 5, f = 1

(8, c)

Cl.

2 –

CAMBER RATIO, f/c – 10X ‘rjfa

~ К

MAXIMUM LIFT AS A FUNCTION OF SHAPE AND REYNOLDS NUMBER

-24

f/c = -4%

Rt Rf

icf Ю5 /0s io7 /о8

Подпись: NACA 24 & 4412 in 2 DIM'S, EFF CAMBER 4.6/6/6% (11, a)
MAXIMUM LIFT AS A FUNCTION OF SHAPE AND REYNOLDS NUMBER MAXIMUM LIFT AS A FUNCTION OF SHAPE AND REYNOLDS NUMBER

Figure 20. Maximum lift of rectangular airfoils as a function of Reynolds number, (F) sections with t/c 18%.

Подпись:Подпись: 2-MAXIMUM LIFT AS A FUNCTION OF SHAPE AND REYNOLDS NUMBERMAXIMUM LIFT AS A FUNCTION OF SHAPE AND REYNOLDS NUMBERПодпись: Ю7-t-

Л GO JOUKOWSJCY 244 INTERPOLATED (17 a)

Д Cl-Y-24 (24/10)4 WL (8 b)

A 2-DIMENSIONAL 2424 . 4424,EFF. CAMBER (11,a)

□ ‘RAF-89 (25/1.94) f=2 CAT *=6 (7,c)(9,a)

C NACA-FST 0025 A=6 1 <7,c)

О AVA 0025-40, f = 1, A = 5, OPEN (17,c) —

D ARC-CAT 0030 A = 6, f = 1 4 2 (9a)

/ –

Oj________ ,___________ і

I04 Ю5 /06

Figure 22. Maximum lift of rectangular airfoils as a function of Reynolds number, (H) sections with t/c equal to and above 24%.

The different types of stalling discussed before also result in different trends (gradients) of CLX . Sections; exhibiting the thin-foil type of stalling have essentially constant maximum lift coefficients. The sudden leading-edge type stalling is accompanied by a usually steep increase of CLX as a function of Reynolds number. Real trailing-edge stalling grows slowly as a function of Reynolds number, so that the maximum lift coefficient reduces for higher camber ratios, as seen in most of the graphs presented. Regarding the flying qualities of an airplane near CLX > the round-top type of stalling is, of course, more desirable than a sharp stall from a high peak. It can also be argued that a gently stalling airfoil section will have a “useable” maximum lift coefficient equal to its maximum, while a thinner and/or less cambered section with a dangerous sharp type of stalling would always have to be kept sufficiently below the maximum. The various phases marked in all the graphs permit selection of airfoil sec­tions, not only as to efficiency but as to behavior.

Theoretical Analysis. An early theory for analyzing the boundary layer around the leading edge of an airfoil is presented in (23). This theory permits calculation of the maximum lift coefficient as a function of Reynolds num­ber and/or stream turbulence for moderately thick and cambered air-foil sections. The theory appears to be accu­rate, however, only at Reynolds numbers where stalling is produced by separation (bubble bursting) near the leading edge.

*2 3) Theoretical analysis of maximum lift and separation;

a) vonKarman and Millikan, Analysis of Maximum Lift, J RAS July 1935; also J Appl Mech 2,A,21 (1935).

b) Howarth, Theory, Proc Roy Soc London A.868 (1935) p. 558.

c) Math Model, Stevens, W. A. et al, NASA CR-1843.

d) Evans & Mort, Sudden Stall, NASA TND-85.

In the case where stalling is caused by trail edge separation the maximum lift coefficient is a result of a balance between the kinetic and potential energies of the bound­ary layer flow. The potential flow energy is represented by the pressure increase between the minimum-pressure point and the trailing edge. Thus for a section with moder­ate camber and a well rounded leading edge the stalling can be determined as a function of the kinetic energy in the boundary layer. Since the kinetic energy in the bound­ary layer is a function of Reynolds number and increases as skin friction decreases, it can be speculated that

cu -l/lcf R~£b (9)

where n = 0.5 (1/6) = 1/12, and 1/6 is equal to the average exponent when the drag coefficient is turbulent. Based on the above equation it would appear that the maximum lift coefficient should continue to increase above Rc = 107 . In making such extroplation of the test data it should be noted that any increase in Reynolds number is usually a result of an increase in speed and the following must be considered;

(a) the influence of surface roughness (see section 4)

(b) the effects of compressibility as measured by Mach number.

With the use of high speed computers the theoretical methods have been extended (23 ,c) to allow the calcula­tion of CLX for any combination of conditions operating at low Mach numbers. Such procedures have led to the development of advanced airfoils as discussed in Chapter II with an increase of CLX equal to 20%.

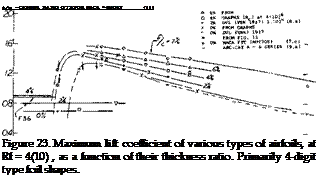
Thickness Ratio. Practical applications, with regard to maximum lift, such as airplane wings, require considera­tion of Reynolds numbers in the vicinity of Rc = 107 . Since only a few systematic investigations have been ex­tended to that Reynolds number, we have rather plotted the more complete data for Rf =4(10) in figure 23, as a function of thickness ratio. The critical change of the flow pattern described for the Reynolds number of 4(10) will also apply at Reynolds Numbers in the vicinity of Rc = 107 . The maximum lift coefficient is seen to increase “suddenly” for camber ratios between 0 and 2% at t/c between 5 and 8%. Below t/c = 8 or 9%, (and below 2 or 4% camber) the sections exhibit thin-foil stalling. Peak values of the maximum lift coefficients are then obtained in sections with t/c in the vicinity of 10%. Judging by the large number of experimental results available, a thickness ratio of t/c = 12% is evidently considered to be most efficient. While somewhat thinner sections may, at full – scale Reynolds numbers, be superior in the fluid-dynamic aspect, structural considerations tend to make a 12%
Подпись:-+

ct„

0—————- 1—————- 1—————- 1__________

о /0 20 30% f/c

Influence of Nose Radius. In keeping with what is said above regarding their nose radius ratio, the experimental results of 63 and 64 series airfoils are more or less differ­ent from the corresponding graphs representing 4-digit and similar foil shapes:

(a) Because of the comparatively small nose radius, the increase of CLX versus thickness ratio, as in figure 24, is considerably delayed in comparison to that in figure 23. See figure 17.

(b) For the same reason, the 63 and 64 type sections in

figure 25, exhibit values which are considerably

lower than those in figure 14, particularly in the range of smaller and smallest camber ratios.

MAXIMUM LIFT AS A FUNCTION OF SHAPE AND REYNOLDS NUMBER

thickness ratio more attractive, at least within the range of moderately high subsonic speeds. Sections with t/c = 0 and 10% have frequently been investigated. As a compro­mise between aero-dynamic and structural effectiveness. For example, the NACA 0009 has often been proposed as a shape to be used in the design of tail surfaces for higher-speed airplanes. Maximum lift characteristics of most of these sections are as described under (c) of the previous section. As the thickness ratio is increased to 18% (as sometimes used in the wing-root sections of big but low-speed airplanes) and above that ratio, the maxi­mum lift coefficient reduces gradually. By employing pro­portionately higher camber ratios, it is possible, however, to keep the CLX at 1.4. Their stalling characteristics are very gentle. Unfortunately, however, thick and highly cambered sections are not suitable for high-speed applica­tions due to their low critical Mach number. Also they have correspondingly high pitching moments, which tend to be too large with regard to structural strength and rigidity (torsion).

High-Speed Airfoil Sections. It has previously been stated that the position of the maximum camber point is not very important with regard to maximum lift, at least not between 30 and 50% of the chord. In contrast, position of maximum thickness has some influence, particularly when a nose radius change is coupled with that position. This is usually the case with laminar-type airfoil sections and/or in sections particularly designed for high-speed applica­tions (at higher subsonic Mach numbers). In particular, the NACA 63 and 64 series sections (11) have ratios (r/t)/(t/c) = 0.75 and = 0.72, respectively, while the 4-digit (and similar lower-speed sections) have a radius parameter of 1.10. When evaluating maximum lift of the 63 and 64 series sections, the complication of effective camber is encountered again. Results taken from (11) have been transformed (using equation 7) and inter­polated where necessary, so that they represent sectional conditions (24) as in wings with A between 5 and 6.

MAXIMUM LIFT AS A FUNCTION OF SHAPE AND REYNOLDS NUMBER

Figure 24. Maximum lift coefficient of 63 and 64 series airfoils as tested (11) at Rl = 6(10) , as a function of their thickness ratio, grouped as to their camber ratio effective for A between 5 and 6 (see equation 7).

(24) The difference in effective camber (between 2-di­mensional tunnel and an airplane wing having an aspect ration of, say 6,) is considerable at lift coefficients above unity. Characteristics at small lift coefficients are affected to a much lesser degree.
MAXIMUM LIFT AS A FUNCTION OF SHAPE AND REYNOLDS NUMBERПодпись:Подпись: Figure 25. a) Maximum lift coefficient of 63 and 64 series airfoils as tested (12) at Rc = 6(10)fo, as a function of their camber ratio effective for wings with A between 5 and 6 (see equation 7).MAXIMUM LIFT AS A FUNCTION OF SHAPE AND REYNOLDS NUMBERIn conclusion, comparison on the basis of nose radius ratio r/c (rather than thickness ratio) would bring about a more favorable correlation between the two major types of airfoil sections. Characteristics of 12% thick symmetri­cal sections are included in figure 9, accordingly. At the lower end of the nose-radius scale, we recognize the effect of the critical change (transition) within the boundary – layer flow around the section nose. Stalling of these high-speed sections is comparatively sudden sometimes showing large hysteresis loops. Of course, the drop of the lift coefficient is aggravated by the fact that the sections in figure 9 are all without camber (geometrically, that is).

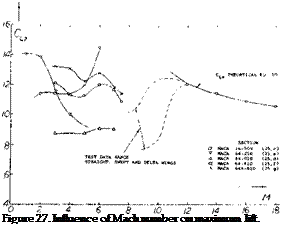
Mach Number Effects on CLX. The operating Mach num­ber has a large influence on the maximum lift coefficient of an airfoil. The change in CLy is caused by the forma­tion of shock waves in those regions on the airfoil where the local Mach number exceeds 1.0. The shock wave pattern formed depends on the boundary layer type. As the pressure increases on passing through the shock wave, the lift on the suction side of the airfoil is reduced and a reduction of CLx is encountered.

Two regions are important with regard to the formation of the shock waves:

(1) the area around the nose of the airfoil and

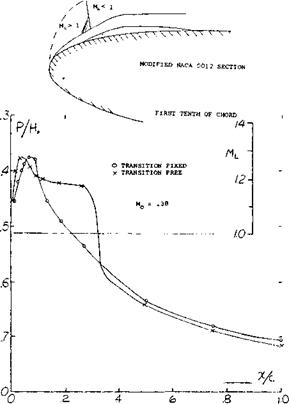
(2) the area toward the trailing edge on the suction side. On blunt nose airfoils operating at high lift coefficients the local Mach number of 1 can be exceeded at free stream as low as Mc = .25 (25,a). On the first tenth of the chord on blunt airfoils standing shock waves are formed similar to the more well known shocks on the aft section of the aifoil, except their size is an order of magnitude less. The familiar lambda type shock with a weak forward shock and pressure plateau as illustrated in figure 26 is formed with a laminar boundary layer. With a turbulent boundary layer the single shock with a strong pressure rise and an expanding bubble is formed at the nose (25,b). These shock waves interact with the boundary layer caus­ing separation and a reduction of CLX as illustrated in figure (27).

(25) Mach Number Effects on Max. Lift.

a) Fitzpatrick, & Schneider, NACA TN2753.

b) Aerodynamics Dept. Annual Report 1971, RAE TR

72073.

c) Cleary, Complete Wings, NACA WR L-514.

d) Wilson & Horton, NACA RM L-53C20.

e) Racisz, S., NACA TN 2824.

0 Stivers, L., NACA TN 3162.

g) Summers, J. L., NACA TN 2096.

h) Hicks, et al, Forward contour modes 64-212 foil NASA

TM-3293

i) Hicks & Schairer Upper surfaces modes 63-215, NASA

TM-78503

j) Hicks, Mods to an NACA 65 – (.82) .099) airfoil, NASA

TM-85855
MAXIMUM LIFT AS A FUNCTION OF SHAPE AND REYNOLDS NUMBER

Подпись: Figure 27. Influence of Mach number on maximum lift.

Подпись:Figure 26. Pressure and local Mach number distribution at maxi­mum lift (25,b).

The variation of CLX with Mach number with the NACA 64-210, 64-410, 64A-610 airfoils are examples where sep­aration due to leading edge shock wave reduces lift, figure 27. With an airfoil such as the NACA 64-010 where leading edge separation already takes place the formation of a shock would not influence the variation of C LX with Mach number.

At Mach numbers in the transonic range the is

influenced by the formation of shock waves at speeds above the critical. After reaching a minimum, C Lx will increase and approach the theoretical value shown on figure 27 which is described by the equation at M > 1.0

CLX = -5Ps – Pe 00)

where p9 is the stagnation point pressure and pp is the rear surface pressure corresponding to vacuum.

The negative peak pressure toward the leading edge of the airfoil leading to the lambda type shock wave and lift stall shown in figure 26 can be eliminated at the lower Mach numbers by recontouring the upper surface as indicated on figure 26a. This change (25,h, i,j) reduced the local Mach number below one thus eliminating separation with the result that the airfoil can operate at a much higher angle of attack and before stall occurs. This char­acteristic is shown on figure 26a and shows a large in­crease of CLfrom 1.33 to 1.6 and a stall angle increase from 10 to 15 for a NACA 65-(.82 .099) airfoil, (25 j).

REVISED CONTOUR

MAXIMUM LIFT AS A FUNCTION OF SHAPE AND REYNOLDS NUMBER

Figure 26a. Lift of an airfoil modified to eliminate shock stall relative to standard. NACA 65 (.82)( 099) airfoil.

(26) Structural roughness (imperfections):

a) Jacobs, Protuberances, NACA T Rpt 446 (1933).

b) Hood, Surface Irregularities, TN 695 (1939).

c) Wood, Corrugated Surface, NACA Rpt 336 (1929).

d) See Also references under (27).

(27) Characteristics of practical-construction airfoils:

a) Tetervin, Helicopter Blades, NACA W Rpt L-643 (1944).

b) Doetsch, Waviness on 23012, Ybk D Lufo 1939 p. 1-88.

c) NACA, TN 428 (fabric-covered), 457 (irregularities), 461 (rivet heads), 724 (rib stitching).

d) Quinn, Practical Construction, NACA T Rpt 910.

CORRELATION PROCEDURES OF TEST DATA

From the discussion of the types and mechanism of stall­ing it is apparent that it is a separation phenomenon within the boundary layer, and thus the airfoil shape and operating Reynolds will have a large influence on the results. Because of this the test conditions, including tun­nel turbulence, also affect the results. Since we are inter­ested in the application of airfoils in free air conditions, the consideration of wind tunnel turbulence must be made before satisfactory results concerning shape and R’number can be presented. It will then be possible to correlate the results between various tunnels and will provide a reliable basis for comparisons with any newly developed theories.

Also important in the application of wind tunnel test results are the test conditions with regard to wall location if the test section is open or closed jet. Airfoils tested between walls will give two-dimensional results that must be corrected for application to a three dimensional wing. The use and correlation of such data requires that the airfoil has been tested with ends sealed as this can influ­ence the results, especially with regard to CLX • Data published before 1950 were often influenced by end leak­age problems, and caution must be exercised in their use.

(6) Maximum lift of sharp-edged sections:

a) Thin Plates and Circular Arcs, Erg TV AVA Got­tingen.

b) Doetsch. Modified Biconvex, Ybk D Lufo 1940 p. 1,54.

c) Circular-Arc Foil Sections, Bull Serv Tech Aeron (Bel­gium) 15 (1935).

d) Williams, Circular-Back Foils, ARC RM 2301 (1946).

e) See also references under (35).

f) Williams, 5% Biconvex in CAT, ARC RM 2413 (1950).

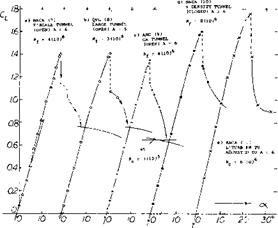
Wind Tunnel Test Conditions. Stream turbulence, found in many wind tunnels, considerably increases the Ci_x of most of the commonly used sections. This type of turbu­lence can be of practical interest, such as the case of propeller slipstream effects on a wing. Figure 7 presents the maximum lift coefficient of a given airfoil section as tested in several wind tunnels having different degrees of stream turbulence. Turbulence evidently affects the transi­tion of the boundary layer from laminar to turbulent flow so that the bubble bursting previously described is post­poned to higher lift coefficients. In this manner, turbu – [42] [43] [44] [45] [46]

CORRELATION PROCEDURES OF TEST DATA

Figure 7. Lift function of 23012 airfoils as tested in wind tunnels differing in Reynolds number, degree of stream turbulence and stream deflection. Comparison in different tunnels:

a) FST and DVL, same type tunnels, same result, including re­duced L’curve slope to Cu = 0.4 or 0.5 (must have b’layer reason).

b) Turbulent VDT does not show variation of L’curve slope; Ct_x = increased because of turbulence; but type of stall preserved. For same R’number = 8(10)6 , the Low-Turbulence Pressure Tunnel (38) indicates CL>c = 1.79, caused by effective camber.

c) In the 2-dimensional Low-Turbulence Tunnel, Cuy s increased to a lesser degree by R’number (CL* is tested in that tunnel as 1.61, at 3(10)* ). Effective camber (as against A = 6) is 3.3(1.61) = 5.5%. Figure 14 suggests a corresponding maximum increase Cux = 0.15.

lence does something which is otherwise only obtained by increasing the Reynolds number. Consequently, a method for correlating wind tunnel data with free stream condi­tions has been proposed (12,a). This method consists of multiplying the actual Vc/r by a so-called turbulence factor “f”, in order to obtain the effective number R^. = “f ’ Rc. The turbulence factor suggested to be used is

“f’ = (10) /Rcrit where 4, and (3)

where Rcnf = Reynolds number of a sphere used to calibrate the particular wind tunnel, at the speed where the drag coefficient of that sphere passes through the point where either CD = 0.3, or where the pressure at the rear side of the sphere (12,b) is equal to the ambient pressure in the test section of the tunnel. The most turbulent tunnel is the NACA’s Variable Density Tunnel (13) where “f” ~ 2.7 (in its rebuilt condition, since 1929, see NACA TR 416), corresponding to root-mean square velocity fluctuations in the order of 2% of the tunnel

( 9) Airfoil sections teased by British ARC:

a) Jones, 0015 and 0030 in CAT, RM 2584 (1952).

b) Hilton, 18 Sections High Speed, RM 2058 (1942).

c) Williams, Strut Sections, RM 2457 (1951).

d) See also references (5) (28,c) (40,b), (7,c), Chapter II.

e) ARC, Investigations in the Compressed Air Tunnel, RM 1627 (R’number), 1635 (RAF-34), 1717 (RAF – 69+89), 1771 (Airscrew sections), 1772 (RAF-34), 1870 (Joukowsky), 1898 (23012), 2151 (23012 wing), 2301 (circular-arc backs), 2584 (0015 + 0030).

(10) Investigations and results on 23012 airfoils:

a) Jacobs, in FS and V’Density Tunnels, Rpt 530 (1935).

b) Jacobs, in V’Density Tunnel, NACA T Rpt 537 (1935).

c) Jacobs, Airfoil Series in VDT, NACA Rpt 610 (1937).

d) NACA, with Flaps, Rpt 534 (1935) & 664 (1939).

e) ARC, In CAT, RM 1898 (1937); also RM 2151 (1945).

0 Doetsch, In DVL Tunnel, Ybk D Lufo 1939 p. 1-88.

g) The foil section 23012 (figure 7) is outstanding in regard to maximum lift (see figure 19). The tested CLL corresponds to that of other sections having 4% camber, while 23012 has only 1.8%. The pitching moment co­efficient due to camber is but – 0.01, which is ^1/5 of that of the corresponding conventionally cambered sec­tion. Unfortunately, 23012 is not considered to be de­sirable at higher speeds.

(11) Foil sections tested in two dimensions by NACA:

a) Doenhoff, Low-Turbulence Pressure Tunnel, T Rpt 1283.

b) Abbott & von Downhoff, Collection of Data, T Rpt 824. (1945); also “Wing-Section Theory”, McGraw Hill 1949.

c) Loftin, At Very High R’Numbers, TN 1945 (1949) & Rpt 964 (1950); also RM L8L09 with results on 34 sections.

d) See also reference (37,b).

e) Loftin, 64-010 modified, TN 3244 (1954).

0 McCullough, 0006/7/8 in Ames Tunnel, TN 3524 (1955).

g) NACA, 64-xlO sections, TN 2753, 2824, 1945, 3871;

T Rpt 824, 903.

speed. Modern tunnels such as the NACA’s special low – turbulence tunnels (having fluctuations below 0.1%) would have factors only slightly above unity. Although there are strong reservations against using the Turbulence factor, the following values are for a number of the more important wind tunnels:

wind tunnel

type

stream V, dim. ft ft/sec

c,

ft

Rc

“f

NACA, VDT (*)

closed 5 ft <(

75

0.4

3 (10)

2.7

Full-Scale Tunnel

open

30×60 100

6.0

4(10)

1.1

Low T Pressure TDT

closed 3×7.5

250

2.0

6(10)

1.0

AVA, 2.25 m Diameter open

7.4 ф

30

0.7

4(10)

1.2

DVL, “Large” Tunnel

open

16×23

130

2.6

3(10)

1.1

ARC-NPLCAT (*)

open

6ftjrt

80

0.7

4(10)

2.1

(*) variable-density or compressed-air tunnels

with up to 10 and 25 at as operating pressure.

The airfoil chords, speeds and Reynolds numbers listed indicate typical, or possible, testing conditions in each tunnel.

Variation of “f”. Stream turbulence most certainly helps the flow pattern past typical airfoil sections to get quali­tatively above the critical phase (to be discussed later) between Rc = (1 and 2)105 . However, any quantitative agreement of CLX values thus obtained (7,a) (10,a) (12,a) only applies to a particular group of foil sections (of the sharp edge bursting-bubble type of stalling). Comparison of VDT results of sections such as the 0006 to 0015, 2412, 23012, 4412 to 21, Clark Y and RAF-34 with maximum lift coefficients obtained in low-turbulence tun­nels, extrapolated to zero turbulence, suggests “f” factors between 2.8 and 3.4 for that particular tunnel (rather than 2.7 as recommended). The factor does net “work”, on the other hand, for cambered and thicker sections (with typical trailing-edge type stalling) such as Go 387, 23015, 2415 to 21. In other words, the factor is not uniform. In its form as per equation (3) it only represents the degree of turbulence. A really reliable correction fac­tor should also take into account the specific influence of [47] the turbulence on the individual section shape. Since the critical Reynolds number of the sphere reduces as the tunnel speed is reduced (see Chapter X of “Fluid-Dynamic Drag”), it must also be suspected that the turbulence factor (in constant-pressure tunnels) varies approximately as

“f’~ 1/Vr (4)

where n ^ 4 in the carefully designed tunnels, n ^ 3 in average-quality test streams, and n ^ 2 in very turbulent conditions (14). This influence of speed can be consider­able when investigating one and the same airfoil section at different Reynolds numbers, obtained by varying the tun­nel speed.

Low-Turbulence Tunnels. It is reported in (12,e) that the turbulent fluctuations in the TDT facility increase with the operating speed from 0.02 to 0.15%. This variation is opposite to that indicated by equation (4). It seems that the source of turbulence in this elaborately designed tun­nel is acoustic (from the fan; power and blade frequency of which increase with speed). It is also mentioned in (12,e) that turbulence reduces as the operating pressure is increased. In terms of the Reynolds number, this trend is again opposite to that in other tunnels where the Rey­nolds number is varied by means of tunnel speed. In conclusion, tunnels built to a low turbulence level do not seem to follow equation (4). After all this introduction, it certainly must be clear that a realistic presentation of CLX values as a function of effective Reynolds number is problematic. We have applied turbulence factors similar to those listed above to the graphs of this text wherever this seemed to improve correlation of results from different sources. Regarding the variation of “f ’ with speed (equa­tion 4), factors different from (that is, larger than) the “standard” values have only been used wherever this seemed to eliminate obvious discrepancies. All this is somewhat arbitrary. It is believed, however, that the CLx functions thus obtained are more realistic than those presented to date in any other place.

Tunnel Corrections. The dimensions of the wind stream provided in wind tunnels are limited by reasons of econo­my (size and power of the installations). Corrections for the limited diameter of an open jet or the restraining walls in closed-type test sections have routinely been applied before presenting the lift and drag results. Since this is not a text on testing techniques, we will not go into the details of such corrections. There is one aspect, however, for which there is usually no correction applied; and that is the curvature (in contradistinction to deflection) of the stream of air passing through the tunnel. This curvature is caused by the interaction of the lift of the airfoil model

tested with the boundaries or walls of the test section. For wings of aspect ratios of 5 or 6, this effect causes a change in the effective camber ratio (discussed below) on the order of

Д (f/c)T = – 0.2% CL (5)

where the + sign is for closed, and the — sign for open tunnel test operations. For example, for Cux = 1.5, the difference is A(f/c) = – 0.3%. No direct attempt has been made, however, in the graphs presented later, to correct for this effect.

Effective Camber in Wind Tunnels. In wings of finite aspect ratio, the flow past the sections is deflected in the longitudinal direction, corresponding to the induced angle of attack. In comparison with two-dimensional condi­tions, the leading edge of a wing is, therefore, at a higher local angle of attack than the trailing edge, by the: value of ocL This effectively reduces the amount of camber of the airfoil as installed on the three dimensional wing. In terms of effective section camber, the difference may th en be

Д (f/c)% = -25 ocL = -2.5 CL /тґ A (6)

For example, at an aspect ratio A = 6, the difference is —1.3% CL, which is in the order of —2% at CLx • When testing such an airfoil in an open-throat wind tunnel flow conditions are also affected, as indicated by equation (5). On the other hand, when investigating an airfoil model in a two-dimensional closed-type wind tunnel, final down – wash is prevented. The floor of the tunnel produces an effect similar to the “ground” discussed in the Chapter III, and the ceiling of the test section doubles that effect. Conditions in the NACA’s two-dimensional tunnels (11) appears to increase effective camber of foil sections in comparison with those of airfoils in free flow. For aspect ratios between 5 and 6, the camber change is

(f/c)%~(1.4 + 0.2)CL = 1.6% C L (7)

where the second term indicates the wall effect similar to equation (5). For a value of CL* = 1.3, a difference in effective camber on the order of 2% (1) is thus found between tunnel and free flight. This conclusion is sub­stantiated by comparing maximum lift coefficients ob­tained at the same effective Reynolds number: (a) in the Low-Turbulence Pressure Tunnel (11), and (b) on finite – span wings having the same foil sections tested in the same tunnel (ll, b), or in different tunnels (7) (10). One exam­ple (15) is included in figure 7. Since airfoil sections are “always” used in three-dimensional devices (such as wings in particular), two-dimensional results obtained from test­ing airfoils between the walls in closed-type test: sections do not appear to be realistic. We have, therefore, primarily evaluated test data for airfoils on wings having finite aspect ratios of 5 or 6. However, quite a number of test points from (11), corrected (that is, increased) in effective camber to free flight conditions of an airplane wing by adding camber as per equation (7), have been included in the various graphs. All such results were evaluated for, and are classified by, their effective camber ratio.

Aspect Ratio. It is repeated at this point that all maxi­mum lift coefficients presented in the various graphs (un­less otherwise noted) are those, or are meant to represent those, of rectangular wings of aspect ratio between 5 and 6 (rather than of airfoil sections). Using equation (6), it can be estimated that the maximum lift coefficient of the wing sections represented in figure 14 varies as a function of the effective camber ratio, roughly corresponding to

d(ACLX )/d(l/A)~ —0.5 (8)

The difference between a wing with A = 5 in free flow, and a foil section in two-dimensional tunnel flow, is then Clx ~ —0.05. That is, the Clx of an airfoil with A = 5 or 6 is less than that of the foil section in a two-dimen­sional stream. By that amount on the other hand, see (15).

THE PHYSICAL MECHANISM OF STALLING

The stall of an airfoil depends on the section shape, thickness ratio and the operating Reynolds number. The flow along the pressure side of the airfoil section is of little importance with regard to maximum lift. On the other hand, as the angle of attack is increased the flow past the suction side develops:

a) A negative peak in the pressure distribution at or near the leading edge

b) A strong positive pressure gradient between the negative pressure peak and the trailing edge

c) A growth of the boundary layer thickness along the chord.

THE PHYSICAL MECHANISM OF STALLING

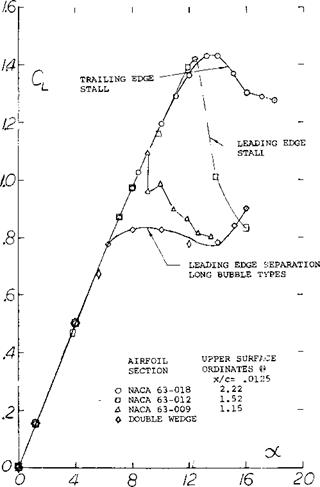
Figure 2. Types of airfoil stall Reynolds number 5.8(10)^, TN 2502.

With an increasing angle of attack of the section the flow on the suction side of the airfoil develops two weak spots where boundary layer separation is to be expected:

1) At the leading edge where the flow must go around the nose section with a corresponding loss of mo­mentum

2) Near the trailing edge where an increase in the boundary layer thickness takes place.

Stalling (loss of lift due to flow separation) will originate in one of the two locations, or in both concurrently.

Types of Lift Stall The lift stall encountered by an airfoil as a result of separation has been classified into three different types:

1) Leading Edge Separation — Long Bubble Type. This is a gradual stalling of thin sections from a more or less sharp edge by way of a laminar separation bubble and reattachment.

2) Leading Edge Separation — Short Bubble Type. Sudden stall is encountered with round nose zero or low camber sections with so-called bubble bursting.

3) Trailing Edge Separation. Gentle stalling from sepa­ration at the trail edge is experienced with this type. As the stall increases the separation progresses for­ward from the trail edge.

Each of the above types of stall has a distinct behavior as characterized by the variation of lift as a function of angle of attack, figure 2.

The lift characteristics of a double wedge section, figure 2, illustrates leading edge stall of the long bubble type. Here the variation of lift with a is linear nearly to the maxi­mum and then rounds and continues flat. When lead edge separation of the short bubble type is encountered the lift remains linear to the stall and then drops suddenly as illustrated by the NACA 63-009 section, figure 2. Trailing edge separation is encountered typically with thicker, more rounded nose airfoils, such as the NACA 633 -018 type also shown on figure 2.

Thin (Sharp) Leading Edge. The reason for the leading edge separation of the long bubble type is explained by considering the pressure distribution for the wedge section operating at oc = 6 , figure 3. The flow does get around its sharp leading edge up to angles of attack for a lift coefficient in the order of CL = 0.7. The mechanism through which this is possible, is as follows: Corre­sponding to the small distance between stagnation point (at the lower side) and leading edge, the boundary layer arriving at that edge, is very thin. The Reynolds number of the flow at the leading edge is also very small. Taking into account the strong negative pressure gradient be­tween stagnation point (where Cp = +1) and the leading edge (where C p possibly = —10) the boundary layer flow

must certainly be assumed to be laminar; and since it is laminar, the flow “around” a sharp leading edge must be expected to separate “immediately”. As confirmed by several special investigations (2), laminar separation does take place. However, after separating, the inside surface of the fluid forming the contour of the separated space, turns turbulent. As shown in figure 3, the boundary layer (the sheet of air adjacent to the bubble) then expands in volume because of mixing with the “dead” material in the separated space, thus reducing the size of that space, until the outer flow (including the now thickened boundary layer) re-attaches itself to the upper surface of the plate at some distance behind the leading edge. The presence of the separated space is recognized (as in figure 3) in the pressure distribution showing a constant negative pressure region, where without the “bubble” a pronounced peak should be. The peak is thus cut off by separation, al­though some of its lift is added further downstream.

Boundary Layer Transition. At higher Reynolds numbers (above 2 or 3 times 10Б ) it can be assumed that laminar separation and the formation of the bubble are reduced, and that re-attachment of the flow is facilitated by cam­ber and thickness (nose radius). The whole bubble mecha­nism still persists, however, at least under certain condi­tions, in round-nose sections, although the size and de­velopment of the separation bubble may be very limited, and as a consequence the magnitude of the Clx is differ­ent. For example, in the 64A010 section reported m (2,b) the chordwise dimension of the bubble is but 0.5% of the chord at Cl = 1.0. For practical purposes, the sequence of such minimal separation plus “immediate ’ re-at­tachment, obtained within the first 1% of the chord, simply constitutes the transition of the boundary layer from the laminar to the turbulent type of flow. Such transition is susceptible to stream turbulence (as ir certain wind tunnels) and to variations of the Reynolds number (3). The maximum lift coefficient increases, therefore, due to turbulence as well as to increasing the Reynolds number. Airfoil sections of this type are very numerous. Among them are the symmetrical NACA 0012 r. o 0021 shapes, and most of the sections with modest thickness and camber dimensions such as the NACA 2409, 23012, and 64-212.

Bubble Bursting. Leading edge separation of th e short bubble type is encountered when the angle of attack of a section is further increased without a further growth of the separation bubble in fact, as documented in(2,b, c,d), the length of the very small bubble (found at higher Reynolds numbers) reduces as the angle of attack is in­creased. In this condition, the lift continues to grow, essentially along a straight line versus the angle of attack, with hardly any losses. Figure 2 demonstrates this type of lift function very well for the NACA 63-009 airfoil sec­tion. However, without any warning, upon reaching a critical condition in which the bubble is strained too much, “complete” separation takes place from near the leading edge. As noted in (2,a) the bubble thus “bursts” into separation (re-attachment fails suddenly). The lift coefficient drops at the same instant, from a maximum to a level which seems to be of the same type as in л stalled thin airfoil section.

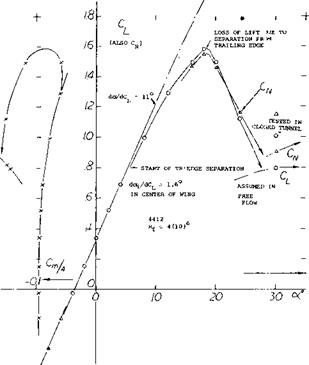
Trail Edge Stalling. After eliminating (by using a round nose, increased thickness and/or camber) the flow near the leading edge as the weakest part of the circulating motion of the fluid, another weak region soon develops near the trailing edge. For example, consider the pressure distribution of a 4% cambered airfoil section shown in figure 5,a. On the suction side, three pressure distributions are superimposed:

(a) a component due to thickness

(b) a distribution representing lift due to camber

(c) a peaked contribution due to flow around the nose

THE PHYSICAL MECHANISM OF STALLING

Figure 5. Lifting characteristics of a 4412 section tested (4,e) (5) on the center line of an A = 6 airfoil in the VDT tunnel at Rf = 4(10)fc.

a) pressure distribution at an angle of attack slightly beyond that for Cux •

THE PHYSICAL MECHANISM OF STALLING

(3) Regarding the strong effect of transition and/or R’num – ber upon the elimination of laminar-type separation, the mechanism of the drag of spheres may be consulted as described (for example) in Chapter III of “Fluid – Dynamic Drag”.

Evaluation of (5,b) roughly yields the ratio of the maxi­mum local velocity “w”, at the nose of average sym­metrical foil sections:

w/V»l + 2 t/c + 0.2 Cl/(r/t) (1)

where r/t, the ratio of lead edge radius to thickness, may be between (0.5 and 2.0) t/c. Maximum speed w, maxi­mum dynamic pressure q and the minimum pressure co­efficient can be estimated using this equation. Both items

(a) and (b) above produce a positive pressure gradient approaching the trailing edge. Under the influence: of this gradient, the boundary layer grows considerably; and at the trailing edge will have a total thickness <5 which can roughly be described by

S/c = 5C. f +k(CL)n (2)

where Cf = skin friction drag coefficient, n possibly = 2, к in the order of 10, and Cf = 0.03, depending on the thickness and shape of the section used. After growing so much, the boundary layer reaches a critical condition (where it cannot keep moving against the pressure) so that a gradual accumulation of boundary layer material and a corresponding separation of the outer flow from the sur­face of the foil section take place. The circulation then stops growing with the angle of attack; the lift reaches a maximum.

THE PHYSICAL MECHANISM OF STALLING

Figure 5. b) Сц (and CN) integrated from pressure distributions on center line of A = 6 airfoil.

As shown in Figure 5,b, the NACA 4412 airfoil displays a rounding-over lift function. Thus, before reaching its maximum, the lift coefficient diverges from the straight line indicating the beginning of flow separation from the trailing edge. Upon increasing the angle of attack beyond that for Clx, the lift decreases gradually (and without discontinuity) eventually reducing (at very high angles of attack) to a level or a function corresponding to “full” separation. It should be emphasized that separation in sections of this kind, proceeds from the trailing edge toward the leading edge; and that stalling from the leading edge is only obtained at the very high angles mentioned.

THE PHYSICAL MECHANISM OF STALLING

Ш at 1q5 laminar separation

THE PHYSICAL MECHANISM OF STALLING

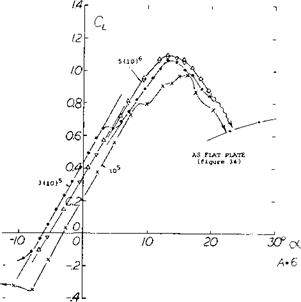
Figure 6. Lift characteristics and mechanism of stalling of a 10% circular-arc section as tested (6,d) at three different Reynolds numbers, in the British Compressed Air Tunnel (A = 6).

Circular Arc Sections. The mechanism and details of trail – ing-edge stalling have not been studied as much as lead­ing-edge stalling. Some further insight can be gained, how­ever, by considering the data for the circular-arc section shown in figure 6. The well-defined characteristics of essentially sharp-edged plates change to a degree as a sufficient amount of thickness is added, particularly in the form of an arched “back”. Keeping the lower side flat, their camber ratio is equal to lA the thickness ratio. With maximum thickness located at 50% of the chord such sections have a considerable trailing edge “wedge” angle “at” the suction side, easily leading to separation from that edge. In other words, thickness, camber and the location of these two at 50% of the chord, combine to make the flow along the suction side comparatively sensi­tive and weak as it approaches the trailing edge. Specific characteristics of the circular arc section of figure 6 are as follows:

5

(a) At a Reynolds number of but 10 (in the compara­tively turbulent CA’tunnel) laminar-type separation seems to take place from the minimum-pressure point at or somewhat ahead of the 50% chord point. At this condi­tion the minimum drag coefficient is 0.02, confirming separation.

(b) At Rc = 3 (10)[39] and the angle for minimum drag the lift coefficient is 0.575, which is equal to the potential flow theory Ci_ syrr>= 0.575, as in figure 27, of Chapter II, for f/c = 0.5. The drag coefficient (Cos = 0.008 = minimum) obviously confirms that the flow is fully at­tached and we have the condition of symmetrical flow.

(c) Upon increasing the Reynolds number above 3 (10/ , the lift coefficient for minimum drag reduces slowly; and becomes CL0 = 0.46 at 5(10)^ . An increase of skin friction more turbulent along the upper side of the section (CDS = 0.009) is evidently responsible for reduced boun­dary-layer momentum approaching the trailing edge. As a consequence, pressure recovery is somewhat deficient, and circulation and lift are somewhat reduced.

Zero-Lift Angle of Attack. The lift-curve slopes shown in figure 6 are practically the same at all three Reynolds numbers considered. However, the zero-lift angle of attack varies from —3° at a Reynolds number of 105, up to a maximum of —60° at RN = 3 x 10⁵, and slowly down again to —5 at RN = 5(10) . This variation of the zero lift angle corresponds to that of the skin-friction drag coefficient, down from the laminarly separated value at 10 5 , to a minimum part laminar and part turbulent value in the vicinity of 3(10)5, and somewhat up again to a mostly turbulent level at 5(10)5 . We can also make the prediction that skin friction would decrease again, and that lift would increase again, upon increasing Reynolds number above about 10[40] , provided that neither surface roughness nor compressibility would interfere. It should be noted that all these variations are a consequence of beginning trailing edge stalling. The report (6,d) from which the results in figure 6 are taken, also contains data on circular-arc sections with different thickness ratios (while f/c always = 0.5 t/c). Sections with ratios t/c = 15 and 20% show the variations as discussed above in strong­er form, while a 5% section does not show much of a variation at all.

!

c4) Airfoil sections as a function of R’number:

a) Jacobs, In VDT, NACA T Rpt 586 (1937).

b) Relf, In the British CAT, ARC RM 1706 (1936».

c) See references (7,a) (11 ,c).

d) Jacobs, Thick Sections in VDT, T Rpt 391 (1931).

e) Pinkerton, 4412 Pressure Distribution, NACA TR 613

(1938).

0 AVA Gottingen, Ergebnisse III (1920) p. 58.

a) Pinkerton, 4412 Distribution, NACA T Rpt 612.

b) Kochanowsky, Theoretical, Ybk I) Lufo 1940 p.

1-72.

c) Schrank, Collection of Data, Ringbuch Luft Tech,

Rpt IA11 (1938).

Rounding of Leading Edge. The report (6,d) also gives an explanation for the fact that sharp-edged circular arc sections (as frequently used in marine propellers) do have the same efficiency as similar sections with rounded noses where, and if, used at lift coefficients close to Clsy/ti – However, when using the section of figure 6, at a lift coefficient of 1.0, the section-drag coefficient, of a suit­ability rounded foil shape (with r/c between 1 and 2%) is but half (CD5 ^ 0.017) of that of the original sharp – edged section (Cqs = 0.038) at Rc = 4 (10)[41] . Rounding also has an effect upon the maximum lift coefficient of the sections tested at Reynolds numbers above (2 or 3) 10 . When rounded, the 10% section (as in figure 6) thus exhibits a maximum CLy. = 1.55, at R = 4 (10)6 , rather than ^ 1.10 as at lesser Reynolds numbers, or as in the original condition (with sharp leading edge).

THEORETICAL AND DEMONSTRATED LEVELS OF MAXIMUM LIFT

An overview of the theoretical values of maximum lift compared to demonstrated levels is desirable before examining the detailed maximum lift characteristics of single element airfoils and wings.

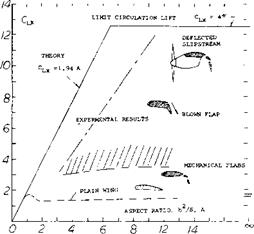
Theoretical Maximum Lift Coefficient CiX. Theory (1) shows that CLX = 1.94A but can be no greater than 4nr. Thus the Clx of a two-dimensional wing is 4rf. The maximum lift is set by the physical ability of the airfoil to produce circulation. With actual wings and the use of high lift devices the maximum lift coefficient achieved is much less than the theoretical maximum. As shown on figure 1 the maximum lift coefficient demonstrated for a single element airfoil is only 1.5 to 1.6, or 10% of the value theoretically possible. Even with flaps, slats and blowing the demonstrated level of CLy (figure 1) is only approxi­mately 30% of the ideal. The addition of forced circula­tion brings the demonstrated level of Clx reasonably near

direct thrust

THEORETICAL AND DEMONSTRATED LEVELS OF MAXIMUM LIFT

Figure 1. Potential maximum lift as a function of aspect ratio- demonstrated and theoretical.

(1) Maximum Lift

a) Cone, D. D. Theory NASA TN D-657

the ideal. In this case, however, power is required which could have been used directly to supply lift! Basec. on the large spread between the theoretical value and the actual demonstrated values of maximum lift, especially in the case of single element airfoils, it would appear that there is considerable room for improvements of this type.

CHAPTER IV — MAXIMUM LIFT & STALLING

The wing area required for a given application is in­fluenced largely by the maximum lift and stalling char­acteristics of the airfoil sections used. Because of the possibility of mishaps in the event of stalling, the factors effecting the maximum lift and stall of wings arc of great importance. The stalling characteristics of airfoils also affects the design of helicopter rotors as well as other types of propulsive devices.

The maximum lift of a wing is defined as that value obtained when a further increase in the section angle of attack gives zero or a negative increase of lift. An airfoil can have two or more values of maximum lift but general­ly only the first is of importance. A wing is said to stall when as a result of a further increase of the angle of attack there is a loss of lift.

The maximum lift of a wing depends on parameters such

as:

• Airfoil section shape

• Operating conditions such as Mach number ;md Rey­nolds number

• Wing planform, and twist

• Auxiliary devices such as flaps, slots, etc.

• Influence of the fuselage and propulsion system

• The type of application; that is, fixed wings, helicopter rotors, etc.

The absolute magnitude of maximum lift in the case of – res is generally not as important as the type of stall •intered. A wing with very high maximum lift can. W – vhptly, losing a major portion of its lift fee: a small ;e in angle of attack above stall with dangerous ‘іГ mences. Such a wing would not be as useful for “Tr‘ w – a wing, having a lower C^* with a more gentle 1 b – s maximum lift and stalling are of primary im – Pwe in the application of wings and airfoils. In this chupwr only the characteristics of straight wings and swuie cement airfoils will be covered in detail; items such as nau. slats, sweep and low aspect ratio wings and their mimenw w maximum lift will be discussed in chapters V,

VI ana XVI.

WINGS WITH END PLATES

End plates have found little application on airplane wings until recently when the winglet and/or tip sails have been applied to reduce the induced drag, the drag due to lift. As the induced drag of a wing is a large part of the total a device that can reduce this component is of importance. In considering such devices the im­provement obtained must be weighed against that possible with an increase in the wing aspect ratio. With the available theoretical and experimental data the relative merits of wing and plates, winglets and similar devices can be found. The theoretical and experimen­tal characteristics of the various types of end plates are presented as follows.

BASIC PRINCIPLES. The objective of adding wing end plates is to control the flow at the wing tip and to reduce the induced angle of attack and thus the induced drag. In some ways this is analogous to the operation of a wing between the walls in a wind tunnel and thus eliminating the three dimensional effects leading to the induced drag loss. Thus the addition of end plates would be in the limit a wing with the drag characteristics of a two dimensional section, an in­finite aspect ratio wing. In any case when adding a pair of end plates, figure 14, the effective span is increased. Theory (17) considers a lifting line with an elliptical loading which is bent up at both ends. The results of this can be approximated in terms of an effective aspect ratio Ai = A – f aA, where

ДА/A ~ kh/b (16)

Figure 14 shows that this equation is confirmed, using к = 1.9, up to h/b = 0.4. Note that this type of effec­tive A’ratio can be used both to calculate induced drag or the lift-curve slope. With the data given on figure 14 it does not matter whether the plates are attached nearer to the leading or trailing edge of the wing. Note that the effect of end plates is also obtained in swept wings (18,e) and essentially to the same degree as straight wings.

1

h

POINTS AS IN

I "FLUID-DYNAMIC DRAG"

WINGS WITH END PLATES

WINGS WITH END PLATESWINGS WITH AND WITHOUT END PLATES. The characteristics of wings with end plates and the wing with the plates used to extend the wing and so increase its aspect ratio is given on figure 15. As shown in figure 15,В DRAG, the drag of the wing with the end plates is less than the wing without them only above C^= .3. This is evidently a major reason for the fact that end plates are not usually applied in the design of airplanes. Aerodynamically, it is much more pro­fitable to add end plates to the wing span thus gaining aspect ratio as well as lift-producing area. To demonstrate this point, we have analytically determined the CyCL) function for the enlarged wing as shown on figure 15. Based on the original area of the wing, we then find a reduction of the drag/lift ratio, for exam­ple at CL= 0.9, as against the original plane wing, twice as large as that obtained by means of the end plates. Below that lift coefficient, the wing with the enlarged span is clearly superior to the wing with end plates.
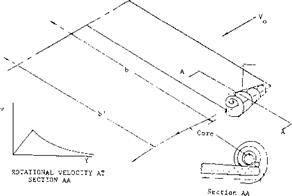
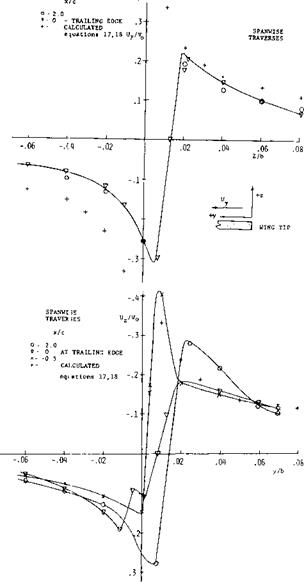
MAXIMUM LIFT. The end-plated wing in figure 15, shows an increase of the maximum lift coefficient from 1.1 to 1.2. The increment is 9%, while the enlargement of wetted area is almost 40%. Here again, a wing increased in span by adding the end-plate areas, is superior, resulting in a CLX= 1.38 (1.09) = 1.5. Of course, a larger span may be structurally undesirable. However, end plates at the wing tips are not desirable either. As a rule, therefore, end plates are used in the design of aircraft only under conditions where they may perform another function, in addition to improving the lift of the device to which they are attached. Such a case is for example a tailless airplane with a swept – back wing, where a pair of end plates serve in place of the vertical tail to provide directional stability and con­trol. Another application of end plates can be found in hydrofoil boats, Chapter VIII where the span of a submerged wing may be limited to the dimension of the beam of the craft. End plates are also used in ground effect vehicles.

Although end plates do produce an increase in the effective aspect ratio which reduces the drag at very high lift coefficients only slight reductions in drag are obtained when operating at or near the cruise lift co­efficients. At the cruise conditions the viscous and interference drag increments associated with the end plates are nearly as great as the reduction of the induced drag due to the effective increase in aspect ratio. While considerable testing has been done with wing end plates it is apparent from figure 15 that the optimum design had not been developed. If the wing span can­not be changed, the use of wing tip devices may be desirable. To develop an optimum wing tip configura­tion for this purpose it is necessary to examine the flow field in which the end plate must operate and then find the tip device required to give the desired performance.

WINGS WITH END PLATES

Figure 15 Lift and drag of a rectangular wing

(a) plain, as tested (18,b).

(b) with circular end plates.

(c) calculated with enlarged span.

WING TIP FLOW FIELD. Detailed measurements of the velocity field at wing tips as influenced by the tip vortex have been made by a number of investigators, (16). Tests show that a main vortex forms over the wing surface as illustrated on figure 16. Between the main vortex and the wing tip a small secondary vortex is also formed as shown. At any station in the stream – wise direction the rotational velocity increases linearly with radius from the core center until the core diameter is reached. Then the velocity decreases as a direct function of the radius. Typical velocity distribu­tions from (16,a) are given on figure 17 as a function of wing span station from the tip and the vertical distance showing these characteristics. The core radius reaches a maximum at the wing trailing edge and then decreases in size with downstream location until it again becomes larger starting at an axial distance of four wing spans downstream, figure 18. The location of the vortex core is inboard and above the wing tip as illustrated on figure 18. The variation of the axial velocity maxima and the circumferential velocity max­ima as a function of the streamwise distance from the trailing edge is given on figure 20.

3-11

WINGS WITH END PLATES

Figure 16. Detailed characteristics of a wing tip vortex.


WINGS WITH END PLATES

Figure 17. Circumferential velocity of the tip vortex.

(a) Vertical distribution

(b) Span distribution


The characteristics of the wing tip flow given on figures 16 to 20 were obtained from tests given in (16,a) for a rectangular wing of A’ratio of 5.33. The decrease of velocity with increasing radius from the core center shown on figure 16 is a function of the wing span, aspect ratio and operating lift coefficient. Theory is available (16,b, c) for calculating the induced velocity produced by the wing tip vortices at the downstream station where the trailing vortices are rolled up, figure 20. At a distance r from the vortex core center the rotational velocity v^of the rolled up vortex can he found from the equations


WINGS WITH END PLATES

(17)

(18)


ъ


yy — Сю b v0 " 7T2AR r


b


>


where Cjw= the lift coefficient at the wing center b = wing span V0 = free stream velocity


A comparison of the measured tangential velocity with that calculated using equations 17, 18 is given on figure 17. Here the velocity ratio at the wing trailing edge is very nearly the same as the value calculated at two chord lengths downstream where the vortices are rolled up. Although equations 17 and 18 were developed for the case where the vortices are completely rolled up it appears that to the first approximation they can be corrected using the data given on figure 20. fills is done by multiplying the calculated velocity ratio ot equations 17 and 18 by к equation 19.

к = u @ x/c = 2/ u @ x/c = x (19)

(16) character’-*.*’ t. r wng tip vortices:

a) C’higie-, v a. . – p Vortices Velocity AHS 27 Forum May ’71

b) Bet z,^ Be ha u. ot Vortex Systems, NACA TM 713, 1933

e) Donaldson. The Aircraft Vortex Problem ARAP No. 155 1971 A) Donaldson, Vortex Wake Conventional А/С, AGARD No. 204 e; Spreiter, et, і Ron лЧ up Trailing Vortex J. A. Sci. Jan. ’51 r irow, Effev. > ‘* C Qg on Tjp vortex j of А/С May 1968 Ю ^orsighs, H r v e wing Tip Surveys Jof А/С Dec. 1973 r.’*l! sow Ro1 eJ f p structure Vortices, J Of А/с Nov. 1973 О і tXormick, et al, Structure trailing vortices J А/С Jan. ’69

WINGS WITH END PLATES

X/c DISTANCE FROM TRAILING EDGE

Figure 18. Vortex core radius as function of downstream distance.

(17) Available tneoretical results on end plates:

a) Ergebnisse AVA Gottingen Vol III (1927) p 18.

b) Mangier, Theoretical Analysis of End Plates, Lufo 1937 p 564 (NACA T Memo 856) and 1939 p 219.

c) Kiichemann, On Swept Wings, ARC CP 104 (1951).

d) Rotta, Plate at One End, Ing Archiv 1942 p 119.

e) Weber, Loads & Inboard Plates, ARC RM 2960 (1956).

WINGS WITH END PLATES

x/c – DISTANCE FROM TRAILING EDGE

Figure 19. Normal and spanwise displacement of vortex centerline.

INDUCED DRAG RECOVERY. According to theory (16,b, c,d) all the swirl energy in the trailing vortex system is trapped within a distance from the centerline of the wing and for a considerable distance outboard. However, as indicated by theory and test the major portion of the rotational energy occures within a very small radius. This is confirmed by (16,c) where it was shown that 54% of the vorticity is within a radius up to

0. 1 of the wing span should be of sufficient size to obtain high energy recovery and a corresponding reduction of the induced drag. Devices that can be used to recover the energy of the tip vortex of a wing thus do not have to be large. Some of the devices that have been considered for this purpose are shown on figure 21 (18,n) and include winglets tip sails, fixed tip vanes and rotating propellers.

WINGLETS. Of the wing end plate devices considered the winglet appears to be the most effective for reducing the induced drag and effectively increasing the aspect ratio. Results of test data (18,k, l) show that using winglets the induced drag is decreased as much as 30% depending on the lift coefficient, figure 22. The winglets tested have the best performance at a wing lift coefficient of 0.5. It would be expected that a change in configuration could shift the C L for best recovery up or down.

The design and analysis of winglets is involved and complex due to the mutual interaction with the wing surface and the exact solution is not available (18,k). However, by assuming the tip vortex is only affected by the main wing the performance of winglets can be estimated by relatively simple methods. This is done by finding the local flow conditions at a series of winglet stations using equations 17 to 19 and the methods previously given. Knowing the flow conditions the force coefficients are found and resolved in the flight direction to find the change relative to the entire wing.

WINGS WITH END PLATES

Figure 20. Variation of axial velocity maxima and circumferential velocity maxima as a function of streamwise distance.

Consider a winglet mounted at the tip of a wing, figure 23, at any station r on the winglet the effective axial velocity, Vj^is influenced by the sweep of the leading edge and the angle of attack so

Vc= у cos (a + 0) (20)

where a = the main wing angle of attack

© = the angle of the winglet leading edge VL = the local axial velocity

The true velocity relative to the airfoil section W, is

W = v/+v* (21)

The rotational velocity v produced by the tip vortex is determined using equations 17 to 20. The apparent angle of attack at any wing tip station is, section AA, figure 23.

«.= A> + і (22)

where a. = apparent wing angle = tan v/V£ і = winglet section incidence

WINGS WITH END PLATES

Figure 21. Wing tip vortex energy drag recovery devices.

Подпись: Kj =.CDi/ CDi OF BASIC WINGWINGS WITH END PLATESПодпись:,5 OPERATION

^—————- 1————— 1—————– 1—————– 1————— 1—————– 1________ I

0 .1 .2 .3 .4 .5 .6 .7

Figure 22. Comparison of induced drag ratio of wing with extended tip to that of a wing with winglets.

The lift and drag coefficients developed on the winglet can be found by assuming it is operating as a simispan wing due to the reflection plane characteristics of the main wing. Thus, knowing the effective aspect ratio of the winglet the lift angle and operating C^ can be found using equations 2 and 22. The drag coefficient is determined from standard data and the resultant force coefficient found from the equation

CR = CLvV/cos Y’ (23)

where Y – tan CDW / CLVv

As shown on section AA figure 23 the resultant force coefficient resolved in the direction of flight gives a change in the drag coefficient of the basic wing equal to

WINGS WITH END PLATES

where S = area of the basic wing bV2 = the span of the winglet c’ = the chord of the winglet

WINGS WITH END PLATES

Figure 23. Relation of winglet to basic wing with flow condition’ and force vectors.

If the angle of the winglet relative to a line normal to the wing is the increase of lift on the basic wing is

ЛС, 2 ( CR cos(0 +Y’)sin0 WcW

TJn ———————— ^ (25)

Based on the above approach the drag reduction and the lift increase is in good agreement with the available test data.

WINGS WITH END PLATES

Figure 24. Comparison of performance of wings with and without winglets.

WINGLET PERFORMANCE AND APPLICA TION. Just as in the case of wings with end plates the applica­tion and performance advantages of winglets are dependent on the configuration of the wing, its aspect ratio and the total area. If the wing span is increased by the height of the winglet and the area held constant then as is shown in figure 24 the winglets have no per­formance advantage. Further if the wing span is in­creased with a corresponding increase in wing area the operating C L will decrease along with the induced drag and this along with the aspect ratio increase will give improved performance compared with the wing with winglets. Also if a wing tip extension is used that gives the same wing root bending moment as a wing with winglets there appears to be no performance advan­tage with the winglets. However, if a winglet is used on a wing there is a decrease in the induced drag of the order of 20% compared to the wing alone. Based on the above, figure 24 it appears that winglets are useful for increasing the performance of an existing wing but if a new wing configuration is to be designed the use of winglets will give little improvement.

Single End Plates, placed at only one end of a wing (17, d) have an effect which is roughly half of that of a pair of plates; id est, for small height ratios (up to h/b ==. 0.2), the maximum increase in effective aspect ratio is theoretically slightly less than

ДА/A == h/b (18)

A plate on one side has a definite limit, however, as to its effect. As the height ratio approaches infinity, the effective A’ratio is no more than doubled, while a pair of plates yields Aj_= oo. The function for a one-side plate plotted in figure 14 can be approximated by

А/ДА = (1 – (b/h)V»)*A (19)

Note that the ratios are reversed in this equation. As a practical example of “single” end plates, avertical tail surface is shown in “Fluid-Dynamic Drag” with a hori­zontal surface placed on top (serving as end plate). A;/A — 1.5, is thus obtained for the fin.

Wing-Tip Tanks (detachable or disposable) have be­come standard equipment in certain types of military airplanes (to extend their range). They are not really end plates. There is an end-plate effect involved, how­ever. Three specific effects of tip tanks can be stated:

(a) Tip tanks usually extend beyond the lateral edge; they may thus increase area and aspect ratio.

(b) They can be expected to permit the flow, laterally to get around them, to a certain degree.

(a) Because of their height (equal to their diameter) and/or regarding their displacement, tip-mounted tanks have an effect similar to end plates.

A number of wind-tunnel tests is available (20) present­ing the lift of wings or wing-body combinations, includ­ing a pair of tip tanks. Analyses as in (21) do not take into account the rolling-up of the wing-tip vortices. We will assume that the flow gets around each tank as far as qualitatively shown in figure 19, so that the span is ef­fectively reduced at each wing tip, as against that be­tween the outer sides of the tanks by Ab = — r, where r maximum radius of the tanks. Thus, for the two tanks Ab = — d, and ДА =■ — d/c. Definition of the effective wing area with and without the tanks is prob­lematic. Using lifting-line principles, exact knowledge [38] is not necessary, however. Assuming the height of the “plates” representing the tanks, to be h = d, equa­tion (25) indicates ДА/A = 1.9(d/b). Depending upon the manner in which the tanks are attached (possibly as in figure 19) we then have 3 steps to consider, the geometrical increment of span and aspect ratio when adding the tanks, the effective reduction due to flow around the tanks, and the increment ДА =• Ab/c, due to end-plate effect. Using equations (6) and (7) we then obtain approximately:

d«7dCL = 10/(1 + d/b) + 20/A(l + 2d/b) (20)

A tank with d := t, may not really have an end-plate effect. It can be assumed, however, that the portion of the tank protruding ahead of the leading edge of the wing, will produce the alpha flow as explained in the “airplane configuration” chapter, that is on the inboard side. Even a tank with d =■ t, can thus be expected to have an effect similar to end plates. “Lift-angle” dif­ferentials due to tip tanks have been evaluated from available wind-tunnel tests (20). As seen in figure 19, equation (20) agrees with the experimental points. Of course, any end-plate effect will be reduced, and the drag due to lift will be increased, when attaching the tanks to the wing tips in a crude manner (leaving a gap, for example).

WINGS WITH END PLATES

Figure 19. Statistical evaluation of the influence of wing-tip tanks on the “lift angle” of conventional wings.

ALPHA FLOW. It can be argued that tank bodies are neither plates nor capable of producing circula­tion. We can indeed speculate that the mechanism through which they affect the wing, is different from that of end plates. It is thus suggested that the “2cx” cross flow, as explained in the chapter on “airplane configurations”, increases the lift on the wing tips. This can only be true when the tanks protrude for­ward from the wing’s leading edge. In this respect, tanks typical for fighter airplanes, have a length about twice the chord of the wing tips. Their influence upon the adjacent portions of the wing is, therefore, similar to that of a fuselage upon the wing roots.

3—15


Подпись:WINGS WITH END PLATESПодпись:INBOARD PLA TES. End plates have also been inves­tigated in positions inboard the wing tips. Results are presented in the “due-to-lift” chapter of “Fluid-Dynamic Drag”. Results of a more recent analysis (17,e) are plotted in figure 20. Because of viscous interference in the four comers of such combinations (particularly on the upper side) the actual effect is much smaller, how­ever, than theoretically predicted. For comparison, we have calculated a function, assuming that the out­board portions of the wing panels would be ineffective (as a consequence of “complete” flow separation). Real results may be expected to fall inbetween the two lines shown. Pylon – or strut-supported fuel tanks, say at 1/2 of the half-span of an airplane, can be considered also to be inboard end plates. As tested in (22,a) a 1% re­duction of induced angle and induced drag can be found for a pair of tanks at 0.64 of the half-span, with a strut length (measured to the center of the tanks) of almost 5% of the wing span.
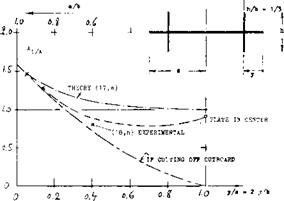
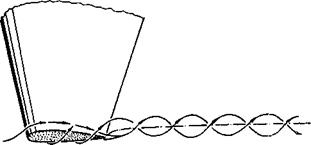
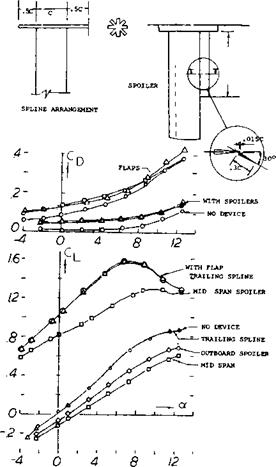
WINGS WITH END PLATES

igure 20.The effective aspect ratio of a wing

when moving a pair of end plates inboard.

!-‘4 11. *.! ip і ice of tip tanks on wing characteristics: uі ‘I’bvoid, North American Aviation Rpt NA-1947-755.

b) Wind-Tunnel Tests. RM А5Г02, L8J04, L9J04.

! ) >’ Hiaracteristics, RAE TN Aero-2085 (1950).

(■- і i ‘и її, mi of wing-tip tanks: a> *b. Analysis, ARC C’Paper 147 (1952).

b) Weber. Wing and Body, ARC RM 2889 (1957).

C Loading, NACA RM L1953B18.

W2) P mu-^imported tanks or engine nacelles:

a) IVnpei. Fuel Tanks, NACA W’Rpt L-371 (1942).

b) RAW On Swept Wing, ARC RM 2951 (19*52).

(24) Cone ;.VSA) re-analysis of induced flow:

a) yorn-x sheet Deformation, TN D-657 (1961).

b) Induced Drag of Bent-Up Wing Tips, R-139 (1962). у Wmgs With Cambered Span, Rpt R-152 (1963).

d) Bending Moments of Wings as in (c), TN D-1505.

Cambered Span. The original induced-flow theory (1) applies to plane wings. A reanalysis (24) including shapes extending geometrically into the third dimension, points out possibilities of improving the efficiency of wings whose span ‘b’ (straight line between the tips) might be restricted. As shown in figure 21, the effective aspect ratio increases, meaning that induced angle and induced drag decrease, when cambering in spanwise direction. In comparison to a dihedraled wing having the same height ratio, the half-elliptical shape proves to be much more efficient. Of course, as in the case of end plates, the increased “wetted” area of cambered-span wings has to be taken into account when considering their “total” efficiency (in terms of L/D). Except for (a) all of the references under (24) deal with a reduction of the in­duced drag corresponding to (Aj/A) as in chapter VII of “Fluid-Dynamic Drag”. For practical purposes, we may assume that the induced angle of end-plated wings is one and the same for drag as for lift, expressed by:

da/dCL= dCD/dc£ (21)

Optimum lift distributions studied in (24) are essentially elliptical.

Bent-Up Tips. The result of equation (26) or figure 14, is also included in figure 21. End plates are seen to be more efficient than any continuous spanwise camber leading to the same height ratio. Up to h/b = 0.1, wing tips bent-up in the form of a quarter circle (24,b) are equally efficient, however. For example for A = 5, the corresponding bending radius would be 1/2 of the chord of a rectangular wing. As shown in chapter VIII of “Fluid-Dynamic Drag”, the interference drag in the corner of an 0010 airfoil bent up (or down) 90°, using a radius not larger than r =? 21, or = 0.2 c, is already zero (at zero lift). How large drag and loss of lift might be, say at the cruising lift coefficient of an airplaine, can only be determined by experiment. It is suggested, however, that with a bending radius between (0.2 c) and (0.1 b) as in the example above, interference would be small, and the effectiveness of a bent-up tip as an end plate would be high (might be the same as theoretically predicted). It is also expected that any bent-down wing tips (or suitably profiled end plates) would not have much of an interference drag.

WINGS WITH END PLATES

Figure 22 Flow pattern past a wing tip, drawn on the basis of flow observations in a water tunnel (7,a).

Trailing-Vortex Hazard. As discussed in the beginning of this chapter, the characteristics of the trailing vortex, figure 22 and Chapter XI, and its strength determine the hazard effects of large aircraft on other airplanes flying in the vicinity. These hazard effects are especially severe when there is a large spread in gross weight between the aircraft (25,a, c,d). It is thus desirable to alleviate the hazard by reducing the strength or breaking up the trailing vortices. The strength of the trailing vortices depends on the wing loading and thus in the far wake would be the same if all the energy is concentrated in the rolled up tip vortex. Thus, changes in distribution would be expected to have a small effect in alleviating the hazard. The use of part span trailing edge wing flaps, however, does apparently reduce the hazard by a change in lift distribution at a distance of 180 wing chords downstream (25,b). This is probably due to a reduction of the strength of the tipwortex by the generation of second vortex at the flap outboard edge. If the vortex at the flap outboard edge does not combine with the tip vortex, use of flaps may be a practical method of reducing the trailing-vortex hazard in the vicinity of airports.

WINGS WITH END PLATES

Figure 23. Effects of changes of lift distribution and trailing edge spoiler on lift and drag of a wing.

A second way of reducing the problem of trailing vortices is by breaking up the rotational energy. To accomplish this a trailing spline as illustrated on figure 23 was tested as well as a spoiler. These devices were designed to break up the vortex and did show an improvement to 100 chords downstream; however, the improvement died out at the downstream distances corresponding to 180 chord lengths. It appears that such devices should be designed to take out the rotational velocity of the vortex to be effective. The trailing spline did not effect the lift of the wing but did increase the drag as shown on figure 23.

25. T Wing trailing-vortex hazard

a) McGowan, Trailing Vortices of Transport Aircraft, NASA TN-D-829.

b) Croorn, Trailing-vortex Hazard Alleviation Devices, NASA TN LX-3166.

c) Orloff, Vortex Measurements – Swept Wing Transport, JofA/C June 1974.

d) Brashers, Aircraft Wake Vortex Transport Model, J of А/С May 1974.

e) Chigier, Vortexes in Aircraft Wakes, Sci Amer, March 1974.

f) Donaldson, Vortex Wakes of Conventional А/С, AGARD – AR-204

INFLUENCE OF SHAPE ON PLAIN WINGS

The wings of airplanes are not anything close to lifting lines. They are composed of panels with a certain chord – and thickness distribution, planform and shape. The influence of these parameters on lift is described as follows.

LIFT DISTRIBUTION. Figure 4 shows the lift distribu­tion of three different planform shapes. It should be noted in particular:

(a) the elliptical wing has a constant and a uniform induced angle of attack.

(b) the rectangular wing has a somewhat more uniform distribution in newtons or pounds, while downwash is somewhat shifted from the center to the wing tips.

(c) the highly tapered (triangular) wing is loaded in the center, while the lift coefficient reaches compara­tively high values near the tips.

(d) Wings with lateral edges show peaks at these edges, not predicted by theory, but nevertheless real.

Подпись:There are elaborate methods (8) available for computing lift distribution across the span of any given planform. We would like to mention here, only a simple procedure approximately indicating span wise distribution. Accord­ing to (8,c, d) the load (in newtons or pounds) of a plane wing is distributed in such a manner as to form the mean between geometrical chord length and the elliptical shape. To find the distribution, it is thus sufficient to draw a half circle with the span as diameter, to plot the chord distribution in a scale so that the resultant plan- form area is equal to that of the half circle, and to take at a number of stations the mean between chord dis­tribution and half circle.

Подпись: Figure 6. Experimental results (7,d) indicating the induced characteristics of a rectangular and two tapered wings.

Подпись: (d<X;7dCL) = к Va/A"INFLUENCE OF SHAPE ON PLAIN WINGSПодпись:INFLUENCE OF SHAPE ON PLAIN WINGSПодпись:TAPERED PLAN FORM. The simple lifting-line theory (equation 3) represents a minimum and thus optimum of the induced angle, obtained for elliptical load distribu­tion. Theory expects that any deviation from this dis­tribution results in a certain increase of the average or effective value of this angle-of-attack component. There are correction factors available, indicating the addition­al amount of induced angle for rectangular and tapered wing planforms. The theoretical correction can be pre­sented in the form of the differential

(12)

where A/a = effective aspect radio and a — 0.9, for conventional airfoil sections. This function is an interpolation (by this author) of analysis (l, b)(10,b), applicable between A = 4 and 15. The factor K, as plotted in figure 5, is in theory smallest for taper ratios around 0.3. In fact, reference (10,b) predicts that the lift-curve slope of such wings is 99% of the theoretical as for elliptical load distribution. By comparison, the influence of fuselage and engine nacelles (see the chap­ter on ‘"airplane configurations”) can be much larger.

INFLUENCE OF SHAPE ON PLAIN WINGS

і igure 5. Factor k, theoretically needed in equation (5) to indicate the additional induced angle of attack, as a function of the taper ratio.

(h’) influence of plan form on induced angle, theory:

Ц {;buen. ARC RM 723 (1922); “Elements Aerofoil 1 гкчігу, Cambridge 1926; quoted in Durand Vol II. th) і lueber. Character of Tapered Wings, Zts Flugt Motoriuftsch 1933 p 249 & 269, and Lufo 1938 p 218. c) Plan-form corrections for the induced drag, as premm-ч! in "Fluid-Dynamic Drag”, are different and nuncwhm smaller than for the induced angle.

U) Re issuer. Minimum Wing Drag, J A Sci 1940 p 114.

A – 4 dA -.14 И – 0.4

v 5(10)®

RECTANGULAR WINGS are expected by theory (figure 5) to be less efficient than elliptical or tapered wings. Tunnel tests on a set of three tapered wings are presented in figure 6. It takes a microscope to determine the differences in the lift-curve slope; and it may be said at this point that the selection of a plan form for the de­sign of an airplane usually depends upon considerations other than the induced angle, such as structural or stall­ing. At any rate, the tabulation shows that. . . the mod­erately tapered wing has the lowest drag-due-to-lift derivative, and that the rectangular wing (with square lateral edges) has the smallest lift angle. There are many other results showing that rectangular wings with sharp lateral edges are very efficient in producing lift. Figure 7 demonstrates, for example, that the sharp-edged rec­tangular form is nearly as efficient as the elliptical wing of the same aspect ratio. Theory as in figure 5, is thus not confirmed (to be discussed later). When evaluating^ the induced angle of a rectangular wing, it must be con­sidered that the effective area varies (reduces) together with the effective aspect ratio. If, for example, A re­duces by A A = Ab/c = —0.1, then the area reduces by AS ==■ — Ab/b =. — (ДЬ/с)/А. As a consequence, the first two terms in equation (6) have to be increased. In equation (7) this is primarily done by the addition of (5/A) in the third term. In the case of figure 7, it is seen that when adding the fairings to the lateral edges, the induced characteristics remain unchanged. Comparing, however, a wing with rounded edges (e) on the basis of equal aspect ratio and of area including the added caps, it is found that A A = —0.12, and that the ef­fective area is reduced by 2.5%.

FOIL-SECTION THICKNESS evidently helps the flow to get around the lateral edges. Figure 8 presents a pos­sibly extreme example. A 25% thick rectangular wind- tunnel airfoil was tested both with and without round fairings added to the lateral edges. Based on one and the same area (without the end caps) the wing without fairings is slightly more effective, as far as lift is con­cerned. Note that the due-to-lift drag derivative also favors the wing without the fairings, while the zero-lift drag coefficient of this wing is, of course, higher than that of the wing with rounded lateral edges. A simple assumption would be that the flow passes around the half-circular end caps to a degree as though they were not present. The fact that the original square-ended wing has a 3% higher lift-curve slope, might then be ex­plained by a more outward location of the tip vortex, as in shape (1) in figure 10. Regarding drag, the two wings in figure 8 compare as follows:

Comiti= dC^/dCj^ — 0.062, square, edges

0. 0085, dCp /dC^ — 0.067, with end caps

For practical purposes, we thus find:

ДЬ/с = -(t/c) == ДА (13)

A rectangular wing with rounded lateral edges thus be­haves, regarding its induced angle of attack and the effective area, roughly as though the end caps were not present (12,c). As in figure 8, the lift-curve slope (with C^ based on rectangular area) is usually slightly less than that of the wing without the tip fairings; see also (13, e).

INFLUENCE OF SHAPE ON PLAIN WINGS

Figure 8. Characteristics of a 25% thick rectangular airfoil; tested (13,g) with and without round fairings at the lateral edges.

TAPERED WINGS. We may assume that the rounding effect be proportional to the chordwise dimension of the edge, indicated in tapered wings by the ratio c(tip)/c(root) = Л. Since the effect is also proportional to (t/c) at the wing tips, equation (13) holds for tapered wings when using for c and t the dimensions at the tips. We have evaluated the theoretical function as in figure 5 and equation (10) for A = 5.5. The result is plotted in figure 9, in the form of ДА = A-t — A, where Aj =. effective aspect ratio. A number of experimental points (some of which obtained in direct comparison to an elliptical plan form) clearly show the beneficial influence of lateral edges, particularly when they are sharp or square. Our final conclusion from experiments and analysis presented, is that the classical statement pro­nouncing the elliptical as the optimum plan form shape, is a “myth”, particularly when it comes to designing and fabricating a wing. Famous airplanes such as the Heinkel-70 and the “Spitfire” did have costly elliptical wings. Our graphs show, however, that a tapered wing can have at least the same aerodynamic effectiveness. Another argument against the elliptic plan form is of­fered in (10,d). The angle of the viscous or section drag is c*5 = CDs/Cl. Since in a real airplane, C|_ and (t/c) are highest at the roots of the wing, and c<sare larger there, than in the outboard portions of the panels. If minimum drag is expected for o^-F(0(5/2) = con­stant across the span, the optimum plan form is some­where between elliptical and rectangular. Finally, it can be said that the “best” wing may not be optimum for an airplane, with a fuselage (see ”airplane configura­tions”) and with a horizontal tail surface exposed to the downwash coming from the center or the roots of the wing (see “longitudinal stability”).

“ROUND” PLANFORMS. In wing sections, a physical (so called Kutta-Joukowsky) assumption is necessary to fix the trailing edge as the point where the flow com­ponents coming from the two section sides, meet each other (in a rear “stagnation point”). A similar, never mentioned but equally necessary assumption, is that the tips of a finite-span wing coincide with the ends of the lifting line. As explained above, this is not true in the case of well-rounded lateral edges, as in figure 8 for example. In a similar manner, wing “tips” with well – rounded plan form shape result in an effective aspect ratio which is smaller than the geometrical one. The path of the trailing vortex is shown in figure 10, for three different tip shapes of a basically rectangular wing, with A =- constant = 3. According to equation (1) the roll-up distance (say behind the quarter-chord line) is in the order of x/c = 10, for Cj_ = 0.6. The path of the tip vortex was traced to only one chord down­stream from the trailing edge in the investigation dis­cussed. The location of the vortex at this distance may permit, however, to estimate the reduction of the “vortex span” of the shapes tested, in comparison to that of the basic rectangular wing. Values of ДА,, eval­uated from experimental results of doC’dCj_ of various shapes, were found to be proportional to the lateral displacement (Ду/с) as defined in figure 10. Assuming

INFLUENCE OF SHAPE ON PLAIN WINGS

figure 9. Differential ДА of the effective aspect

ratios of tapered wings having a geometrical ratio A — 5 to 6, as a function of their taper ratio.

ill V n lorin and induced angle, experimental:

a) !),4’r^h. Rectangular/Elliptical, Ybk D Lufo 1940.

1)1 І– gehmsse AVA Gottingen, Vol I (1921) p 63.

0 {-v/tLerr. Control Surfaces, Ybk D Lufo 1940, 542. cl ) bib. t;-tein. H’Tail Collection, NACA T’Rpt 688.

G Circular Wings, see Yearbk D Lufo 1939 p 1-152, andZimmerman in NACA Tech Note 539 (1935).

i),ans(‘n – 5 Elliptical, Ybk D Lufo 1942 p 1-160.

g) Purser. Various Wing Shapes, NACA TN 2445 (1951). j Knight, Various at R — 2(10* NACA TR 317 (1929). "

INFLUENCE OF SHAPE ON PLAIN WINGS

Figure 10. Location and path of the trailing vortex

originating along the lateral edge of a basically rectangular wing, having an aspect ratio A — 3, as found (13,f) for six different wing-tip shapes.

that the volume of air affected (deflected) by the wing be proportional to the square of the vortex span b*, the average induced angle may be expected to cor­respond to

A; = A+ ДА = (b-t – Abf/S = А + 2(ДЬ/с) (14)

For shapes (1) and (3) substitution of 2( Ду/с) for (ДЬ/с) leads by way of equations (4) and (6), correctly to the lift angles as tested. Doing this, it is not assumed that the effective area would be reduced.

INFLUENCE OF SHAPE ON PLAIN WINGS

BXF. dcf/dCj. do£/dCL Дъ/о

11.0 19.9 7.0 0

13,Ъ 18.7 7.0 0

11.0 20.8 7.В -.10

13,b 19.6 7.5 -.10

11.0 21.5 8.5 -.18

13.0 19.0 8.2 -.16

t/o ■ 11.7 to 13*5 (11,c) tested with flap and gap (13»e) tested in closed tunnel,

while all others in open tunnels

Figure 11. Reduction of the effective aspect ratio of “round” wings as against the sharp-edged rectangular shape having the same aspect ratio A — 3.

R0 – 2(10У

INFLUENCE OF SHAPE ON PLAIN WINGSFigure 12. Comparison of a basically rectangular wing with A =■ 6 =r constant, for three different planform shapes of the ends or tips (ll, h).
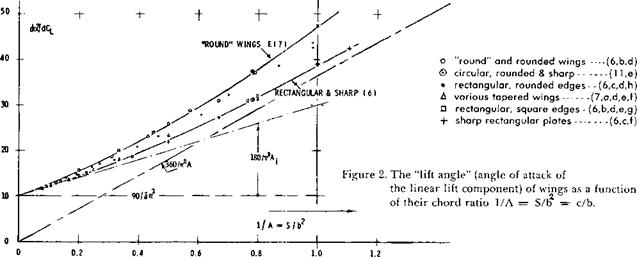
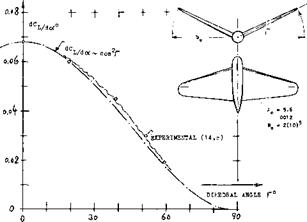
REAR CORNER. Some more “round” planform shapes are shown in figure 11. Here and in figure 12, it is seen that cutting away from the rear corners of the plan form is particularly harmful in reducing lift-curve slope and effective aspect ratio. For conventional thickness ratios (between 11 and 13% as tested), Ab/c reaches values, as against the sharp-edged rectangular wing having the same aspect ratio, roughly between —0.2 and —0.3, for round or cut-away shapes. This reduction is larger than that for rounded lateral edges (preserving rectangular planform) where Ab/c is between —0.10 and —0.14, for the thickness ratios, investigated. Such values are to be used to modify the sectional as well as the induced angle required to produce a certain lift coefficient. Accounting for the loss of useful span of the round or raked, and rounded two tip shapes in figure 12, only by way of an effective aspect ratio, values of A A = —0.4 and —0.5 are found, in comparison to rectangular and square-edged Wing.

“U” SHAPE. Wing ‘5’ in figure 10 is very effective, des­pite the fact that the vortex span is somewhat small by comparison (19). It was found, however, that the trailing vortex is located at a level some 6% of the wing chord higher than in the case of other wing ends tested. The bent-up tips seem to serve as a low type of end plates (see later). Taking the 6% as measured (which are equal to 0.5 (t/c) of the foil section used) it can be assumed that the wing tips impose upon the vortex sheet a “U” shape with an equivalent end-plate height h/b =

0. 06/A =2%. According to equation (25) the cor­responding increment of the effective aspect ratio is ДА = 2(0.02) =■ 0.04. This much helps, but it
is not yet enough to explain the performance of shape ‘5’. It is suggested that the clean flow around the wing tip, as shown in Chapter VII of “Fluid-Dynamic Drag”, may be responsible, (a) for the complete preservation of the effective area, (b) for minimum parasitic drag due to lift, and (c) possibly for a more favorable roll­up process in the wing’s vortex wake. These arguments are supported by trying the opposite, id est adding drag.

TIP DRAG. As reported in (15) a pair of spheres (as in ball bearings) was attached to the lateral edges of the horizontal-tail-surface model as in figure 13. When writing the well-known equation for the induced angle in the form of

dcX;/dCLb — 1/ir = 180/1^=18.3° (15)

where Cuj—L/qb, an angle is found which is inde­pendent of the aspect ratio A = b/c. In the experi­ment, it was found that

A(X /ДСц — 19.0° for the plain wing tips,

hoc /ACl = 19.8°, with the spheres attached.

The effective aspect ratio is thus A[ = ‘(19/19.8) A =

0. 96 A. The reduction caused by the spherical ob­stacles (15.b) is A A =- —0.04 A, which is ДА = —0.14, for A =. 3.7. In other words, a strip of Ab/c =■ AAAI =■ 0.035, is effectively cut-off from each lateral edge of the rectangular wing, when dis­turbing the flow along and around the edges. When eliminating a similar disturbance by means of the “clean” tip shape ‘5’, the superior performance of this type of edge can be understood (19).

INFLUENCE OF SHAPE ON PLAIN WINGS

Figure 13. Experiment (15) demonstrating the

influence of a pair of obstructions (spheres) upon the lift of a horizontal tail surface.

(12) Small-aspect-ratio considerations:

a) Jones, NACA TN 817 and T’Rpt 835 (1946); also in “High-Speed Aerodynamics” Vol VI of Princeton Series.

b) Bartlett, Lateral Edges, J Aeron Sci 1955 p 517.

c) This result agrees with the concept in (a) and (bl whereby any “retracting” parts of lateral edges, behind maximum span, do not contribute to lift.

(13) Influence of tip shape on wing characteristics:

a) Hoerner, Fieseler Water-Tunnel Rpt 16 (1939).

b ) Kesselkaul, Tests of Wings with Various Lateral – Edge Shapes, Inst Aircraft Des Braunschweig, 1941.

c) Zimmerman, Small A’Ratios, NACA TN 539 (1935).

d) Hoerner, Aerodynamic Shape of Wing Tips,

USAF AMC Tech Rpt 5752 (Wright Field 1949).

e) Goett, Rounded Edges, NACA T’Rpt 647 (1939).

f) Hoerner, Tip Vortex Measurements Behind 6 Wing Shapes, ZWB UM7815 (Messerschmitt Rpt TB-92/1943).

g) Bullivant, 0025 and 0035, NACA T’Rpt 708 (1941).

h) Experiments similar to (b) and (f) by Valensi in Pub! Sci Tech Ministere de Г Air, 1938 No. 128.

(14) Characteristics of wings with dihedral shape: a) Purser-Campbell, Experimental Verification of Vee-Tail Theory and Analysis, NACA Rpt 823 (1945).

h) Datwyler, Mitteilung Aerody Inst TH Zurich, 1934. c) Schade, “V” Tail Forces, NACA TN 1369 (1947).

15) Engelhardt, Influence of Fuselage Upon Horizontal Tail, Rpt Aerody Lab TH Munchen (1943).

Figure 14. Effective aspect ratio of wings with end

plates (18) as a function of their height ratio.

APPLIED LIFTING-LINE THEORY

One of the most useful tools in the aerodynamic de­sign of airplanes is the lifting-line wing theory, first pub­lished in 1918 (l, a). Practical results and limitations are presented as follows.

VORTEX SHEET (3). As explained in the chapter dealing with the characteristics of “airfoil sections”, lift is the result of a “bound vortex” or “lifting line”. In wings with finite span, the circulation around this line does not discontinue at the ends or tips. Imme­diately behind the line, a vortex sheet with a more or less uniform downward velocity V leaves the wing. As a consequence of the pressure difference between lower and upper side of the lifting surface, a certain flow is caused around the lateral edges, thus starting a pair of strong trailing vortices. The vortex sheet immediately begins to roll itself up into these vortices; and it even­tually passes all of its vorticity into the pair shown in part (b) of figure 1. Note that the sheet also contains the viscous wake (boundary layer) of the wing. The “dead” air rolls “into” the trailing vortices together with the vorticity. Ц is not correct, however, to assume, that the viscous wake would be sucked into the vortex cores. More information on shape and location of the vortex sheet is given in “longitudinal stability”.

TRAILING VORTEX. The structure of a vortex is de­scribed in the “general” chapter. The size (diameter) of the viscous core depends upon viscosity and upon the disturbance (separation) of the flow at the edge from which it originates. For example, in chapter VII of “Fluid-Dynamic Drag”, the diameter of a core starting from a rounded lateral edge is seen to be d.— 0.05 c, where c= chord length of a rectangular wing, with A = 3, at Сц~0.6. As reported in (2,c) the diameter is proportional to Cjj and it is a function of scale (Rey­nolds number). As measured in flight (at R^ = 3( 10)^, and CL— 0.75) the diameter was found to be 10% of the wing-tip chord, while in a wind-tunnel test at Rc = 2( 10) it was about twice as large. At a distance behind the trailing edge x= c, where these tests were performed, the pressure within the viscous core is in the order of Cp= — 1. The diameter grows with distance. For ex­ample, flight tests (3,c) indicate for a wing with A = 6, at CL= 0.9, a core diameter d = 0.2 b, at x ~ 25 b.

ROLL-UP. As observed in wind-tunnel tests, the tip vortices start forming at the corner of the leading edge (if there is one, as in rectangular or tapered wings). Theoretically (for elliptical lift distribution across the span) the final distance between the vortex centers is bjfb = тг/4. As indicated in (2,b) the distance x as de­fined in part (a) of figure 1, is

x/b = 0.1A/Cl= 0..1/CLb (0)

where CLb=L/qb. As derived in (16,a) the distance from the lifting line where the roll-up is “completed”, is approximately

x/b = k/CLb (1)

where к = 0.4, for “essentially” rolled-up condition; and к •= 0.9, indicating that 99% of the vorticity is concen­trated in a pair of non-viscous cores. Nominally, the diameter of these cores isd=?b(2/3). For example, for C|j=- 1, and A = 5, and CLb= 0.2, the 99% rolled-up distance is x = 4.5b, orx = 22c. However, at or be­yond this distance, dissipation takes over. Nevertheless, as pointed out in (2,a) the vortices generated by a trans­port plane with W = 300,000 lb, and b =. 43 m, flving at Cl=1.2 (climbing) corresponding to V=160 kts, still persist after more than 2 minutes, at a distance behind the aircraft of 10 km (!). In this manner, such an air­plane leaves behind a disturbance with up and down velocities up to plus/minus 3 or 4 m/s. Another airplane, flying into this wake, can then encounter angle-of-attack differentials in the order of plus/minus 2 or 3° , and local lift differentials in the half wings, up to plus/minus 15%.. A smaller airplane hitting the center of a vortex, might even be rolled over.

RECTANGULAR WINGS. Most analyses consider el­liptical lift distribution. For sharp or square-ended rec­tangular wings, experimental evidence such as in fig­ure 10, suggests a vortex span in the order of b[==. 0.9b. It seems that the lateral edges of such a planform are a continuation of the bound vortex, thus making this shape more effective and efficient than predicted by the “chordless” theory. In fact, when assuming the lateral edges to be end plates (see later) reasonable answers are obtained for induced angle and effective aspect ratio (equation 2).

DOWNWASH. An integral part of the flow pattern be­hind a lifting wing is a permanent downward deflection (downwash) of the affected stream of air. Lift can thus be understood as the result of that deflection. In wings with an elliptical distribution of lift or load along the span, the affected stream is equal in magnitude I but it is not identical) to that contained in a cylinder having a diameter equal to the wing span ‘b Considering an air­plane in level flight, we may visualize this cylinder as being deflected so that it assumes the downward velocity V. Behind the airplane, the cylinder is thus inclined against the horizontal at the downwash angle s === w/V, until it finally meets the ground. There, the momentum imparted by the airplane upon the cylinder of air, is transferred onto the earth in the form of pressure. In this manner, the airplane may thus be considered as being supported from the ground.

INDUCED ANGLE. At the location of wing or lifting line, the average angle of deflection is but one half of that of the assumed cylinder at a sufficiently great dis­tance behind the wing. The angle at the wing is called “induced” (4). The minimum of the induced angle is theoretically found for elliptical distribution of the lift over the wing span:

= L/qirl? = С^АгАл (2)

where Ajdenotes the effective aspect ratio as explained later. This angle has to be added to that required in two – dimensional flow (as shown in the chapter on “airfoil sections”) to develop a certain lift coefficient.

LIFT ANGLE. The lift-curve slope of an airfoil in two – dimensional flow is theoretically dCb/dc<^=r 2тг. In­stead of this slope, it is more convenient, however, in practical applications of lifting-line theory, to use the reciprocal value dc</dC^ which shall be called the “lift angle”. Including the induced component, this angle is (in larger aspect ratios)

dcx/dCL = 1 /(2 a if) + l /( tAj) (3)

where subscript ‘2’ denotes th/angle in 2-dimensional flow. For conventional foil sections in undisturbed flow, the factor ‘a’ is in the order of 0.9. Using this value, equation (3) can be written in degrees, roughly as

do?/dCL= 1(H-(19/Aj) 10-И20/А) (4)

where T9’ and ‘20’ are somewhat larger than the theoret­ical minimum (180/тґ[36]) = 18.3°. This equation, rep­resenting lifting-line theory* is primarily applicable to wings with short chords, that is, with high aspect ratios A = b/c =- bS/S, where the average chord c = S/b. Accordingly, the function is seen in figure 2, adequately describing the lift angle of rectangular and/or moder­ately tapered wings, with sharp or square lateral edges, up to 1/A =■ 0.15, or down to A = 7.

“LIFTING SURFACE”. A wing is not a “line”. The chord has a certain influence upon the magnitude of the lift angle. As explained in the “small-aspect-ratio” chapter, a long chord appears not only in the form of a small ratio, but also in a three-dimensionality of the airfoil section used. On the basis of experimental results (9) in figure 2, the additional lift angle of the section, is

A(dof/dCL) = 9/A[37] (5)

Summing up, the lift angle of efficient wings is

do<p/dCL= 10 4- (9/A2) – t – (20/A) (6)

This equation describes rectangular and moderately tapered plain wings with sharp or square lateral edges.

(3)

APPLIED LIFTING-LINE THEORY

Regarding rolling-up trailing wing-tip vortices:

a) Bird, Visualization, J Aeron Sci 1952 p 481.

b) Hoerner, Tunnel Tests, see (13,a, b,f).

c) Kraft, Flight Tests, NACA TN 3377 (1955).

d) Shape of vortex sheet behind delta and swept wings, see NACA TN 3175 (1954) 8c 3720 (1956).

e) Vortex Wakes, RAE TN Aero 2649, and ARC CP 795.

f) ARC, Flight Tests, CP’s 282,489,795 (1954/65).

(4) The word “induced” refers to an analogy to the magnetic field around a wire carrying electric current. Glauert: “induced velocity at any point corresponds to magnetic force due to current”.

(6) Systematic investigations of rectangular wings:

a) Series of Wings, Service Technique No. 83.

b) Gottingen, Rectangular, Ergebnisse I, III 8c IV.

c) Winter, Plates and Wings Short Span, Forschung 1935 p 40 8c 67; Translation NACA T’Memo 798.

d) Zimmerman, Various Shapes, NACA Rpt 431 (1932); also Circular, TN 539 (1935); J A Sci 1935 p 156.

e) Higgins, In VD Tunnel, NACA T’Rpt 275 (1927).

f) Wadlin, Hydrodynamics of Rectangular Plates, NACA TN 2790, 3079 8c 3249, or T’Rpt, 1246 (1955).

g) Scholz, Forschung Ing’Wesen 1949/50 p 85.

h) Brebner, Various Wings, RAE Rpt 65236 (1965).

i) Bussmann, 0015 Wings, ZWB T’Berichte 1944 p 245.

(7) Lifting characteristics of tapered wings:

a) Anderson, Investigation of 22 Tapered Wings,

NACA TR 572 8c 627 (1936/38); also T’Rpt, 665′(1939).

b) Junkers Wind-Tunnel Results, about 1941.

c) Truckenbrodt, Delta Wings, ZFW 1956 p 236.

d) Allen, 3 Tapered on Fuselage, NACA RM A53C19.

e) NACA; A =- 8, 10, 12, TN 1270 and 1677 (1947/48).

f) Wolhart, A = 2 to 6, NACA TN 3649 (1956).

g) King, Taper Ratio Series, NACA TN 3867 (1956).

(8) Distribution of lift across the wing span:

a) Multhopp, Calculation of Distribution Across Wing Span, Lufo 1938 p 153 (Transl ARC No. 8516).

b) DeYoung, Arbitrary Plan Form, NACA Rpt 921.

c) Schrenk, Simple Procedure, Luftwissen 1940, p 118; English translation, NACA T’Memo 948.

d) Hafer, Improvement of (c), Luftwi 1944 p 12.

e) Laporte, Examination of (c), J A Sci 1955 p 787.

(9) We do not agree with the widely used form­ulation (12,a) whereby the angle as in equation

(5) is in the order of A(do8/dCj_) — 8/A.

“ROUND” WINGS are meant to have rounded lateral edges and/or to be rounded in the planform (see later) of the wing “tips”. As a consequence of some flow around the lateral edges, not only the effective aspect ratio, but also the effective wing area is reduced. To properly formulate these effects would be complex. The experimental results in figure 2, suggest, however, as an upper limit:

dcx°/dCL = 10 + (12/A2) + (25/A) (7)

It is not certain that the last term of this equation rep­resents induced drag only. In fact, when A reduces by ДА to Aj, the effective area can be assumed also to be reduced, thus increasing the sectional angle of attack required. Equations (6) and (7) demonstrate that the components of the angle of attack can be added to each other. In the case of wind-tunnel tests and/or in the presence of the ground, the correction of the angle of attack caused by the boundaries of the fluid space, presents another angle-of-attack component. For those who wish to think in terms of lift-curve slope, equation (3) transforms into

dCL/do/ = 2air/(l + 2a/A-L) (8)

where (2 aT) =■ lift-curve slope of the foil section used (as in two-dimensional flow). Transformation of equa­tions (6) and (7) would be complex.

DIHEDRAL is the academic word for what we can also call “V” shape. Lifting-line theory as described in this section, has one final application in such wings. As pointed out in (14,a) when raising the tips of a straight wing (thus reducing the span), each wing panel approximately maintains induced characteristics, in the plane normal to the panel, equal to those of the original straight wing. The lift of a panel (in verti­cal direction) is equal to (normal force) times (cos/*)- Since the angle of attack is measured in the wing’s plane of symmetry, the lift angle (X^of a dihedraled
wing is expected to be

dot/dC^ =■ (0.5/тґсо s*f) + (l/trAp cos2D (9)

where ‘p’ indicates that the reference area is the sum of the panel areas, Sp , and Ap – 2 s/c ж 4 sVSp, where s = span of a panel, = 0.5 b. As confirmed by the experimental results on a “V” shaped tail sur­face in figure 3, lift then reduces in proportion to cos2Г. The lateral force derivative of the surface is shown in the chapter on “directional stability and control”.

APPLIED LIFTING-LINE THEORY

Figure 3. The lift coefficient (based on sum of panel

areas) of a “V” tail surface, as tested (14,c) and as calculated (14,a) as a function of the dihedral angle.

INDUCED DRAG. Referring the lift coefficient of a dihedraled wing to the projected planform area S = b c, it is found that CNp, where ‘p’ indicates that the normal force is still referred to the panel area. Equa­tion (9) then changes into

do(/dC^=z (0.5/trcosD 4- (1/trA cos ) (10)

Defining now A — b/c, the induced lift angle is

doq/dCL= SArb2 (n)

where S = projected area, as above. – For a dihedral angle of 6°(as possibly used in the wings of conventional airplanes) the increment is expected to be only in the order of 1%. However, “V”-shaped tail surfaces have been used in place of the conventional tail assembly, with dihedral angles in the order of 30. Comparing such a surface with a straight horizontal tail having the same span, equation 11 predicts that induced angle and induced drag will remain unchanged. A more correct analysis (14,b) indicates the very small decrease as shown in figure 21. For example, at Г-30 , the reduction (when keeping b = constant) is in the order of 4%.

CHAPTER III – THE LIFT OF STRAIGHT WINGS

Aerodynamic lift is primarily utilized to “lift” airplanes; into the air and to keep them aloft. The device which nature has evolved for this purpose (as in birds) and which man has successfully developed to sizes not avail­able in nature, is “the” wing. Lifting characteristics of various shapes of essentially straight wings are treated in this chapter.

CHAPTER III - THE LIFT OF STRAIGHT WINGS

Figure 1. Vortex pattern behind lifting line (2) and/or wings (3).