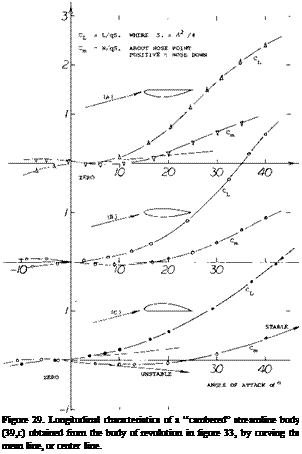
Streamline bodies and similar elongated shapes are used wherever the drag must be kept to a minimum. These bodies are, therefore, used for all types of missiles, aircraft fuselages, engine nacelles, airships, fairings and any other object that should have minimum drag. In addition to the drag force streamline bodies produce a lift force and longitudinal or yaw moments which are covered in this chapter.
Geometry. When considering aerodynamic characteristics of streamline bodies as such, their coefficients are to be based on the dimensions:
d = diameter (if circular as in a body of revolution)
b = width (span) or height, normal to angle against flow
Л = overall length of body
x = distance from nose, along axis.
The most important dimensions are b and JL; and we will preferably use the coefficients
2
CNb = N/qb for lift or normal force
Cm^= M/q ib for longitudinal moment
It should be noted that in an isolated body of revolution, there is no difference between the derivatives of pitch moment (dC^do/) and of yaw moment (dC^/cl.^). The maximum cross-section or frontal area of ror. ationally symmetric bodies is S0 = d27T/4. The projected lateral or plan-form area S + (if used as the equivalent of “wing” area) is approximately:
Sf = (0.8)і d in ellipsoids (or airships)
= (2/3)Л d in pointed streamline bodies
where o.8 tt/4. This area is indicative of the non-linear
cross-flow forces, at higher angles. In the case of airships and flying-boat hulls, their volume denoted by V is significant for performance (buoyancy). Therefore, coefficients are very often vased on the length V ^3 , the area V %; and the moments are referred to the volume V. The ratios of volume in streamline bodies of revolution are roughly as follows:
V = 0.6T d in ellipsoids (airship bodies)
V = 0.5 f d in pointed streamline shapes
In naval architecture, in regard to the displacement of ships, this type of ratio is called the block coefficient, “B.” Thus for bodies of revolution
“B” = V/id2 = .5 to.6 1. LIFT DUE TO CIRCULATION
A streamline body operating at an angle of attack develops a lifting or normal force similar to that of a low aspect ratio wing. As explained in Chapter XVIII this force consists of two different components, due to circulation and cross-flow.
Theory as presented in (l, a) predicts that in a slender body of revolution, lift develops corresponding to local cross forces per unit length:
dF/dz = q(dSc /dx) sin(2c£) (1)
where dS0/dx = rate of change of cross-section area. When integrating this equation over the length of a complete (“closed”) streamline body, positive lift is found in the forebody and a negative contribution in the afterbody; the resultant lift is always zero. Considering, however, a circular cone with finite length and a blunt base, its lift coefficient based on base or frontal area S, is found to be
C|Lo= sin(2oc) = 2 sinoC cosa: ^ 2oc ^)
This type of lift is due to longitudinal circulation as in wings and/or airfoil sections.
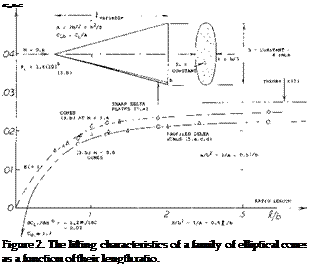
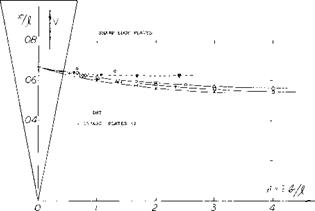
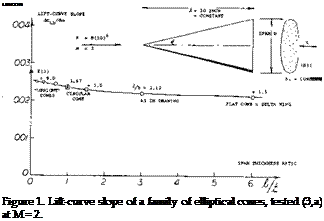 Delta Wings. The derivative of the linear (circulation-type) component of lift as in equation (3) is the same as that for small aspect ratio wings, Chapter XVII. In fact, the cone in figure 1, with b = 6 t, can very well be considered to be a delta wing. Experimental results of another family of elliptical cones (with b = 3 t = constant) is plotted in figure 2. At larger values of the length ratio, the same average level is obtained as in figure 1. At the other end of the scale, the aspect ratio increases toward infinity. For example, at^/b = 1, the ratio is A = 2 hz /ЪХ – 2 (b/jf) = 2, which is no longer slender. Modifying equation 6 in Chapter III to (12 + (10/A2 ) + (20/A)); and replacing A by 2 ЪЦ, we can write
doC/dCLb = (24 ЪЦ) + (SJl/Ъ) + 1.7 (4)
This function, resulting in dCbb/dcxr = zero at J/h = zero, is verified by test on various slender delta wings. Equation 4 also extrapolates with good results the test results on cones toward_//b = zero.
 Elliptical Cones. The forces discussed do not correspond to the volume of the body, but to that of the air affected by the body. The cylinder of air deflected by a conical body corresponds to its “span” b (see figures 1 or 2). Therefore, to accommodate cones with cross-section shapes other than circular, it is best to refer their lift to
о
the area Sb = b. The lift-curve slope of elliptical cones from equations 1 and 2.
dCLb /йофг/2Хтг/180) = ^7360 = 0.0274 (3)
Where C L b is the lift coefficient based on b2 .
Experimental results on a “family” of cones with elliptical cross section shape varying in span/thickness ratio, are plotted in figure 1. Although their lift is between 10 and 20% below the theoretical level, the graph demonstrates the fact that equation 3 applies to “all” types of cones, from slender “upright” elliptical shapes (with t considerably larger than b) to slender delta wings (with t zero).
(1) Theoretical analysis of slender bodies:
a) Munk, Airship Theory, NACA T Rpt 184 & 191 (1923/24); also in Vols I & VI of Durand’s “Aerodynamic Theory”.
b) Vandrey, Pitching Moment, Yearbk D’Lufo 1940 p 1-367.
c) Lighthill, Supersonic Body Flow, ARC RM 2003 (1945).
d) Tobak, Derivatives of Cones, NACA TN 3788 (1956).
e) Kaplan, Potential Flow, NACA T Rpt 516 (1935).
f) Sacks, Forces and Derivatives, NACA TN 3283 (1954).
g) Spreiter, Wing-Body Configurations, NACA T Rpt 962.
h) Young, Family of Bodies, ARC RM 2204 (1945).
i) Upson, Airship Analysis, NACA T Rpt 405 (1932).
(2) Characteristics of pyramidal bodies:
a) Flatau, Chem RD Labs, Spec Pub 1-31 (1961); Astia 270250.
b) Paulson, Delta Vehicle, NASA TN D-913 (1961).
c) Ware, Reentry Configuration, NASA TN D-646 (1961).
d) Olstad, Same as (c) at M = 0.6 to 1.2, NASA TN D-655 (1961).
(3) Lifting characteristics of conical bodies:
a) Jorgensen, Elliptical Cones, NACA T Rpt 1376 (1958).
b) Stivers, Family of Cones, NASA TN D-1149 (1961).
c) Flatau, Army Chem RD Labs Spec Pub 1-32 (1961); Astia 270838.
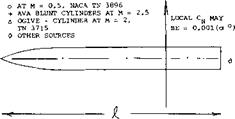
Mach Number. The cones as in figure 1, were tested at a supersonic speed, corresponding to M = 2. The cross-flow velocity on which the lift of a slender cone depends, is w = V sinoc. At the sides of circular cones, this component will be doubled corresponding to the “2 alpha” principle. The perturbation velocity due to the displacement by the cone is approximately (V sin£), where £ = half-vertex angle. For example, for o’ and £ , each equal to 0.1 (corresponding to 5 or 6 degrees) the maximum cross-flow velocity may then be w = 0.3 V. Therefore, the effective Mach number for the experiments as in figure 1, is only a fraction of the number at which the wind tunnel was operating. Ultimately there will be a critical condition, however, where the Mach cone coincides with tha: placed around the longer axis of the elliptical cross section. For M = 2, the corresponding critical cone shape corresponds to ^/b = 3.5 which is obtained above b/t = 6 in the graph. Results on the other family of cones (in figure 2) are shown both for M = 0.6 and = 1.4. The fact that there is a difference (in the order of 10%) in the lift coefficient between subsonic and supersonic speed, may partly be accidental. Within the limitations of theory (really slender cones at small angles of attack) there would not be any difference. The other fact, that none of the values tested comes closer than to 90% of the theoretical level, equation 3, is easily explained on the basis of “round” lateral edges. Evidence presented in Chapter III confirms that 80 or 90% will be a reasonable value to be used in combination with equation 3.
Lateral Forces. The type of cone as in figure 1 was tested for b/t = 6 as well as for t/b = 6. Considering the cone with b/t = 6, to be a delta wing, the point at b/t = 1/6, represents the lateral force deriviative (based on the square of the span b = 6 t)
dCy^ /А/3 = (t/bf dCLb /doc = 0.025/62 = 0.0007 (5) for that particular wing.
(4) Analysis of slender (delta) wings:
a) Jones, Delta-Wing Lift, NACA T Rpt 835 (1946); also J Aeron Sci 1951 p 685.
b) British Efforts, ARC RM 2596, 2819, 3116.
c) Lomax, Slender Wing Theory, NACA T Rpt 1105 (1952).
d) Spreiter, Slender Configurations, МАСА T Rpt 962 (1950).
e) Sacks, Derivatives, NACA TN 3283 (1954), as in (1).
(4) Analysis of non-linear Uft in small A’ratios:
k) Bollay, Zero A’Ratio, ZaMM 1939 p 21; also J Aeron Sci 1936/37 p 294.
l) NACA, Statistical Interpretation, TN 2044 & 3430.
m) J Aeron Sci 1953 p 430; 1954 p 134, 212, 649.
n) Brown, NACA TN 3430; also J Aeron Sci 1954 p 690.
o) The non-linear problem is now claimed to have been solved; see Gersten, Non-Linear Theory, ZFW 195 7 p 276 and Ybk WGL 1958 p 25. No explicit formulation seems to be available, however.
p) For “end-plate” principle, see (72) in the “wing” chapter.
Figure 3. Normal force distribution on a slender streamline body, at oc =10°:
a) as predicted by theory (l, c)
b) as tested (7,b) by pressure distribution.
Load Distribution. As mentioned before, a complete body (with a tail reducing to a point) would have zero lift, in non-viscous fluid flow. The load distribution along the axis of a very slender streamline body is plotted in figure
3. As shown in (l, c) or (7,b) the change in surface pressure due to angle of attack (as against the distribution at oc =0) is theoretically as follows:
a) Along the sides of the body, the minimum pressure obtained corresponds to
Cp = —3 sin2 <x (6)
as in a circular cylinder inclined against the flow (“2 alpha” cross flow).
b) Along the plane of symmetry, the pressure variation due to thickness at oc = zero, is:
A Cp = siri2 oc ± sin(2oc)(dd/dx) (7)
where the first component represents the cross-flow stagnation pressure. The second component is due to the change in body diameter. The plus sign applies to the bottom, and the minus sign to the upper side. Since the variation of the diameter dd/dx is positive in the forebody, we obtain a lifting normal force there. In the afterbody, the theoretically expected normal force is negative (down) so that the resultant force is zero. The normal force loading is proportional to (dx/d)(dd/dx), where x = distance from the nose point of the body, and dx = diameter at x.
 — о. З X—1>"
————– C = 00 си————- d = o. 1 5 (
minimum drag coefficient. CD = o.05 smooth
= o.20 rough surface
coefficients CLb = L/qb2 ; Cm£ = M/ql/Д
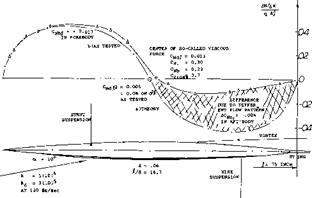
“Viscous Lift. ” As demonstrated in figure 3, tested pressures and normal loads agree fairly well with theory, on the forebody. The corresponding lift is the same as indicated in equations 2 and 3 for cones. In the afterbody, theory expects negative loads. In reality, the pressure increase along the upper side of the afterbody, to the centerline pressure as in equation 7 does not take place. At the angle as tested, there is no positive lift in the afterbody. The lift exists in the forebody. However, the negative lift in the afterbody is reduced; the result is a net positive lifting or normal force.
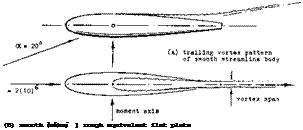
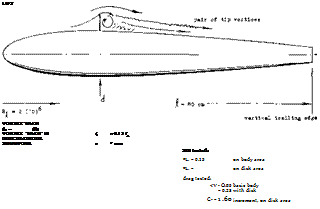
“Edges. ” Although viscosity is the basic reason for the development of positive lift on a streamline body the boundary layer is not necessarily responsible for the deficiency of positive pressure at the upper side. In fact, there is “no” accumulation of B’layer material, and “no” separation. Rather, there is a change of flow pattern from that predicted by potential theory, to the real one as in figures 4, 5, & 6. Without friction, there would not be circulation and/or lift. However, the slightest trace of viscosity is sufficient to transform any “sharp” trailing edge into something similar to a stagnation line as in the case of airfoil sections. In the case of a streamline body, we do not have sharp edges. However, skin friction and the absolute refusal of the boundary layer to proceed against a strong positive pressure gradient, makes “edges” out of the lateral sides of the body. All this starts on a streamline body at roughly 50% of the length, where the negative pressure gradient due to thickness along the forebody and due to longitudinal flow, begins to change into a positive gradient. Therefore, the forebody retains a positive lifting load as approximately described by equation 3.
|
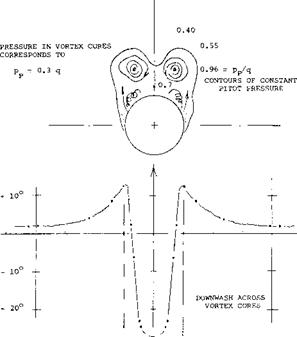
Figure 5. Pattern of the pair of vortices containing the circulation produced by an ogive-cylinder body (NACA Rpt 1371).
|
(5) Slender delta wings, experimental:
a) British ARC, RM 2518, 3077.
b) NACA, TN 1468 & 2674, T Rpt 1105.
c) Lange, ZWB UM 1023/5 (NACA TM 1176).
d) Truckenbrodt, 0012 Deltas ZFW 1956 p 236; also Swept and Deltas, ZFW 1954 p 185.
e) Fink, Delta Plates, ZFW 1956 p 247.
The flow pattern around lifting streamline bodies has been investigated by way of pressure distribution (7,b) (8), measuring boundary layer distribution (6), through visual means, such as smoke (7,a, c), and by surveying the wake (7,a) (12).
Important facts are as follows:
a) As shown in figure 6, the flow around the sides begins as in non-viscous fluid. The “2 alpha” type of flow is evident. It should also be noted that there is some flow around the forebody sides, over the top of the body (circulation).
b) The streamlines do not reach the body’s plane, of symmetry at the upper (suction) side, as expected by theory. In fact, there is a line (as in figure 6) beyond which the direction of the flow at and near the surface of the solid, is reversed.
c) While theory may consider the lift of wings and/or bodies, assuming that a cylinder or a sheet of air simply be deflected (downwash), in reality and by necessity, that stream of air starts immediately and vigorously rolling itself up into a pair of trailing vortices of the type as shown in figure 5.
Vortex Pair. As suggested above, it is not necessary or not even justified, to assume that the reversal of the flow as in (b) above, is “separation.” What we find in lifting bodies, is basically the same flow pattern as around slender (low – aspect-ratio) wings. Quoting from (7,b), “as soon as the incidence is increased from zero, a symmetrical pair of spiral vortex sheets form on the lee side.” At small angles of attack, the point along the body where the trailing pair can first be identified, may be at or possible behind the tail end of the body. As the angle of attack is increased, that point moves forward. As shown in (7,d) and (14,c) the location varies as x/d, /<x and it may reach a final position somewhat ahead of the maximum diameter Figure 5 shows the flow pattern in the plane tangent to the base of an ogive-cylinder body. The lateral distance between the pair of trailing vortices is ~ 2/3 of the body’s diameter. The fact that in figure 4, the vortex “span” is only 1/3 of the maximum diameter, indicates that this body (tapering to a short vertical edge) is less effective in producing lift than the cylindrical body above.
(6) Boundary layer on airship models tested: a) Klemperer, LZ-126 (“Los Angeles”); Aerody Inst TH Aachen 193 2.
b) Freeman, “Akron” Model, NACA T Rpt 430 (1930).
c) ARC, British R-101, RM 1169 & 1268 (1929).
|
SPHEROID AS SHOWN WITH LIFT CORRESPONDING TO CLfa – 0.13
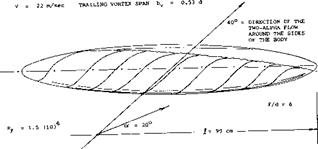
Figure 6. Flow pattern observed (7,a) directly at the surface of a streamline body of revolution similar to that of an airship.
|
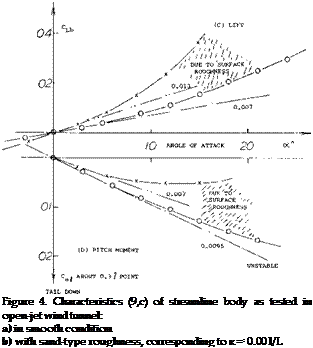
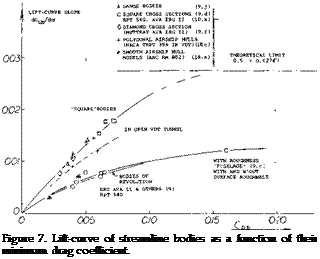
Lift = /(Drag). In a closed streamline body with more or less round cross section, there is no geometrcial definition, neither of the effective area, nor of the aspect ratior and/or the effective span. The only method of obtaining information of lift of such bodies, is statistical. Since the type of lift considered, origianally stems from viscosity and boundary layer interference, it can be speculated that it is a function of the body drag. Normal force derivatives (obtained around zero angle of attack, or zero lift) are plotted in figure 7, as a function of the minimum drag coefficient, representing friction (boundary layer thickness) as well as the “resistance” of the lateral “edges” of the bodies tested, against the flow around them. Figure 4 presents direct proof for the fact that lift increases with drag produced by surface roughness.
(7) The flow pattern around streamline bodies:
a) Harrington, Origin of Lift of Body, Guggenheim Airship Inst (Akron, Ohio) Pub 2 (1935); also J Aeron Sci 1934/1935 p 69.
b) Spence, Flow Structure, RAE Aero 2406 (1955).
c) Maltby, Vortex Suction, RAE TN Aero 2482 (1956).
d) Jorgensen, Vortex Pattern, NACA T Rpt 1371 (1958).
e) Gowen, Inclined Vortex Wakes, NACA RM A53117.
(8) Pressure distribution on slender bodies:
a) Allen, Influence of Viscosity, NACA T Rpt 1048 (1951).
b) Fuhrmann, Ybk Motorluftschiff Studiengesellshaft, 1911; also ZFM June and July 1910; also ZFM 1911/12.
c) Cole, Bodies of Revolution, NACA RM L52D30.
d) Matthews, Theory and Experiment, NACA T Rpt 1155 (1953).
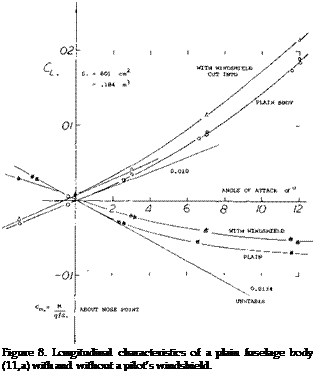
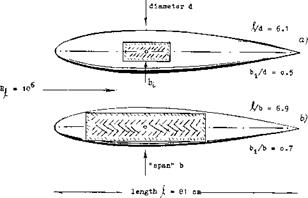
Appendages, a canopy on top of a fuselage or a windshield cut into the fuselage, also increase the lift-curve slope; see figure 8. A drastic example for this type of interference is shown in figure 9. The lift induced in the fuselage by the disk (simulating a very bluff windshield) is as high as that otherwise produced by an angle of attack between 10 and 20 . The lift is evidently obtained by preventing the increase of pressure along the upper side of the afterbody, thus destroying the negative lift originally produced
Square Cross Section. The lifting characteristics of three bodies differing in cross-section shape, are plotted in figure 10. The left curve slope of these bodies and others are given in figure 11. Physical interpretation of the data is as follows:
a) Plain, smooth and round streamline bodies have little lift, their flow pattern is closest to the ideal, without circulation.
b) Lateral edges particularly in form of square cross section help to make streamline bodies lifting. Even the edges of polygonal airship hulls are sufficient possibly to double the lift-curve slope.
c) 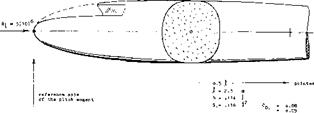
 A full shape of the afterbody, ending in a blunt base, does not directly contribute to circulation. A wide afterbody reduces or may even eliminate any negative loading, however, so that the resultant normal force is increased to two – or threefold compared to smooth and round streamline bodies ending in a point.
 (Tarabolic,> Bodies. The lift and moment of a series of bodies formed by parabolic arcs are shown in figure 12. Their afterbodies, which reduce in width to lA of the maximum at the blunt base, cause a reduction of the lift compared to that of equation 3. For example, the shapes with span/thickness ratio b/h = 1.0 and 1.5 have dCLb /doc values between 0.005 and 0.008, which is roughly Уа of that of slender cones. As the span/thickness ratio is increased these bodies more and more develop into
(9) Plain and round fuselage bodies:
b) Several Shapes, AVA Gottingen Rpt 1934/03.
c) Engelhardt, Roughness, TH Munich Aerody Lab Rpt
1/1943.
d) Goodman, Fineness Ratio, NACA T Rpt 1224 (1955).
e) Hollingworth, Length Ratio, W’Rpts L-8,12,17 (1945).
f) Muttray, AVA Results, Lufo 1928/29 p 37; as (10,a).
g) NACA, Length Ratio, TN 2358 & 2587: T Rpt 1096.
h) Queijo, Length and. Shape, T Rpt 1049 (1951).
j) Lange, Eight Shapes, ZWB FB 1516 (194); NACA TM
1194.
k) Gillespie, M = 1.7 &^/d = 17, NACA RM L54G28a.
|
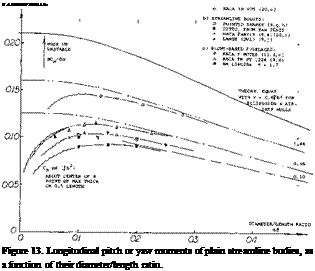
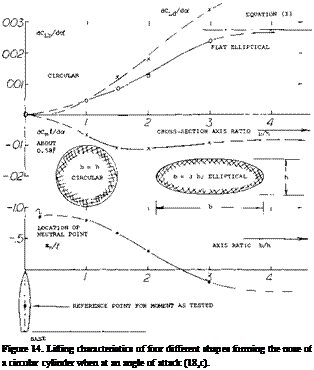
“wings” with lateral edges. It should be noted that cross – section shape, rather than fineness ratio jh (or any other of the parameters used in this analysis) determines lift and longitudinal moment. In fact, at b/h = 3, the lift derivative is already 0.024 which is close to that of equation 3. The moment derivative (about the 0.58 point) is comparatively constant (around —0.01) and it fits sufficiently well into figure 13.
|
|
 |
|
a) body of revolution
b) with square cross section
c) same body at 45 degrees
The bodies have all the same e^.ze cross – eeotion area, corresponding to s я Q
|
|
|
The coefficients are based on this area. Moments are not reported.
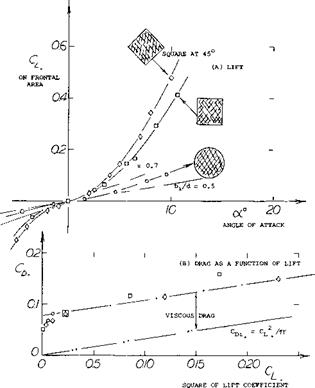
Figure 10. Lifting characteristics of streamline bodies of differing cross section, tested by AVA (10,a).
|
|
|
Figure 9. Flow pattern around, and lift “induced” by a circular disk attached to the streamline body as shown (9,c).
|
|
|
Boundary Layer. In an ogive plus cylinder combination, the afterbody is theoretically not expected to produce any lift, particularly not at small angles of attack. There is consistent evidence (8,a) (14,a, c), however, to the effect that such bodies have linear lift derivatives larger than indicated by equation 3. An explanation may be found in the growth of the boundary layer (displacement) and/or the mass of air within boundary layer and wake added to that originally deflected by the body. The effect seems to be in the order of
Д (dCLb /doc) = (0.0001 to 0.0002) Д/d (8)
In the shapes with cylindrical afterbodies, as in figures 12 and 15, for example, the increment is in the order of 10% of the lift indicated by equation 3. Experimental results are assembled in figure 16.
|
|
|
(11) Airplane fuselages, experimental:
a) Brennecke, Fuselage Shapes, AVA Gottingen Rpt 1935/41.
b) Gruenling, Me-109 in AVA Tunnel, ZWB Dct UM 7857 (1944).
c) Imlay, Yaw Derivatives, NACA TN 636 (1938).
d) Hoerner, Correlation, Ybk D’Lufo 1944, Rpt IA,022.
|
|
|
(10) Fuselage bodies with various cross-section shapes:
a) Square Cross Section, Erg AVA Go Vol II (1923).
b) Bates, Various Shapes, NACA TN 3429 (1949).
c) House, Elliptical Cross Section, NACA T Rpt 705 (1941). e) Letko, Cross Section Shape, TN 3551 & 3857 (1956).
|
|
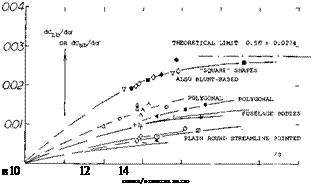 |
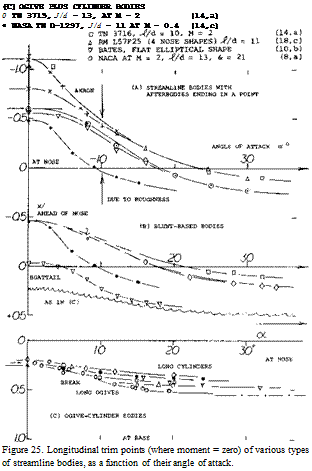
■ ЫАСА TN 3857 "SQUARE" AND BLUNT-BASED 0 NACA TN 636 AIRPLANE FUSELAGES ROUND & SQUARE V NACA BLUNT-BASED "FUSELAGES" TN 2504 & 3649 – AVA SQUARE AND ROUND, ERGEBNISSE II О NACA BARE POLYGONAL AIRSHIP HULLS TR 394
•  ARC POLYGONAL AIRSHIP HULLS RM 779 & 799 ©ARC SMOOTH AND ROUND AIRSHIP HULL RM 802
-t – NACA SMOOTH AND ROUND FUSELAGE BODIES TN 636 X Me-109 FUSELAGE MODEL, AVA RPT
* TH MUNCHEN, SMOOTH AND ROUGH STREAMLINE
0 AVA STREAMLINE BODY
D NACA POINTED STREAMLINE BODIES RPT 1096
1 RECANT, PLAIN AND ROUND WR PT L-12 & 459
Л NACA TN 636 ROUND FUSELAGES W’TRAILING EDGE ♦DITTO, FUSELAGES WENGINES, RADIATORS, CANOPIES
Figure 11. Lift-curve slope of various types of streamline bodies as a function of their fineness ratio.
|
reference point fcr
moment, at 0.57,1*
|
|
diameter d ■ б inch point of reference 0.58 S. = о.0075 і2 = constant
|
|
|
асЇЇЬ/.ісА= O.035
о.90——————- Ф
dC^/dtx, = 0.008
|
|
|
|



= O.027
= о.012 = o.032 – О.013
Figure 12. Lifting characteristics of a series of four bodies (I3,e) with elliptical cross section shape. TN 4362.
(12) Influence of appendages:
a) Jaquet, Fuselage with Ducts, NACA TN 3481 (1955).
b) AVA Gottingen, Windshields, Test Rpts 1934/03 & 1935/41.
In the previous section the linear circulation-type component of the lift of streamline bodies was covered. As the angle of attack and/or the fineness ratio is increased, a second and non-linear component of lift or normal force originates. This component of lift is similar.
Circular Cylinder. Within the range of very small angles of attack, the rear end of a low aspect ratio rectangular wing does not contribute anything to lift. However, as the angle of attack is increased above a few degrees, the component of flow normal to the wing becomes significant in magnitude. As a consequence, a “second” and non-linear lift or normal-force component develops. The mechanism producing this component can be better understood, when first considering a long circular cylinder (with aspect ratio A = d/i —^ zero) inclined against the oncoming fluid flow. The experimental results of such cylinders, presented in figure 9, apply to, Reynolds numbers below the critical (which is around R^ = 3(10)5). Disregarding a small component of skin friction drag in longitudinal flow (at small angles of attack) there are only normal forces; and the resultant force is split up geometrically into:
D = N sinot
L = N cosoC (9)
(13) Blunt-basedfuselage bodies:
a) Loving, Boat-Tail Comparison, NACA RM L52J01.
b) See references (9,d)(10,b)(10,e).
c) Goodman, Configurations, NACA TN 2504 (1951).
d) Wolhart, Various Configurations, NACA TN 3649.
e) McDevitt, Family of Streamline Bodies, NACA TN 4234, 4280, 4362.
Figure 16. Experimental results showing the increase (due to viscosity) of the lift-curve slope of cylindrical bodies with their length ratio.
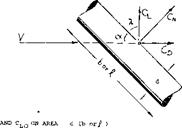
Cross Flow. At the angle of attack oc = 90 , the drag coefficient of the cylinder is
COo =СЛ/9с=СС CO)
based on cross-flow area (.(d). For the cylinders as in figure 17, this coefficient is between 1.1 and 1.2. When the angle of attack is less than 90°, it is now speculated that the normal force corresponds to the cross-flow dynamic pressure
qw= 0.5 p w2 = 0.5 f (w/V)2 У (11)
where the component of the speed V normal to the cylinder axis is w = V since, and (w/V) = sin2 oc. The velocity component parallel to the cylinder axis, V cosa, does not contribute to the cross-flow pattern around the body. Using now the cross-flow coefficient Cc , the cylinder’s normal force corresponds to
CN = N/qd^ = Cc sin2oC (12)
Using equation 9 the two components of this coefficient are then
CD = Cc sin3 oC (13)
CL = Cc sineo£ cos<x =Cc sin(2od) (14) Figure 17 confirms these functions fairly well.
|
усв = 1.1 Sin3 of +.02
V*
/9
|
|
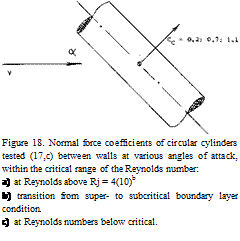
Below the critical Reynolds number, see for example in Chapter III of “Fluid-Dynamic Drag.., the cross-flow coefficient of the circular cylinder is fairly constant (Cc^ 1.2). Above Rd = 4(10)5, cylinder drag coefficients are known to be much lower; at the level of CDo = 0.3. Within the transition range, it must be realized that the “effective” Reynolds number varies with the angle of attack. While at at = 90 , Rj (on diameter) is the proper indication for the flow conditions within the boundary layer, the length of the cylinder would rather be responsible at angles of attack near zero. Experimental results within the critical range, as in figure 18 demonstrate complications as follows:
a) Due to friction and boundary layer growth in tangential direction, the cross-flow coefficient at lesser angles of attack, is in between the sub – and supercritical level; it is in the order of Cc =0.6.
|
|
|
й A WIRE, ARC (a)
О • WIRE, GERMAN (b) 0 CYLINDER, NACA (e) X CABLE, GERMAN (b)
|
|
|
|
 |
|
oC cos. of

|
|
|
|
|
|
|
|
|
b) As the angle of attack is increased, the effective R’num – ber may reduce to below the critical. As a consequence, the cross flow coefficient increases in one set of experimental results to Cc = CDo = 1.2.
|
|
|
Figure 17. Lifting characteristics of circular cylinders at Reynolds
numbers below the critical (where C = 1.1) as a function of
cross
their angle of inclination.,
|
|


c) Within the range of sufficiently high Reynolds numbers, the cross flow coefficient reduces to Cc = CDo = 0.2. This very low value is supercritical.
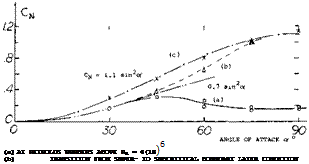
Evidently, in round bodies, the cross-flow mechanism produces the highest lift at higher angles of attack (above oc = 60°) and/or at Reynolds numbers definitely below the critical.
 Transition. At small angles of attack, there will be a perfectly symmetrical slender-wing-type flow pattern as in figures 4 and 5. It is also well known that at very high angles of attack (say at <x = 90°) and at Reynolds numbers below the critical (say below 3(10)6 on body diameter), the flow pattern is that of the alternating (in side and time) Karman vortex street. Between the two extremes, a transition takes place in two steps. Experiments on slender streamline bodies reported in (19) describe the first of these. At a certain angle of attack, the magnitude depending on Reynolds number, the flow pattern past the nose of a slender streamline body ceases to be symmetrical. The critical angle may, for example, be 20° (decreasing as the R’number is increased).. Above the critical angle, the flow “separates” from one side of the nose, thus giving rise to a steady yaw moment to the other side. As the flow progresses along the length of the body,
a second vortex forms at the other side; and the “separation” switches to that side. At the same station, the first vortex detaches itself from the body. The resultant values of lift and drag do not seem to depend on the type of symmetric or unsymmetric vortex formation. The pattern described is still “static” (no fluctuations). It seems, however, that here is the beginning of the second step, the alternating type of vortex street as we know it to prevail at higher angles of attack. Fluctuating values are connected with this flow pattern, of drag and lateral forces, and most likely of lift and yaw moments.
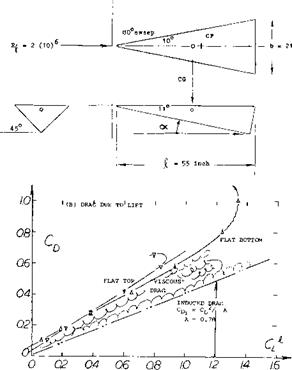
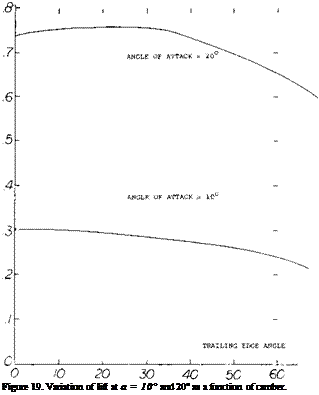
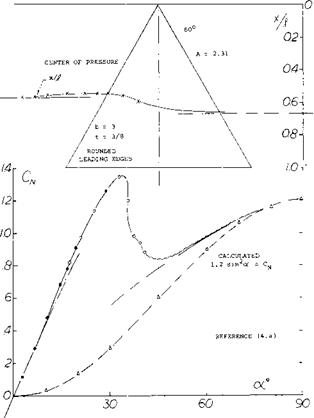
Pyramidal Shape. Since cones can be used as lifting devices, the delta-type body as in figure 19, having triangular cross sections will also develop lift. The shape was tested both with the flat side forming the top and the bottom. Note that the angle of attack is defined as against the ridge line. The flat top or bottom is evidently more effective, however, than the “V” shaped side since,
a) The lift-curve slope is higher in the flat-bottom configuration. The derivative (near zero) is practically equal to the theoretical value, (equation 3, with CL based on projected “wing” area.
b) The non-linear component of lift or normal force corresponds somewhat more to the angle of attack of the flat side than of the ridge line.
Drag. Assuming that the non-linear force really varies as CM2 — sinaoc, an average cross-flow coefficient can be evaluated in the order of Cc =1.0.
Extrapolation to oc = 90° , suggests on the other hand:
CDo = 0.9 for the flat-top configuration
= 1.3 for the flat-bottom shape
The linear component of lift (equation 2) is supposed to reach a maximum at 45 , and to reduce to zero at 90°. Between 40 and 45°, the is some discontinuity; it seems that the flow “separates”, or that the flow pattern changes into the alternating type mentioned above. We may speculate that the circulation type of lift breaks down at this point.
(14) Characteristics of ogive-cylinder bodies:
a) Perkins, Normal Forces at M = 2, NACA TN 3715 & 3716 (1956).
b) Jorgensen, Flow Pattern, NACA Rpt 1371 (1958).
c) Tinling, Pressure and Wake, NASA TN d-1297 (1962).
|
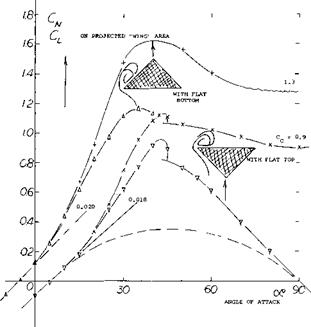
Figure 19. Aerodynamic characteristics of a basic reentry vehicle body as tested (43,b)(2,c) at 60 ft/sec.
(A) Lift and normal force as a function of the angle of attack.
|
(15) Characteristics of ducted bodies:
a) Theory, see (62) on “ring wings” in the “wing” chapter.
b) Fletcher, 5 Annular Foils, NACA TN 4117 (1957).
c) Brown, Open-Nose Bodies, NACA T Rpt 808 (1945).
d) Brown, At Supersonic Speeds, NACA W’Rpt L-720 & -728 (1946).
(16) Ganslen, Aerodynamics of the Javelin, Univ of Arkansas Rpt 1960.
Within the range of lesser angles of attack, say to 30 or 40°, the drag is compared to the lift, figure 19. Although there is a considerable amount of drag due to viscous vorticity, the experimental functions show some similarity to that of the theoretical induced drag. Optimum lift/drag ratios of the “vehicles” are found at comparatively small lift coefficients:
L/D = 2.9 at CL = 0.3 for the flat top,
= 2.6 = 0.2 for the flat bottom.
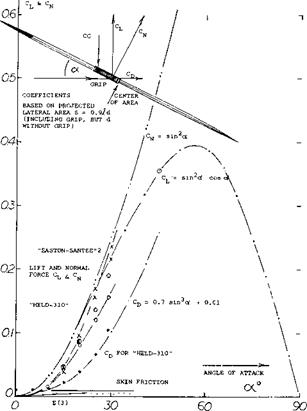
A Javelin is basically a streamline body with extremely high fineness ratio. Typical data as for a type used in competitions, are as follows:
= 100 inch length d = 1 inch f/d = 100 S =1.35 ft wetted area
W =1.75 lb weight
V — 60-80 ft/sec speed x = 38% center of gravity
x = 45% center of area
|
|
Lift and normal forces as tested in a wind tunnel are shown in figure 20. Evaluation yields a cross-flow coefficient between 0.6 and 0.7. Near oc = 0, where the Reynolds number on length, is = 5(10)b, boundary layer conditions must be turbulent, possibly 1 foot from the point. However when operating at a: = 90°, the Reynolds number based on the diameter rather than length is no higher than R^ = 5(10)4. Therefore, the cross-flow coefficient must be expected to increase from the 0.6 level near с* = zero, to between 1.1 and 1.2 at oc = 90°. In fact, at оc = 30°, one of the javelins tested, appeared to have a Cc =0.9. The minimum drag/lift ratio is found (16) at c*r = 25°, in the order of D/L= 0.60. For comparison, equation 9 suggests a value of D/L = since /cosoe = 0.47. The difference must be due to tangential forces skin friction and the drag of the grip protruding from the otherwise smooth surface. When throwing javelins, average angles of attack someshat above 25° seem to be best.
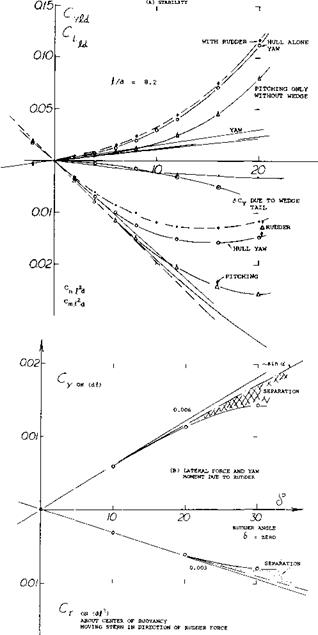
Airship Hull The lateral force characteristics of the bare hull of an airship are plotted in figure 21, where the normal force coefficient is based on the “lateral” area (d-0; subscript Although this hull was only tested up to the angle of sideslip j5 = 20 , extrapolation to 90° is possible in the following manner:
a) Near = 0, the linear (circulation-type) component of the normal force coefficient (on -{b) seems to be
CNo = 0.0015^3° ; dCNb/daC = 0.0015 Ц/d) = 0.012
For the minimum drag coefficient (on b2) CDb = 0.06, the corresponding value in figure 7, reflects the fact that the airship has a polygonal cross section (with a number of longitudinal edges).
b) Equation 2 indicates that the circulation reduces to zero when approaching the angle /3 = 90°. It may be assumed, however, that the circulation-type of lift discontinues far below this angle as a consequence of separation.
c) The non-linear component is assumed to be as in equation 8. Using the value at j& = 20°, the cross flow coefficient is found to be Cc^Q = 0.35, so that:
А Сд/^5 = 0.35 sin2 oC
At higher angles of attack, we have plotted this component, assuming that the linear type of lift would be


The value 0.35 (on b>f) represents a cross-flow coefficient on projected lateral area CCo = 0.41, which is very reasonable for the polygonal shape considered, at Reynolds numbers above the critical. However, if one would really have tested the airship hull at/5 = 90°, its proper R’number (on diameter) would have been a little above 105, (instead of 10b, on length when near /в = 0). The cross- flow coefficient would then have been in the order of
|

seen from below full-scale dimensions:
|
|
d
|
= 84
|
ft
|
|
a
|
= 8.2
|
* d
|
|
s.
|
= 550
|
ft2
|
|
s+
|
= 0.83 –
|
-(a/)
|
|
Sh
|
= о.05 j
|
• (4Jt)
|
|
V
|
= 0.83
|
* JP
|
|
model test (RM 799):
1 to 200 scale
V = 40 ft/sec
Rj * 106
= o.07 bare hull)
Cjj =o.09 minimum
= 0.13 with 7 "cars"
|
|
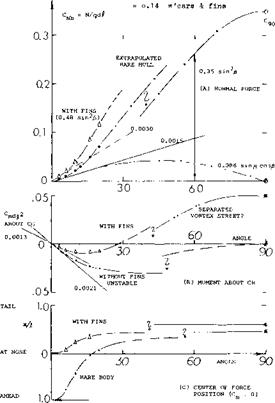
Figure 21. Characteristics in pitch and/or yaw of the hull of the British airship R-38 (ZR-2) as tested (20,b) on a 1/200 scale model.
|
Drag characteristics of the hull may add to the understanding of the flow pattern. The coefficient (on d2") is approximately:
CDd = 0.06 within oc= plus/minus 7°
= 0.22 at oc = 20°, almost 4-fold
= 2.90 at oc = 90°, see above
Roughly, the pressure drag and the second component of the normal force, grow in proportion to each other.
The cores of the pair of trailing vortices shown in figures 4 and 5, contain the momentum losses corresponding to the viscous drag of the body., The downwash of the flow field and/or the circulation of the vortices represent the induced drag of the body. As explained in Chapter VII of “Fluid-Dynamic Drag”, this type of drag can be expected to correspond to
CD>b _CLb/’TT’
which is the basic equation for wings regardless of their aspect ratio. The slope of the experimental values in part (B) of figure 10, shows fair agreement with this equation. The low drag coefficients near zero lift, are believed to be the consequence of a more laminar flow, particularly along the upper side of the bodies tested.
Equivalent Wing. Considering the square shape in figure 10, its lift-curve slope (around zero angle of attack) is dCLb/do<: = 0.014. In comparison to equation 3 this value corresponds to the ratio
(b,/bf = 0.014/0.0274 «0.5
so that the effective span is found to be bj = v/0.5 b. This span is shown in the drawing of the body. The chord of the equivalent “wing” is estimated on the basis of the tested “second” component of lift, corresponding to
Д CLb = 8 sinz c*
Assuming that a flat plate would produce Д CL =2 sin2 oC, the chord of the equivalent rectangle as shown in the illustration, can then be calculated. In comparison to the body of revlolution (having the same volume) the square shape is seen to have about twice the lift-curve slope, and 3.6 times the non-linear lifting capacity.

![]()
![]()
![]()


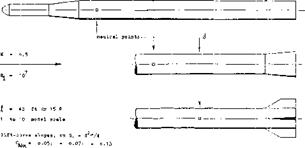
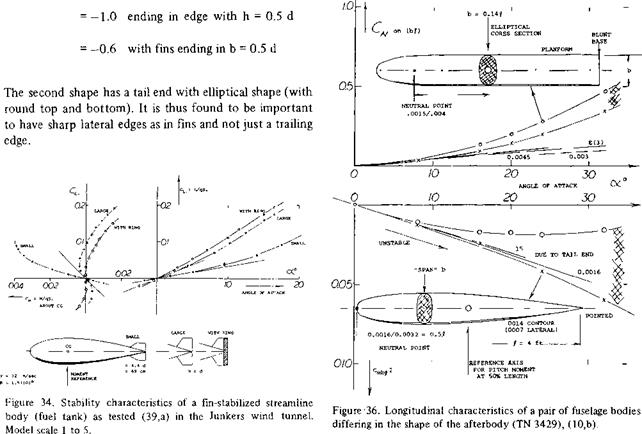
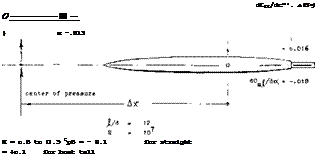
 where A x = distance measured from the center of gravity or the reference point about which the moment is tested, positive when downstream. Since stability of bare streamline bodies is usually “negative”, the neutral point is forward accordingly. In fact, it may be located far ahead of the body’s nose, such as x = —^, for example.
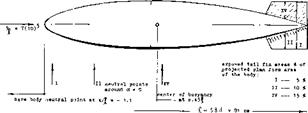
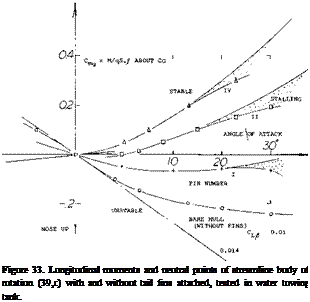 d = o.10j[
![]()

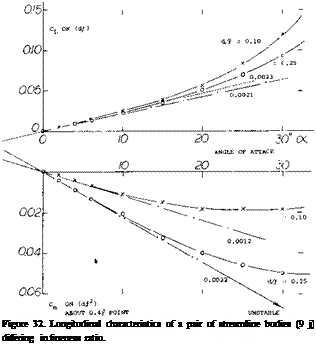
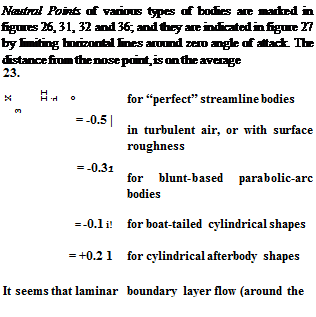
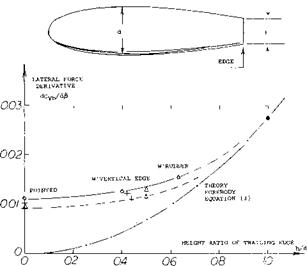
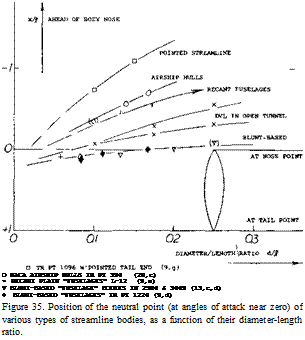 The yaw-moment derivative of the airship hull and those of a few other “fuselage” bodies having a wedge-like afterbody shape, are plotted in figure 39. The results correlate with equation 3. A modification similar to that in figure 37, is shown in figure 38 of Chapter XIII. In that case, the neutral point is located ahead of the body’s nose, at
![]()
![]()


![]()
![]()
![]() X = 804 ft AT AVA (34. a!
X = 804 ft AT AVA (34. a!![]()
![]()
![]()
![]()





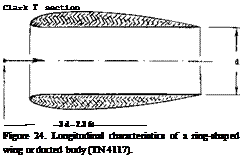 Ducted Body (15). We do not have suitable experimental results at hand, at this time, showing the influence of an axial duct upon lift and longitudinal moment of a slender body. Considering an open cylinder with unobstructed axial flow through its length, the deflection of the volume of air produces theoretically
 V NACA "PARABOLIC" BODY WITH BOATTAIL (17,e)
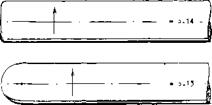
 Nose Shape. Results of a cylindrical body are presented in figure 14, for several shapes of the forebody:
 Cylindrical Middle Body. There are streamline shapes such as possibly in airship hulls or fuselages, where a considerable part of the length is cylindrical. Basic theory expects destabilizing lifting or normal forces to originate in the bow and the stern, while the cylindrical middle body is not supposed to contribute to force or moment as far as small angles against the wind are concerned. Since the bow and stern have a considerable moment (about the center of buoyance or the CG) such partly cylindrical bodies may have larger moments than truly streamline shapes (with the same fineness ratio).
 Delta Wings. The derivative of the linear (circulation-type) component of lift as in equation (3) is the same as that for small aspect ratio wings, Chapter XVII. In fact, the cone in figure 1, with b = 6 t, can very well be considered to be a delta wing. Experimental results of another family of elliptical cones (with b = 3 t = constant) is plotted in figure 2. At larger values of the length ratio, the same average level is obtained as in figure 1. At the other end of the scale, the aspect ratio increases toward infinity. For example, at^/b = 1, the ratio is A = 2 hz /ЪХ – 2 (b/jf) = 2, which is no longer slender. Modifying equation 6 in Chapter III to (12 + (10/A2 ) + (20/A)); and replacing A by 2 ЪЦ, we can write
 Elliptical Cones. The forces discussed do not correspond to the volume of the body, but to that of the air affected by the body. The cylinder of air deflected by a conical body corresponds to its “span” b (see figures 1 or 2). Therefore, to accommodate cones with cross-section shapes other than circular, it is best to refer their lift to

 — о. З X—1>"


 A full shape of the afterbody, ending in a blunt base, does not directly contribute to circulation. A wide afterbody reduces or may even eliminate any negative loading, however, so that the resultant normal force is increased to two – or threefold compared to smooth and round streamline bodies ending in a point.
 (Tarabolic,> Bodies. The lift and moment of a series of bodies formed by parabolic arcs are shown in figure 12. Their afterbodies, which reduce in width to lA of the maximum at the blunt base, cause a reduction of the lift compared to that of equation 3. For example, the shapes with span/thickness ratio b/h = 1.0 and 1.5 have dCLb /doc values between 0.005 and 0.008, which is roughly Уа of that of slender cones. As the span/thickness ratio is increased these bodies more and more develop into


 ARC POLYGONAL AIRSHIP HULLS RM 779 & 799 ©ARC SMOOTH AND ROUND AIRSHIP HULL RM 802




 Transition. At small angles of attack, there will be a perfectly symmetrical slender-wing-type flow pattern as in figures 4 and 5. It is also well known that at very high angles of attack (say at <x = 90°) and at Reynolds numbers below the critical (say below 3(10)6 on body diameter), the flow pattern is that of the alternating (in side and time) Karman vortex street. Between the two extremes, a transition takes place in two steps. Experiments on slender streamline bodies reported in (19) describe the first of these. At a certain angle of attack, the magnitude depending on Reynolds number, the flow pattern past the nose of a slender streamline body ceases to be symmetrical. The critical angle may, for example, be 20° (decreasing as the R’number is increased).. Above the critical angle, the flow “separates” from one side of the nose, thus giving rise to a steady yaw moment to the other side. As the flow progresses along the length of the body,



![COMPRESSIBILITY EFFECTS - DELTA WINGS Подпись: and Ky = Tf[(16-(A/3 )Z)(A2 + 16)/Z/16E2 (15) where E = elliptic integral of the second kind where modules = [1 ~( cotAT p )2]/2. In this case /3 = /мї - 1. In (12,d) comparisons of the calculated results of equations (14) and (15) with test data indicate good agreement.](/img/3130/image1243_1.gif)



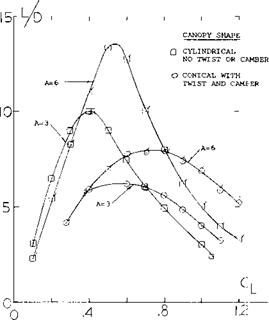
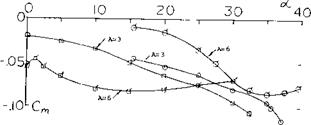
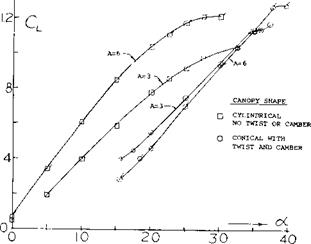
 Polhamus, Experimental and Theoretical Studies of Parawings A = 3 and 6, NASA TND-972.
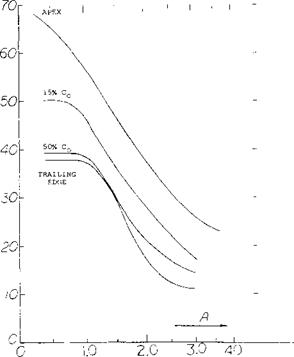
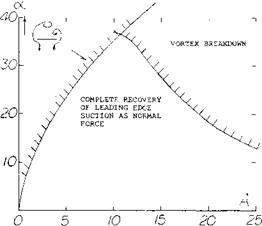
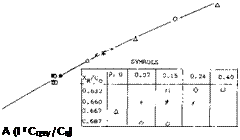
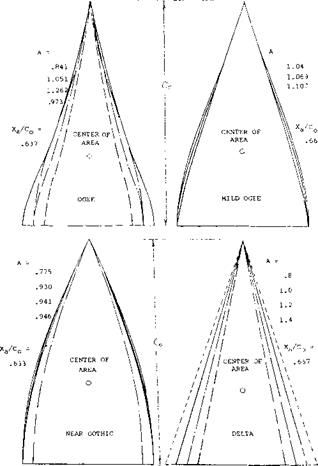
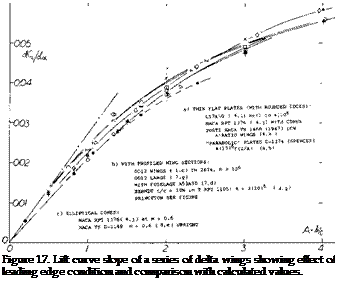 where b’ = the span at a distance b/2 from the trailing edge. For the range of aspect ratios considered good correlation is obtained when the corrected slope is plotted as a function of o(c /А, figure 16. At /А above 20 the correlated data is below that calculated by theory equation 3, figure 10, indicating the vortices have started to break down in lift effectiveness.
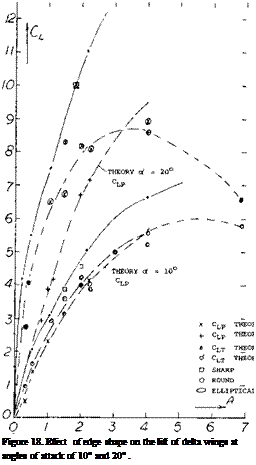
 <L
<L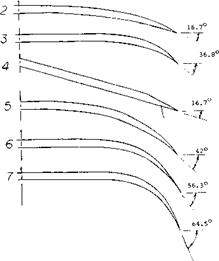
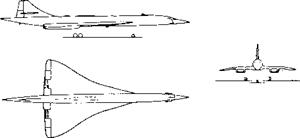
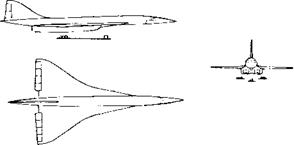 RUSSIAN TU-144
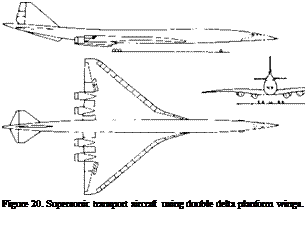
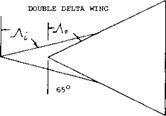
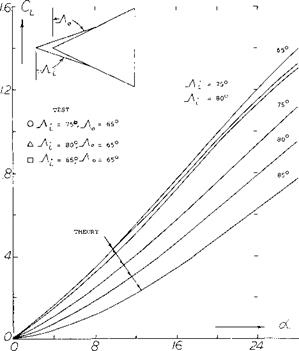
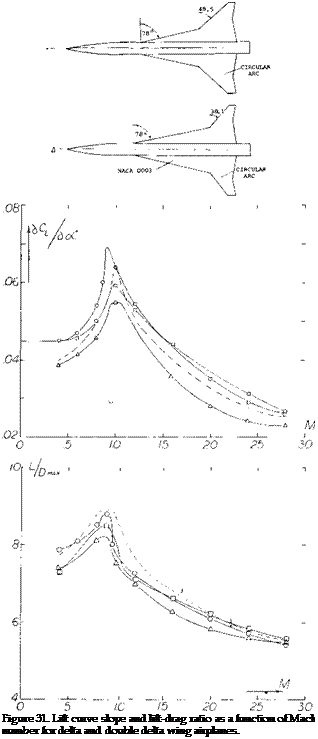
 Corsiglia, Aircraft Model Double-Delta Wing Longitudinal and Lateral Characteristics, NASA TN-5102.
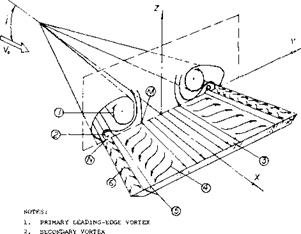
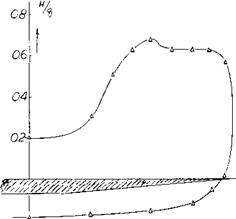
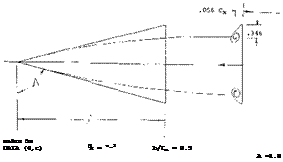
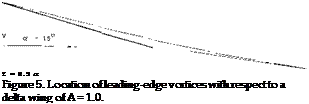
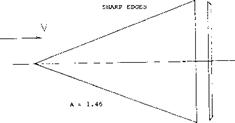
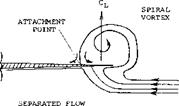
 Leading-Edge Vortices. The leading-edge vortices of delta wings have been observed and measured by several investigators (1). Many techniques including tuff surveys, oh film studies, condensation trail photographs and water tunnel studies have been used. Based on these observations the vortex flow pattern for a typical wing is illustrated in figure 3. Vortex sheets are shed off the leading-edges and blow back over the upper surface rolling up to form a pair of stable vortices. These vortices appear on top of the wing and increase in intensity downstream from the apex. By the time the vortex sheet reaches the wing trailing-edge it is fully developed. The pressure differential between the upper and lower surfaces causes the flow velocity and the formation of the leading-edge vortices. As would be expected the pressure difference increases with angle of attack with a resultant increase in the strength of the vortices. As the apex angle of the delta wing decreases, a reduction of aspect ratio, the tip vortices on either side will interfere. The tip vortices on the upper surface of the wing proceed downstream at a downwash angle corresponding to the lift of the wing until they break up.
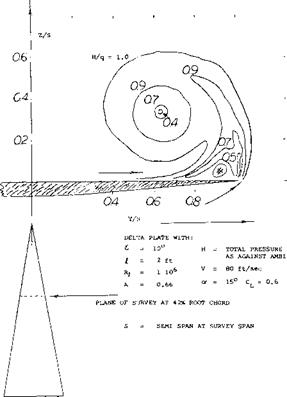
 The initial slope of the lift curve at zero angle of incidence represents the linear portion of the lift curve and is equal to the potential or circulation lift of the wing. This portion of the lift curve is the same as was observed in the case of low aspect ratio wings and can only be estimated at zero angle of attack from the experimental data. Above this angle the potential flow lift follows a sin cosa oC function indicated by theory as discussed in the next section.
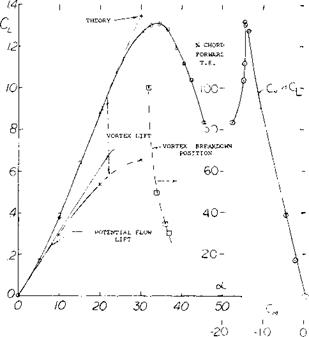
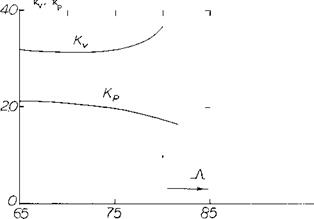
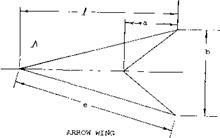
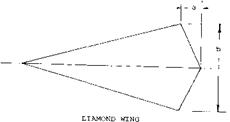
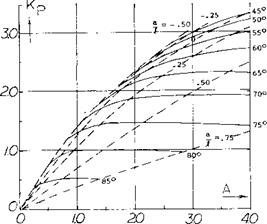
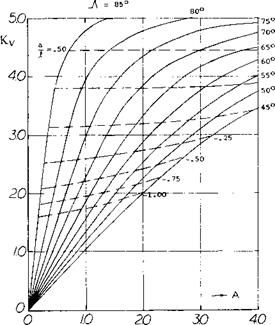
 Since К p is dependent on the planform it has been found by a suitable lifting-surface theory (5,3) as a function of aspect ratio for delta, arow and diamond shape wings and is given on figure 9. The lift coeeficient due to potential flow is then calculated using equation 1 and a value of К p from figure 9, which depends on the planform of the wing.
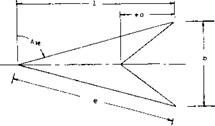
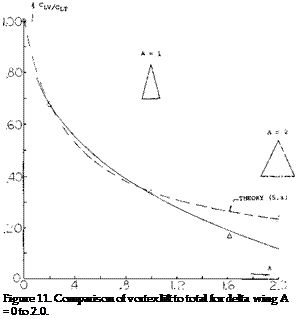
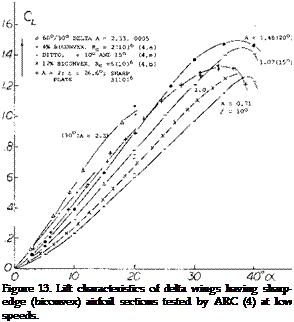
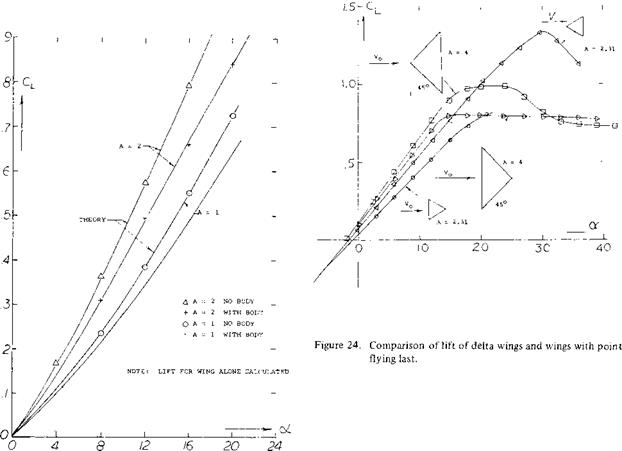
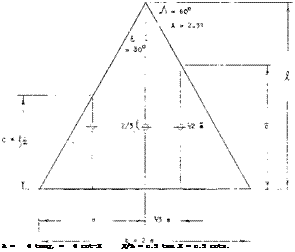 Triangular wings with a straight trailing edge (point flying first) are called delta wings, according to their resemblance with the Greek letter A . At least in larger aspect ratios they can be considered to be wings with zero taper ratio (pointed wing tips) and with a swept-back 4 chord line. Such wings would be impractical, however, because of wing-tip stalling and low lift drag ratios at subsonic speeds. Rather, delta wings are primarily designed for supersonic speeds. Their leading edges are highly swept so that the aspect ratio is usually small. Thus, the lift drag ratio at subsonic speeds is low. The leading edges of delta wings are also lateral edges. Circulation around such Ages is obviously different from what was originally meant by that word in two-dimensional flow past airfoil sec:ions; and the flow pattern is essentially different from that of straight wings, within the range of aspect ratios as used in airplanes.