Category FLUID-DYNAMIC LIFT

DIRECTIONAL CONTROL OF AIRCRAFT

The deflection of the rudder will cause the development of a lift or lateral force that will generate a yawing moment, causing the airplane to seek a new sideslip angle heading. The change in the sideslip angle heading is gen­erally directly influenced by the rudder angle deflection. The center of the lateral force on the rudder can be well above the CG of the airplane which will induce a rolling moment that requires crossed controls if a steady sideslip is required.

Design Requirements. The design requirements for the rudder depend on the type of airplane. For light single engine the rudder design will be based on the sideslipping needed for control of the glide path and alignment of the runway during landing. Thus when operating in a cross wind it is necessary to have a sideslip angle so to touch down the rudder is reversed to allow the aircraft to be aligned to the runway.

The most critical requirement for the rudder is the coun­teracting of the yawing effect of a failed engine on multi – engine aircraft. This is especially true with aircraft having the engines well outboard on the wing so that large moment arms are involved. With some of the early large turboprop aircraft it was necessary to consider not only the loss of thrust due to the failed engine, but also the possibility of negative thrust due to the propeller develop­ing reverse thrust. In the case of the latter condition the rudder design problem became impossible, thus requiring other solutions.

The conditions for the rudder design are determined by the civil air regulations which define a minimum control speed parameter, VMC > where with the most critical en­gine out it must be possible to maintain straight flight with zero yaw. The minimum control speed is usually tied in with the stall speed with power and the most aft CG location. Thus, the rudder must be designed to provide sufficient lateral force so that the yaw moment exceeds that exerted by the engine out conditions.

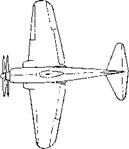
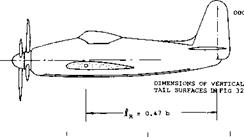
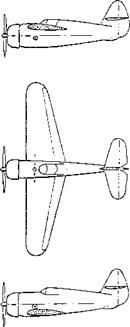
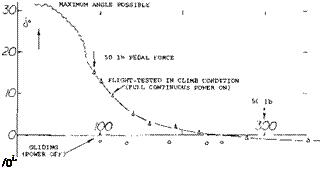
Rudder Control Basically, the effectiveness of the rudder depends upon the flap chord ratio c^/c. As described in the Chapter IX, effectiveness may statistically be indi­cated by the parameter dfi/d6 ^ 0.5. This value means that deflection of the rudder by 6 – 1° , changes the lateral force as much as it would be changed by a differ­ential of the sideslip angle = 2° . Single-propeller airplanes, such as the fighter in figure 40 for example, have a directional trim or rudder problem. Because of slipstream rotation, the vertical tail is blown to one side. For a right hand propeller, therefore, the airplane tends to turn to the left. The rudder angle required to prevent turning and/or sideslipping, is plotted on figure 41 as a function of the indicated airspeed. To reduce rudder de­flection and force required, the fin is usually built onto the fuselage at a small lateral angle, such as iv = 2° in the P-51, for example. Around V = 240 mph, where the rudder angle is zero, the average sidewash angle due to full-power slipstream is evidently equal to that of the tail setting. The rudder angle required for trim grows consider­ably as the airspeed is reduced.

Analysis. We will assume that power and torque Q of the engine be constant. The average speed w representing slipstream rotation is roughly

w —’ Q/SPV

where SpV = approximation for the rate of volume (and mass) flow through the propeller disk. The sidewash angle is then

w/V 1/Ve (31)

We have plotted in part (B) of figure 40, the rudder angles required for trim, versus l/V8. The function obtained is essentially linear. There are certain secondary effects to be considered, however:

a) For maximum rudder pedal forces of plus-minus 50 lb, some elastic deficiency can be assumed in the rudder angle as recorded.

b) At 90 mph, where the pedal force is 50 lb, the phot is evidently tired to do more. The airplane is sideslipping at/5 = 10°.

c) In the analysis above, the Slipstream velocity v (added in downstream direction) is disregarded. The sidewash angle is actually w / (V + v).

Sideslipping as in (b) can theoretically be eliminated by deflecting the rudder further, corresponding to

Ad = ^(dcT/d/S)

where the derivative has the value of 0.8, as tested for the same condition of flight. Considering elasticity as in (b) above and on account of (c) above, the upper line in graph ■(B) must be expected to level off. The value required at V ■- 0, at the start of the take-off run of the airplane, might be the maximum possible rudder angle, which is 32° for the P-51. If the vertical tail were not be within the slipstream, it could be difficult to handle the P-51 or arty other single-propeller airplane while taxiing on the ground, particularly in lateral wind.

Sideslipping To – increase the drag control the rate of descent and align the airplane With the runway slide­slipping is used. To prevent the airplane from sideslipping, the ailerons have to be deflected thus providing an angle of bank. In steady-state and straight sideslipping inotion, conditions are as follows:

the rudder balances the yaw moment, also producing some lateral forge,

the ailerons balance the roll moment, keeping the airplane banked,

a component of the airplane’s weight counteracts the lateral force.

Sideslipping is also a convenient method of testing in flight, stability, control effectiveness, and forces necessary to deflect the control elements.

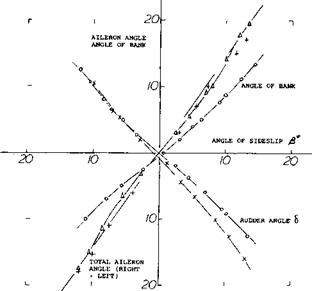
Flight Testing. In an airplane flying in any steady-state equilibrium, there are no “free” moments. Besides speed, all there is to be measured are angles. For one of the many airplanes investigated (31)(33) typical flight-test results are presented in figure 41. The graph shows

the rudder deflection required the aileron angle required the angle of bank required

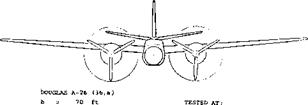
all as a function of the angle of sideslip, gliding at one particular speed of the resulting straight motion, and at the constant lift coefficient CL – 0.6. The aileron deflec­tion neutralizes the roll moment primarily originating in the wing as a consequence of dihedral. From the frontal view of the airplane tested, it is evident that there will not be much of interference between the slipstreams and the central vertical tail. Therefore, results in cruising (power – on) condition are not very much different from those shown in gliding (power-off) condition, for that particular airplane.

DIRECTIONAL CONTROL OF AIRCRAFT

S = 540 ft2 v = 190 mph

d = 12.5 ft q = 92 lb/ft2

65 – 215 WING SECTION

2 2000 HP

DIRECTIONAL CONTROL OF AIRCRAFT

Figure 41. Characteristics of a twin-engine airplane in steady sideslipping motion (33,a).

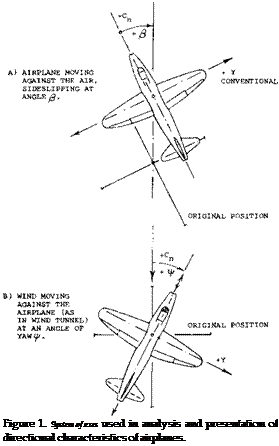
Lateral Force. In banked condition, the component of the airplane’s weight in lateral direction is Y = W sin <p, where (f = angle of bank. The lateral force derivative is thus found to be

dCу /d/З = {rf1180)(d у /d/З)(W/qS) (32)

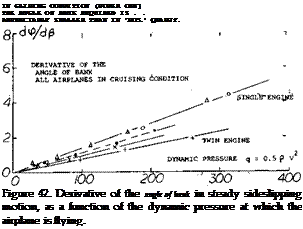
where q = 0.5 ^ V*. Assuming that the force derivative be independent of the angle of attack (lift coefficient), the angle of bank required to balance a certain angle of sideslip, can be expected to vary in proportion to the
dynamic pressure. Flight-test results of several airplanes are plotted in figure 42. For W = 12,000 lb, wing area S = 300 ft2, the loading of the F-47-is W/S = 40 lb/ft* . The lateral derivative is then

dCy /d/З = (W/S)(dy /ifi )/q « 0.010

where dp /Aft = 0.014 as in the graph. This derivative is not the same as in a wind-tunnel model, however. Rather, it represents the lateral force of the airplane in trimmed condition, id est for Cn~ zero.

Yaw Moment. The significance of the flight tests de­scribed is found in the fact that the control deflections measured can be used to determine the static stability of the airplane. The yaw moment corresponds to

dCVd/5 = (dd/d/ї )(d/3 /dSXdCjbJdjg )WV (33)

where d/l/dff^= rudder effectiveness ratio,, and dC^/d/3 = lateral force slope of the vertical tail surface used. For example, in figure 41, the derivative dd/d/3 = (do/dy )l(dfi/dp ) = 0.8. A large value of the flight – tested d6 Idfi can indicate two things:

Inopporative Engine. Multi-engine aircraft are desigfiecl so that the airplane can continue to fly after one or more engines fail. When an engine fails a yawing moment is encountered due to the asymmetrical thrust developed by the operating engines and the drag of the dead engine as illustrated on figure 44. This yaw moment may be very large if the propeller on the dead engine is windmilling and the failed engine is capable of absorbing a large amount of torque. For this case the negative thrust pro­duced by the windmilling propeller can be as large as the positive thrust on the operating engines. Thus the yaw moment produced by the vertical tail must be very large’ to balance that moment produced by the failed engine. In many cases the moment required is larger than is-possible with a practical design. As stated in (30,b) the mdst suitable method of flying on one engine, is to balance th& yaV moment by rudder deflection, and to prevent side* slipping by banking the airplane toward the side of the operating engine. The result is a lateral force primarily in the vertical tail surface, supporting a srtialter part df thef airplane’s weight, in a manner similar to that as explained in connection with figure 42. An example for this mode of operation is shown in figure 43. To be able to maneu­ver, the make turns and to. climb after a landing approach may have failed, it is desirable that full power of the operating engine be used. As stated in (30,d) “the asym­metric power condition, to a large extent dictates the design of the vertical tail surface”.

Подпись: IN GLIDING CONDITION (POWER OFF) THE ANGLE OF BANK REQUIRED IS . . APPRECIABLY SMALLER THAN IN 'THIS.' QRAPJf. Figure 42. Derivative of the angle of bank in steady sideslipping motion, as a function of the dynamic pressure at which the airplane is flying.

1. that the rudder effectiveness (d$ /dd) is small,

2. that directional stability (resulting from the last half of the equation) is large. The effectiveness can be

estimated (see doc/dcf in Chapter IX) or it may be assumed to have an average value, say of 0.6 for rudders. For a conventional type rudder, therefore, the (flight – tested derivative dd /d/S is considered to be a measure for the directional stability

dC??/d>5~(drf7d>S) (34)

Using the tail volume ratio V/ = 0.054 and the statistical value ofdC^i/d/6= 0.04, the directional stability deriva­tive of the airplane in figure 41, may thus be

dCyd/3 = 0.8 (0.6) 0.04 (0.054) » 0.001

O F-47 FIGHTER

4 F-39 FIGHTER AS IN (35,d)

• P-51 AS IN FIGURE’40

X DEHAV "MOSQUITO"'(36>b) f DOUGLAS A-26, TWIN (36,a)

Подпись:Подпись:b = 20° RUDDER ANGLE TO COMPENSATE Cn

/3 = 8° RESULTANT ANGLE OF SIDESLIP

2° ANGLE IN BANKED MODE 11° RUDDER ANGLE IN THIS MODE

Figure 43. Example (30,b) for the operation of an airplane with one of two engines inoperative.

Yaw Moment. In the design of the vertical tail surface for the engine out case the low speed take-off condition is critical. Here the dynamic pressure is low so that the deflection and area required to droduce the necessary lateral force is very high.

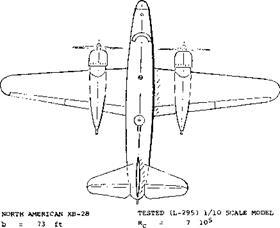
As an example of a somewhat more powerful configura­tion, the one-engine operation of the B-28 (as in figure 39) may be analyzed. As indicated in (27,c) maximum – power thrust in one propeller is approximately T = 0.1. W. The corresponding moment is “N” = 0.1 (32,000) 11 = 36,000 (ft-lb) where the moment arm to the CG is 11 ft. To balance (trim) this moment, the vertical tail surface has to provide a lateral force Y = 36,000/28 = 1300 lb, for its moment агт^и = 28 ft. Based on a tail area = 75 ft2, the corresponding lateral force coefficient is

CIa/ = 130°/(75 0.5 ^ Vе)

As found in the “control” chapter, the maximum coeffi­cient producible by 25° rudder deflection, at zero angle of sideslip, is in the order of 0.6. For comparison, the coefficient obtained in (30,e) for 30° rudder deflection, is 0.63. Solving now the last equation, a minimum permis­sible speed of 106 mph is obtained. The corresponding lift coefficient of the airplane is CL =1.6. This may be close to the maximum lift coefficient of this airplane in power – off (landing) condition. Disregarding rudder pedal forces, therefore, the B-28 appears to have satisfactory qualities in one-engine operation.

INFLUENCE OF THE SLIPSTREAM UPON THE VERTICAL TAIL

The slipstream of the propulsion system has two particu­lar characteristics. It has an increased dynamic pressure; and it changes to a degree, the direction of flow when sideslipping.

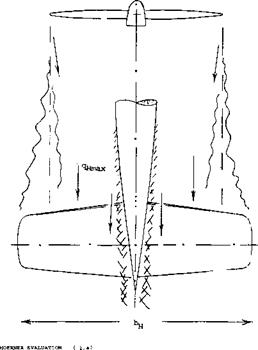
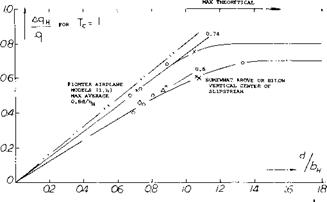
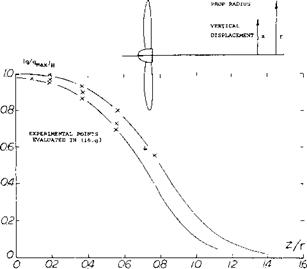
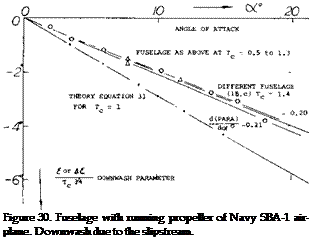
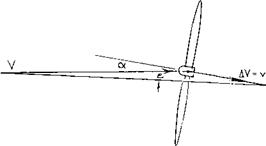
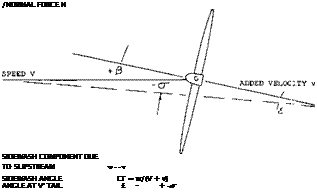
Sidewash. In propeller-driven airplanes, the vertical tail surface is usually located within the slipstream. The tail is thus exposed to a certain destabilizing sidewash and to a stabilizing increase of dynamic pressure. For example, at Tc = 1, the added velocity is v ^ 0.4 V. As demonstrated in figure 30, the sidewash component of v, corresponds to

w/v =

where /3 – angle of sideslip in radians. The maximum possible reduction of the sidewash angle against the axis of an isolated propeller, will then be

<r = W/(V + v) = – /9 (v)/(V + v);

(23)

<Wd/9 = – 1/(1 + (V/v)) = (l//l +)- 1

INFLUENCE OF THE SLIPSTREAM UPON THE VERTICAL TAIL

(26) Influence of dorsal and similar fins:

b) Recant, Curtiss XP-62 Model, W’Rpt L-779 (1943).

c) Wallace, Curtiss XBTC-2, NACA W’Rpt L-787 (1944).

d) Ventral fins (at low R’number), see (33,d).

e) Hoggard, Fuselage with Dorsal Fins, NACA TN 785 (1940).

f) Queijo, Damping Fins,-NACA TN 3814 (1956).

For very small values of thrust, the sidewash derivative is simply dcr/dfl = — 0.5 Tc. For Tc = 1, as mentioned above, theory expects:

dcr/djS =- 1/(1 +2.5) = -0.28

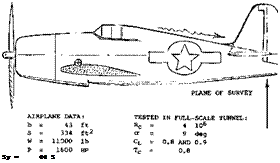
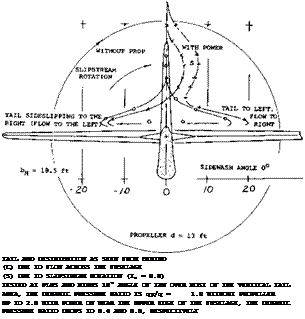
so that the effective angle at the vertical tail might be reduced (in this particular case) to (1 — 0.28) = 0.72. A survey of the flow at the location of the vertical tail surface of a low-wing airplane is shown in figure 27:

a) Without power (with dynamic pressure at the tail, essentially = q) the previously discussed type of cross flow is seen taking place over the upper edge of the fuselage. The maximum sidewash angle is about 1.5 times the angle of sideslip; and it is symmetrical to the two sides of sideslip.

b) In power-on condition (thrust coefficient TG = 0.8) it is evident how slipstream rotation adds a component to the right, in the direction where the blades sweep through the upper half of the propeller circle.

c) As a consequence of (a) plus (b) there is a strong sidewash to the right, when sideslipping to the left, amounting to between 5 and 20 , or 0.5 and 2.0 times the angle of sideslip.

The reduction of the sidewash angle due to slipstream (tested, but not directly evident in figure 27) is in the order of d&jdfi = — 0.11 for Tc = 0.8, and at CL = 0.9. This decrement is in the order of 1/2 of what is predicted in equation (23). It appears that the slipstream does not retain its original direction (if it ever reaches the sidewash angle as expected theoretically). Tentatively, we may thus write:

с1<У /dfi = – 0.5 (1/1 + Tc) – 1) (24)

Dynamic Pressure. The lateral force produced in the verti­cal tail should correspond to

dC^ Id/S = (dCы Idj3)a (1 + do fdp) (q /q) (25)

where (dC/dfi) is meant to be the lateral force deriva­tive of the vertical tail without slipstream, but while attached to the fuselage. For the dynamic pressure (20) at the vertical tail:

q^/q = 1 + Tc (26)

An average value for к is 0.5 when considering horizontal tail surfaces. According to the tests in (21,e) it seems, however, that the vertical surface of an airplane such as in figure 27, is located in that part of the upper half of the slipstream where its velocity is higher. Therefore, a con­stant к = 0.8 may be used in the equation. For example for a set of parameters

Tc = 1.0; dcr dfi = — 0.15; q//q=1.8

the lateral force in the tail and/or the yaw moment contribution by the vertical surface, can be expected to be increased by the factor

(1 + dcr /d^Xq^ /q) = (1 – 0.15) 1.8 = 1.5 (27)

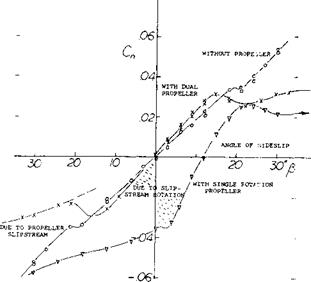
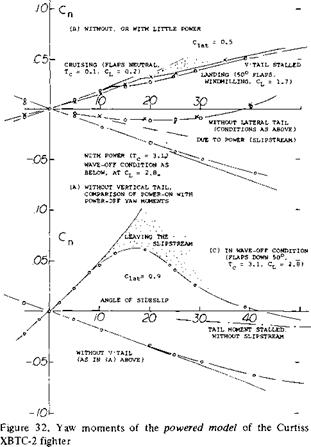
Factors of this type have been evaluated in (22,e). They seem to agree with equations (24) (26) (27). The analysis also agrees fairly well with what is reported in (22) on airplane models using dual-rotating propellers (where the slipstream is symmetrical, without rotation). For example, directional stability of the fighter airplane as in figure 31, is doubled on account of slipstream, in climb condition (full power with Tc = 1.4, at CL = 1.3). This statement should not be misunderstood, however. Stable yaw – moment derivatives of that airplane are as follows:

dCft/d/3 =0.0018 without the propeller (figure 32)

= 0.0011 with propeller, idling = 0.0024 with full power (figure 32)
Подпись: /NORMAL FORCE N SIDEWASH COMPONENT DUE TO SLIPSTREAM W = - V SIDEWASH ANGLE СГ = w/(V + v) ANGLE AT V' TAIL £ - + <T Подпись:

Подпись: condition, withflaps neutral flaps deflected

of = 12° CL = 1.3 T(; =1.4

INFLUENCE OF THE SLIPSTREAM UPON THE VERTICAL TAIL

Figure 31. Yaw moments of the single-engine airplane as in figure 3, with single and dual rotation propeller (22,a).


dC^/d/S dC-nld/3

0.0018 0.0028

0.0019 0.0053

= 0.15 =0.90


a) low wing

windmilling constant power on with Tc

b) high wing windmilling constant power on

with Tc


0.0011 0.0012

0.0011 0.0030

= 0.15 =0.90


Directional stability of the low wing configuration is al­ways higher than that in high wing arrangement.


INFLUENCE OF THE SLIPSTREAM UPON THE VERTICAL TAIL

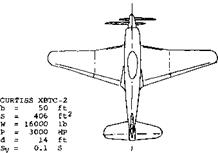
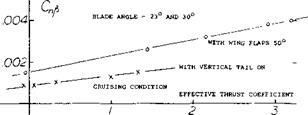
2×3 BLADED DUAL ROTATION PROPELLER 50° fuLl-span SLOTTED WING FLAPS 23° BLADE ANGLE AT TAKE-OFF 30° BLADE ANGLE WHEN CRUISING 1/8 SCALE MODEL TESTED, AT Rc = 7 (1C))6 W’RPT L-787


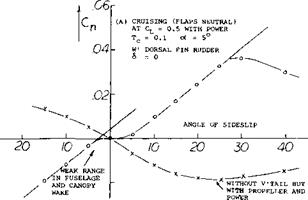
Wing Flaps. Flow conditions at the tail are also a function of the airplane’s angle of attack. Because of the wake developing along the back of the fuselage, and behind the canopy, the effective dynamic pressure and the stabilizing contribution of the vertical tail can be expected to reduce, as the lift coefficient is increased. In wind-tunnel models, at low Reynolds numbers, such as in part (A) of figure 32 for example (where Rc = 6(10) ) the loss in tail effective­ness can amount to 50%. This weakness within a few degrees around zero angle of yaw, disappears however, when deflecting the wing flaps. The angle of attack of the fuselage is evidently reduced in this case. A beneficial effect of flaps is also found in the airplane configuration discussed above (as in figures 31 and 32). With flaps down, the yaw-moment derivatives are some 20% higher. It seems that the flaps make a low-wing configuration even more “low”, and a high-wing arrangement less “high”. It is thus assumed that the favorable sidewash at the location of the vertical tail (above the fuselage) is increased when deflecting the flaps. This conclusion is confirmed in the upper part of figure 34 where the sta­bility derivative is seen increasing as a function of the thrust coefficient. In the condition with wing flaps down, the differential due to vertical tail is about 1/3 larger than in cruising condition (where the flaps are in neutral posi­tion). As a further example, stable yaw-moment deriva­tives are quoted for the two airplanes, as in figure 13:


INFLUENCE OF THE SLIPSTREAM UPON THE VERTICAL TAIL

(A) in cmising condition,

(B) with flaps down and take-off power.


(28) The same B-28 airplane as in figure 39, is discussed in the second “longitudinal” chapter.

(29) Staufer, Twin Vertical Tail Forces, Ybk D Lufo 1940 p. 1,383. For the horizontal tail of Do-217, see Ybk 1942 p. 1,208.


INFLUENCE OF THE SLIPSTREAM UPON THE VERTICAL TAIL

Inverted Flight. Another consequence of flap deflection is the fact that the asymmetric type of yaw moment func­tion as in figures 29 and 31, is reduced considerably. It seems not only the wing plus flaps take out part of the slipstream rotation; the slipstream also may be deflected down so far that the vertical tail is no longer affected very much. This conclusion is borne out by tests; (31) on a low-wing airplane when flying upside down. In this in­verted attitude (at oL – – 10° for CL = 0.7, for example), the vertical tail surface is below and essentially out of the slipstream. Directional stability is about the same, accord­ingly, as in power-off (windmilling) condition.


INFLUENCE OF THE SLIPSTREAM UPON THE VERTICAL TAIL

-.002-


INFLUENCE OF THE SLIPSTREAM UPON THE VERTICAL TAIL

і і


0.32 SCALE MODEL OF 2300 HP FIGHTER TYPE

TEST CONDITIONS: b = 15 ft

S = 38 ft2

d 4 ft

О 0 –

CL = .15 –

CTp ^ -00 –

Rc = 4’106

23° = BLADE ANGLE 27% SOLIDITY Sp = .33 S


INFLUENCE OF THE SLIPSTREAM UPON THE VERTICAL TAIL

004-

Cn


WING + FUSELAGE O’

WITHOUT PROPELLER, сґ’


0.02-


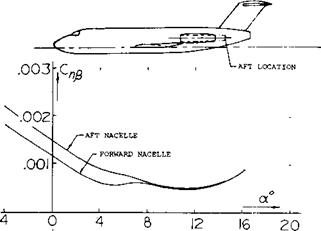
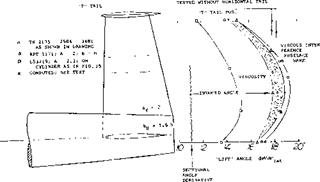
Jet Propulsion. The use of jet engines for propulsion has eliminated many of the directional stability problems en­countered with propeller driven airplanes. For instance there is no direct slipstream effects on the tail as the engines are located so that the tail surfaces are not washed by the hot efflux of the engines. The location of the engines of the airplane do influence the flow at the tail surface however and thus effects the directional stability derivative, Ct2^. For instance the fore aft location of the engines relative to the vertical tail changes as a function of the angle of attack (32). This variation is caused by the cross flow over the fuselage and engine nacelles and is illustrated on figure 35.

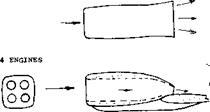
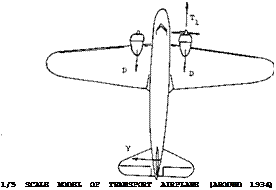
As found in the arrangement as in figure 36, there can be certain interference effects, however. When at an angle of yaw, the air passing through the engines gets deflected laterally. The consequence is a lateral force AY which can be calculated on the basis of the engine mass flow. De­pending upon the longitudinal position of the engine ducts (in relation to the airplane’s CG) the resulting yaw moment can be “positive” or “negative”. For the airplane as in figure 36, the moment should be expected to be destabilizing. The experimental result is a small stabilizing increment, however. Analysis suggests that a stabilizing force is induced in the particular configuration consid­ered, in the vertical tail. It seems that the presence of the pair of jets makes the configuration more “low wing”, thus inducing some stabilizing sidewash at the location of the vertical tail.


INFLUENCE OF THE SLIPSTREAM UPON THE VERTICAL TAIL

ANGLE OF SIDESLIP


Figure 33. Yaw moments of a fighter airplane tested ( 22,a) with single and dual rotation propeller.


(30) Twin-engine airplanes on one propeller;

a) Douglas, After Engine Failure, J. Aeron. Sci. 1935 p. 132.

b) Hartman, One One Engine, NACA TN 646 (1938).

c) Schmidt, Multiple-Engine Control, Ybk D Lufo 1943, Rpt IA-030.

d) Pitkin, B-28 on One Engine, NACA W’Rpt L-191 (1945).

e) Goodson, Influence of Thrust Reversal, TN 2979 (1953).

(31) Characteristics of fighter-type airplanes, flight-tested;

a) Goranson, Qualities of F-47 Airplane, NACA TN 2675 (1952).

b) Johnson, Rudder and Sideslipping Curtiss P-40, W’Rpt L-547 (1942).

c) White, North American P-51 “Mustang”, W’Rpt L-566 (1943).

d) Johnson, Flying Qualities Bell P-39, W’Rpt L-602 (1943).

(32) Ray Effects of Large sideslip angles on stability of “T” tail configurations NASA TM X-1665


INFLUENCE OF THE SLIPSTREAM UPON THE VERTICAL TAILINFLUENCE OF THE SLIPSTREAM UPON THE VERTICAL TAILINFLUENCE OF THE SLIPSTREAM UPON THE VERTICAL TAIL

Подпись: CHARACTERISTICS AT HIGHER ANGLES OF YAWINFLUENCE OF THE SLIPSTREAM UPON THE VERTICAL TAIL

So far, primarily yaw-moment and other derivatives have been presented and discussed as they are found at and around zero angle of sideslip, say within plus-minus 10 . When going beyond such limits, two changes take place:

1) the vertical tail surface may stall,

2) the tail may “drop” out of the propeller slipstream.

These events and their influence upon stability and con­trol are as follows.

Подпись:Подпись:

Flow Separation. The only problem regarding the direc­tional characteristics of the jet-propelled airplane in figure 36, is a strong reduction of the derivative dC^/d^S from 0.008 to 0.003, in landing condition (wing flaps down 45 , engines “inoperative” as in the wind tunnel). It seems that there are a pair of separated spaces behind the two engines attached to the sides of the fuselage, thus reducing the dynamic pressure at the vertical (and hori­zontal) tail surfaces.

BELL P-59 TWIN-JET FIGHTER US FIRST (1942) JET AIRPLANE

SEEN FROM BEHIND ___________

b = 45.5 ft ‘

S = 386 ft2

W = 12000 lb

T = 2 2000 lb

Vx = 360 kts

Sy = 8% S

fv = 0.43 b

AS TESTED IN FULL SCALE TUNNEL

dCy/d£ = 0.0050 IN ALL CONDITIONS

dCn/d£ = 0.0008 IN CRUISING CONDITION

= 0.0003 WITH FLAPS 45° AND

ENGINES INOPERATIVE

W’RPT L-626

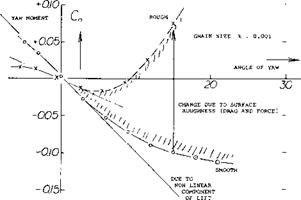
Fuselage. Shown in the Chapter XIX a “second” non­linear component of lift, cross-wind or normal force devel­ops on streamline bodies at the longer angles. Since the location of this lift component is somewhere in the after­body, the corresponding yaw moment about the CG of a typical airplane (located, say at 1/3 of the fuselage length) is stabilizing. The directional characteristics of propeller driven fighter-type airplane are presented in figure 28. Without power, and without vertical tail, the yaw moment derivative dC^/d/3 of the configuration reduces from the original value of – 0.0007 or – 0.0008, to zero at = plus or minus 20°; and it then turns stable reaching comparatively large slopes around and beyond fo = plu&-or minus 40°. There may be some component of yaw mo­ment included in the tested function, caused by the roll moment in the wing, due to yaw. Neglecting this compo­nent, the non-linear differentials tentatively lead to a moment arm of the normal forces in the fuselage

-4/Ь=ДсуДСу =0.30 or = 0.35

This distance from the CG of the airplane ahead of the tail surface, in the middle of the dorsal fin, would appear to be reasonable for the non-linear component of the fuselage’s lateral or normal force.

Figure 36. Directional stability derivatives of Bell P-59, first U. S. jet airplane as tested (24,a) in the Full Scale Tunnel. [123]

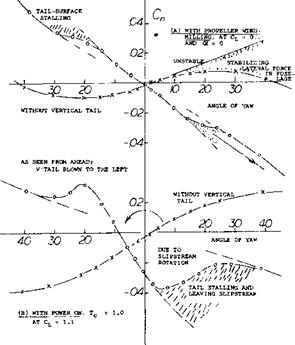
Displacement. In Chapter XII it was shown how the propeller slipstream is cut in two parts are displaced in lateral direction, as a consequence of torque and rotation, the upper “half’ to one side and the lower one to the other side. If looking at the airplane in figure 29 .from ahead, the propeller is turning counter clockwise, a right hand prop. Since the configuration is that of a low wing (with most of the propeller disk above the wing) the slipstream is displaced to the side into which the tail moves at negative angles, left on the graph. On this side, therefore, the slope of the yawing moment contribution of the vertical surface has a large increase. On the

other hand, when sideslipping to the other side (to the right in the graph) the derivative is reducing to and below zero. When trimming the airplane by deflecting the rudder so that = zero, the airplane is still stable directionally, at and near ^ – 0. However, at and beyond / = + 6°, as in part (B) of figure 28, that is when sideslipping to the left as seen by the pilot the airplane becomes unstable. The same type of slipstream displacement is also respon­sible for the asymmetry of the sidewash distribution in figure 27, in power-on condition.

Slipstream As noted above slipstream rotation causes the unfavorable asymmetric condition shown on figure 28. This is eliminated on normal jet propelled airplanes as the design is set up so the slipstream does not impinge on the tail. Slipstream rotation is also eliminated by the use of dual rotation propellers or with the use of ducted fans designed for peak performance using vanes to eliminate the rotational losses.

Tail Stalling. Vertical surfaces do stall, at higher angles of yaw however, together with the aft end of the fuselage high stabilizing are still obtained. The reasons why an airplane as in figure 32 turns highly unstable at yaw angles beyond plus/minus 20°, are other than stalling:

a) the vertical tail moves out of the propeller slipstream laterally,

b) the destabilizing normal forces in the propeller is high,

c) there is a considerable destabilizing interference be­tween slipstream and fuselage.

When leaving the rudder alone (not shown in figure 32) a definitely unstable condition is obtained, at ~ plus or minue 10° . In the case of tiem (c) it appears that the slipstream reduces considerably the stabilizing non-linear lateral-force component of the fuselage. This interaction will be discussed after explaining the mechanism of dorsal fins.

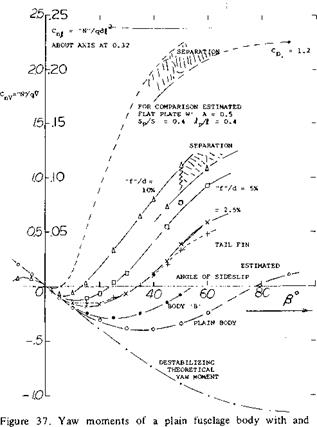
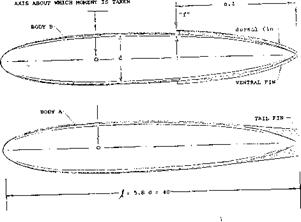
Dorsal Fins. While sideslip angles up to plus-minus 20° seem to be sufficient in any normal operation of the airplane, the loss of restoring forces and moments at larger angles might be dangerous when spinning the airplane. A device expected to improve the directional characteristics, are dorsal and/or ventral fins. Fins of the type as in figure 37, do not have any effect on the yaw moment of the fuselage body, within the range of plus-minus 3 angle of yaw.

BODY "B" HAS THE SAME CONTOUR AS THE ONE SHOWN WITH THE TAIL FIN ATTACHED, ENDING IN A SHARP VERTICAL EDGE.

BODY VOLUME V = 0.61 ft3

= 0.14 J2

= 0.80 d2/

REYNOLDS NO. Rj = 2+ 106
INFLUENCE OF THE SLIPSTREAM UPON THE VERTICAL TAIL

INFLUENCE OF THE SLIPSTREAM UPON THE VERTICAL TAIL

without dorsal and ventral fins (28,a).

Between = 10 and 50 or 60°, the stabilizing influence of the fins in figure 37 is considerable. The principle by which they work, is to increase the fuselage’s “natural” non-linear normal or lateral-force component.. This cross – flow component explained in Chapters III and XXI, is basically of the type

CN^ sin8 oC ; or Су ~ sin2^ (28)

In the extreme, the rear end of the fuselage may be thought of being converted by the addition of dorsal and ventral fins, into a “flat plate”. We have estimated the yaw moment of the body in figure 37, assuming that a lateral area aft equal to 0.4 of the body’s area be a plate, with an aspect ratio of 0.5 and an average moment arm to the yaw axis at 0.32/ , equal to 0.4 of the body length / . Using normal forces as in the Chapter III, the uppermost curve in the graph is thus obtained. Evaluating the experi­mental results in (26,a) with the aid of equation (28), it is found that the “ridges” change flow pattern and cross – flow drag coefficient of the sections of the fuselage to which they are attached. Considering in figure 37, a single point, at = 30° , where sin2ft = 0.25, the lateral force can be expected to correspond to the coefficient based on projected lateral area

CNa = 0.35 = C0a sin2/? = CDa 0.25 The resultant cross-flow drag coefficient of the part of the fuselage “covered” by the fins is CDo = 1.4. After sub­tracting some value for the plain fuselage, the component attributable to the presence of the fins may be A CDa =

1.0. The height of these fins in figure 37, is 5% each of the maximum body diameter. Their combined lateral area is about 13% of the portion of the fuselage “covered” by them SF. We will assume that CDci be proportional to that area ratio. Thus

ACDd =8(Sd/S,-) (29)

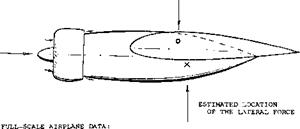
Dividing ДС^/ДСу, the center of the lateral force pro­duced in figure 37, is found roughly to coincide with that of the fins.
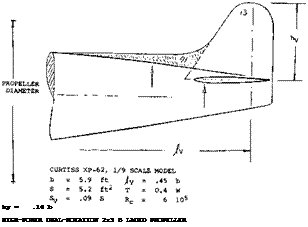
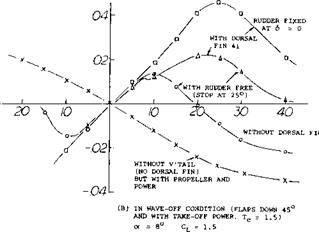
Подпись:INFLUENCE OF THE SLIPSTREAM UPON THE VERTICAL TAILINFLUENCE OF THE SLIPSTREAM UPON THE VERTICAL TAILПодпись: Figure 38. Influence of a dorsal fin on yaw moment of a fighter- type airplane (27 ,b).Airplane Configuration. Dorsal fins have been tested as a means of improving the characteristics of several airplanes (26). As an extreme example, yaw moment characteristics are shown in part (B) of figure 38 of an airplane for the cases of a high powered dual-rotation propeller, and with the rudder free to move.

Directional stability starts to deteriorate at plus or minus 10 angle of yaw. If left alone, the airplane would seek a point of balance beyond 40 . As stated before, the con­tribution by dorsal fins to directional stability in more or less straight flight around. fo = zero is negligibly small. In fact, by disturbing the cross flow around the leading edge of the vertical tail surface, the derivative, , can even be reduced when adding a dorsal fin, although a ventral fin (at the lower side of the fuselage) would probably be somewhat beneficial. The fin as shown in the illustration can be analyzed, using equation (29). In doing so, it must be taken into account however that:

1. Подпись:the low wing increases the cross flow (some‘30%),
2. the slipstream reduces that flow (some 20%),

3. the dynamic pressure along the fuselage is increased (equation 26).

For the yaw-moment differential A Cy = 0.085, as at P – 40°, a lateral drag coefficient ACDd is thus obtained, which is similar in magnitude to that as found above for the fin in figure 37. Assuming this coefficient, the lateral force contribution of the dorsal fin is figure 38, can be estimated to be

ДСу =(SD/S)(sin^e.)(q^/q)ACDD (30)

where /5. = effective lateral angle = j3{ + d<f /dft). The moment arm of this force fn = 0.28 b, corresponding to /Ь = ДС7?/ АС у is indicated in the drawing.

Подпись: Sv h d 2 Подпись: = 676 ft2 = 114 S = .38 b = 14 ft x 2000 HP Подпись:INFLUENCE OF THE SLIPSTREAM UPON THE VERTICAL TAILПодпись: FUSELAGE "MID-WING" NACELLES "HIGH-WING" W Ki 32000 lb

VERTICAL TAIL CONTRIBUTIONS:

0.0019 CRUISING, TQ = 0.1

= 0.0022 CLIMBING, Tc = 1.0

•• = 0.0021 LANDING, WINDMILLIN3

•’ = 0.0020 AT CT = 2.0, T = L.3

L c

BOTH PROPELLERS TURNING RIGHT

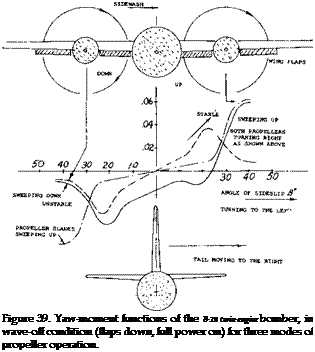
Figure 39. Yaw moment characteristics of the twin-propeller B-28, tested (27 ,c) in a powered wind-tunnel model.

Propeller Moment. It was found above, in part (A) of figure 32, that the destabilizing contribution by a pow­ered propeller grows with the angle of yaw at a rate higher than linear. The explanation is contained in equation (30) where the lateral force due to dorsal fins (or that originat­ing in the tail end of the fuselage body) is seen to be proportional to the square of Д =J3( 1 + dor’ /d/5). In other words, since d& fdft due to slipstream is negative, the stabilizing contribution of the fuselage can easily be reduced. For Tc = 3.1, as in figure 32, equation (23) yields a d(T/d/3 = – 0.5. At /5 = 30°, thus Д = 15°, so that the stabilizing component of the fuselage is reduced to 1/4. It can be concluded that single-propeller airplanes reach a practical limit as to their power, say corresponding to Tc = 2 or 3, beyond which they may no longer be “manageable” when sideslipping.

Подпись: 20°. 30- Подпись:Подпись: CORRECTED TO ZERO SIDESLIPPING Twin Propellers. Directional characteristics of the twin engine aircraft are tabulated in figure 38. Within the range of jB – plus-minus 10°, results can be generalized as follows:

a) the normal force of the propellers (with power, corre­sponding to Tc = 1.3, but not shown in the illustra­tion) is almost as large as that of the tail surface,

b) power does not have a noticeable influence upon the fuselage contributions,

c) power does not seem to have an effect upon the contributions by the vertical tail surface,

d) deflection of the wing flaps considerably increases (not shown in figure 39) the lateral force in the fuselage (presumably next to the wing roots).

The vertical tail is evidently located between the two slipstreams. In the cruising condition (flaps neutral) the C^(6) function is fairly regular between plus and minus

RUDDER ANGLE REQUIRED FOR TRIM

20

Pair of Slipstreams. The direction of propeller rotation in twin-engine airplanes will influence the flow pattern at, and stabilizing effect of the horizontal tail surface (28) and Chapter XII. The effect of the propellers on the directional stability of a B-28 for the case of both pro­pellers turning right are given on figure 40. The results for the flaps done case Tc = 1.3, C L = 2.0 are:

a) At /6 = 0 no tail, a moment is obtained corresponding to Qyi = — 0.01, turning the airplane to the left. The left slipstream seems to blow slightly across the fuse­lage.

b) The moment under (a) is doubled when adding the tail surfaces. A sidewash to the right, is evidently pro­duced at the location of the vertical tail by propeller blades and slipstream turning in this direction.

c) As in figure 28, the CT($) function is asymmetric. The stable range is wider when yawing to the right (to 5 – – 20°) and limited (to/5 = + 10°) when turning to the left (as seen by the pilot).

d) It seems, when turning to the left, the vertical tail begins to “lean” against the right-side slipstream at angles above /3 = + 20°. The slope increases to a maximum in the order of dC^/d/S = + 0.03.

e) When turning to the right, the tail surface seems to stall at an angle ft = — 20 or — 25°. The slope reverses to maximum values of dC^/dfi between — 0.03 and — 0.04.

INFLUENCE OF THE SLIPSTREAM UPON THE VERTICAL TAIL

Подпись: /0L Подпись: іINFLUENCE OF THE SLIPSTREAM UPON THE VERTICAL TAILINFLUENCE OF THE SLIPSTREAM UPON THE VERTICAL TAIL

n.

INFLUENCE OF THE SLIPSTREAM UPON THE VERTICAL TAIL

NORTH

AMERICAN

[ P-

51 "MUSTANG"

POSSIBLY THE FIRST OPERATIONAL

AIRPLANE USING A

LAMINAR-TYPE

FOIL

SECTION,

PRESUMABLY OF THE

64 SERIES WITH 16

to 11% THICK-

NESS

AND 1.2%

CAMBER DEVELOPED

AROUND 1942

b

37

ft

0.5 TAPERED

S

236

ft2

A = 5.8

d

10.5

ft

3-BLADED

Sv =

8.5%

S

RUDDER 52%

w

8000

lb

LOW WING

Figure 40. Rudder angles required to trim P-51 “Mustang”, flight- tested by NACA (31,c).

Opposite-Rotation (28). When arranging engines or pro­pellers, turning in opposite directions, flow pattern and directional characteristics evidently become symmetrical. Characteristics in figure 39 are as follows:

a) When yawing to the right, stalling takes place as in (e) above, in the case where both engines turn so that the blades sweep down at the inboard sides of the nacelles. Note that the left propeller turns clockwise (as in (e) above).

b) When yawing to the left, the same stabilizing inter­ference as in (d) above is obtained, in the case where the propellers turn sweeping up at the inboard sides. Note that the right propeller turns as in (d) above.

c) It is apparent that none of the three modes of twin – propeller rotation will remedy all of the irregularities in the yaw moment function. For displacement up to plus-minus 20°, contra-rotation as in (a) seems to be best, while at angles up to plus-minus 40°, the oppo­site mode of operation (blades up) is superior (at least in the B-28 configuration).

Shape, dimensions, arrangement, power used and other parameters may affect the directional characteristics of any specific airplane. However, the evaluation presented above, displays the type of interference to be expected between the vertical tail and the pair of slipstreams in twin-engine airplane configurations.
YAW MOMENT ARMS

So far, only the development of lateral forces have been presented. Ultimately, a vertical tail surface is expected to contribute a stabilizing yaw moment, however. The arms providing such moments are discussed in the following, together with other means (fins) supplementing direc­tional stability.

Vertical Tail Volume. The yaw moment produced by the vertical tail surface, can be expected to grow in proportion to both, area and arm (tail length). In coefficient form therefore,

dC^vldA = (dC^ldA )(Sи! S)0V lb) (18)

where the value of (dC^ /d^) primarily depends upon the shape (aspect ratio) of the tail surface. The term (Sy-ii/) has the dimensions of a volume. The vertical tail volume ratio

V/ ^/SHV/b) (19)

is thus a fixed characteristic of the airplane configuration.

Yaw Moment. A lateral force originating in the vertical surface, is expected to produce a yaw moment (“N” about the “normal” axis of the airplane) corresponding to

C* = “N”/qSb = ( – V/b) (V/S) = CjUl V (20)

When sideslipping, the derivative is expected to be

= dtyd* = (dC^/d* ) VK (21)

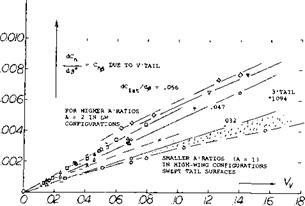
Within reason, both the lateral tail force and the yaw moment derivatives are independent of angle of attack and/or wing-lift coefficient of the configuration. Test data for yaw-moment contributions of vertical tail surfaces are given in figure 21. They increase essentially in proportion to the volume ratio provided by tail size and length. There is a difference, however, between the influence of length and vertical area. As explained in connection with figure 11, the lateral force derivative reduces somewhat as the length of the fuselage is increased. This influence is evi­dent in figure 21, and it is marked accordingly.

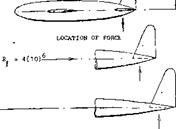
Moment Arm. One particular fuselage plus tail configura­tion is shown in figure 22. Dividing the derivative by that of the lateral force the effective moment

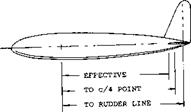
arm X/ is obtained, in the form of Xy/h. This arm is, of course, shorter than that measured to the rudder hinge line. However, the effective arm is also shorter (94%) than the distance of the quarter-chord point of the vertical tail surface from the reference axis (through the CG of the airplane for which the tests are undertaken). It thus seems that some lift is induced in the fuselage, somewhat ahead of the vertical tail’s root chord. This result is confirmed in figures 11, 12, 23, where the effective moment arms are between 3 and 8% shorter than the geometrical tail length (to the aerodynamic center point of the vertical surface). In terms of fuselage maximum diameter or tail root chord, the reductions listed are between 10 and 25%.

YAW MOMENT ARMS

EVALUATION FROM L-17 (10,h)

MEDIUM-LONG FUSELAGE WITH 9.7% S VERTICAL TAIL TESTED WITHOUT A WING, BUT BASED ON WING DIMENSIONS;

TAIL CONTRIBUTIONS ARE:

0.0032 0.0071

0.0032/0.0071

0.45 EFFECTIVE ARM RATIO 0.48 TO c/4 POINT OF TAIL

0.52 TO RUDDER HINGE LINE

Figure 22. Moment arms of the vertical tail of an airplane config­uration derived from wind-tunnel tests (10,h).

YAW MOMENT ARMS

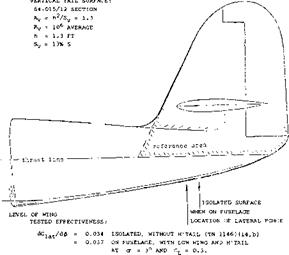
Figure 23. Lateral force provided by the vertical tail surface of a fighteptype airplane (14,a).

Fuselage Shape. The influence of the cross-sectional shape of the fuselage upon the directional characteristics is dis­cussed in connection with the results in figure 4. The same series of bodies are shown in figure 24 combined with tail surfaces. The contribution of the vertical tail to the lateral force is essentially the same for the three fuselage shapes. The effective moment arms differ only slightly; they are all shorter than the geometrical distances to the quarter – chord line of the tail.

YAW MOMENT ARMS

YAW MOMENT ARMS

Rv = 5(10)5; TAIL DIMENSIONS AS IN FIGURE 12, ALTHOUGH DIFFERENT

FUSELAGE, EVALUATED FROM TN 3857, FROM LATERAL FORCE Су. CROSS-SECTION AREA AND VOLUME OF THE FUSELAGE ARE KEPT CONSTANT. MOMENT ARMS IN (PARENTHESES) WERE OBTAINED WITH A WING PRESENT.

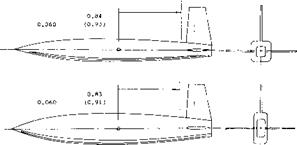
Figure 24. Influence of fuselage cross-section shape uoon the lateral force and the moment arm of the vertical tail surface.

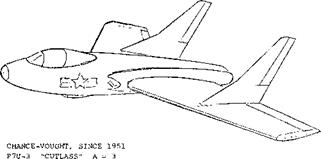
Fins on Top of the Wing. In tailless airplane configura­tions, some kind of vertical fin are required for directional stability. In swept-back configurations, a convenient place to attach such fins, is on top of the wing. Each fin of the airplane shown in figure 25 has an area equal to 9% of that of the wing. The geometric aspect ratio is = ha/S^ =1.5. There are two effects to be considered:

a) The wing can be considered to be a very large one-side end plate. The effective aspect ratio of the fins may thus be = 1.9 Ay = 2.8.

b) The pair of fins may interact with each other. For a lateral distance у = 1.9 h, or (y/h)(A//A^) = 1.0, figure 23 in the Chapter III (set up in terms of biplane interference) leads to the result that the effective aspect ratio is reduced from 2.8 to Af = 0.9 (2.8) = 2.5.

Using equation (14) the derivative of the lateral fin forces can be determined. It can be expected, however, that interference with the suction side of the wing will reduce the effectiveness of the fins somewhat (possibly by 10%). The moment arm (to the CG) available in the “Cutlass” configuration, is only ~ 1/4 of the wing span. To obtain the required stability, the combined fin area has to be larger than in a conventional configuration; it is 18% of the wing area in figure 25.

YAW MOMENT ARMS

CARRIER-BASED FIGHTER VERTICAL SURFACES WITH:

b

=

40

ft

Sy =

0.09 S

w

=

27,000

lb

ly –

0.27 b

Vx

=

580

lets

VERTICAL

TAIL VOLUME 0.05

PAIR

OF

JET ENGINES, EACH:

30 to

40 DEGREES SWEPT

T

=

5,000

lb

Figure 25. View of Chance-Vought F7U-3 “Cutlass” tailless air­plane (25,c).

(21) Influence of propeller power in fighter-type airplanes:

b) Recant, Curtiss XP-62 Model, W’Rpt L-779 (1943).

c) Goodson, Fleetwings XBTK-1, W’Rpt L-786 (1945).

e) Sweberg, Grumman XF6F-4 Directional, W’Rpt L-109

(1945) .

f) Sweberg, Load Distribution in Tail, W’Rpt L-426 (1944).

i) Purser, Rotation LW Airplane Model, NACA TN 1146

(1946) .

j) Johnson, V’Tail Modifications in Slipstream, NACA Rpt 973 (1950).

YAW MOMENT ARMS

(22) Characteristics with dual-rotation propellers:

a) Neely, With Single and Dual Propeller, W’Rpt L-83 (1944).

b) Recant, Curtiss XP-62 Model, as in ref (22,b).

d) Wallace, Curtiss, XBTC-2 Model, W’Rpt L-787 (1944).

Twin Tails. Another type of fins is sometimes used in twin-engine airplanes. To facilitate handling on the ground, by keeping the rudders within the propeller slip­stream, twin vertical surfaces can be attached to the ends of the horizontal tail, in the form of “end plates”. An example of this type of design is the Lockheed LI049, 749 “Constellation” airplanes. Results of a systematic wind-tunnel investigation on twin vertical surfaces, are presented in figure 46 which indicates that:

1) the effectiveness dC^/d^ increases with the aspect ratio,

2) shape “4” (straight trailing edge) is better than “3” (for the same aspect ratio),

3) there are discontinuities in two of the shapes investiga­ted,

4) the type of surfaces tested, is effective up to= 30 and possibly 40 .

Подпись:Подпись: TAIL AND DISTRIBUTION AS SEEN FROM BEHIND (C) DUE TO FLOW ACROSS THE FUSELAGE (S) DUE TO SLIPSTREAM ROTATION (Tc = 0.8) TESTED AT PLUS AND MINUS 10° ANGLE OF YAW OVER MOST OF THE VERTICAL TAIL AREA, THE DYNAMIC PRESSURE RATIO IS qy/q = 1.0 WITHOUT PROPELLER UP TO 2.0 WITH POWER ON NEAR THE UPPER EDGE OF THE FUSELAGE, THE DYNAMIC PRESSURE RATIO DROPS TO 0.4 AND 0.8, RESPECTIVELY The discontinuities mentioned seem to be caused by flow separation on one side where the horizontal tail interferes with the suction side of the vertical surface. The high angles permissible, are simply a consequence of the low aspect ratios used.
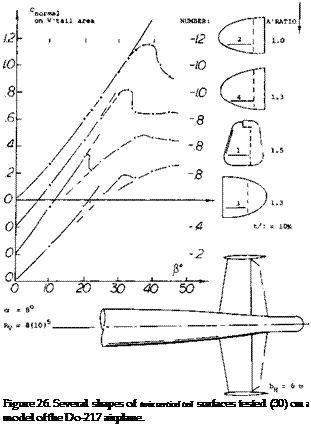
Подпись: Figure 26. Several shapes of twin vertical tail surfaces tested (30) on a model of the Do-217 airplane.

Figure 27. Results of wind-tunnel tests (21,e) on the Grumman F6F fighter-type airplane, showing the distribution of sidewash at the location of the vertical tail.

(23) Lateral characteristics of high-wing airplanes:

a) Hagerman, HW Airplane w’Power & Flaps, NACA TN 1379 (1947).

b) Same model in low wing arrangement, see Tamburello, NACA TN 1327.

c) Longitudinal characteristics of same models, TN 1239 and 1339.

d) McMillan, “Puss Moth”, ARC RM 1794 (1937); also Batson, RM 1631 (1935).

e) Paulson, Fighter in Inverted Flight, NACA W’Rpt L-15 (1945).

(24) Lateral directional characteristics of jet-propelled airplanes:

a) Brewer, Bell P-59 in Full Scale Tunnel, W’Rpt L-626 (1945).

b) NACA (Douglas) X-3 research airplane: Flight-test results, Bellman, NACA RM H54I17. Wind-tunnel tests on very simi­lar model, NASA Memo 1-22-59L.

c) A single tail-jet and a twin jet (in the wing) airplane are reported by Davis, Effect of Jet on Stability, NACA W’Rpt A-31 (1944). The “changes in directional stability and trim are negligible”.

Подпись:

Подпись: MOMENT DUE TO FORCES IN THE PROPELLER
Подпись: INFLUENCE OF PROPULSION

The influence of propulsion system on the directional characteristics of an airplane is dependent on the forces and moments produced when operating at an angle rela­tive to the flow. In addition the slipstream and the in­duced effects of the propulsion system can produce im­portant interaction effects that will influence the results. Propeller driven airplanes produce large forces and mo­ments when operating at an angle of attack and have a large slipstream which often infringes on the aerodynamic surfaces of the airplane as discussed in Chapter XII. Al­though few new propeller aircraft are being designed and built the influence of propellers are covered as this will serve as a basis for the systems using jet propulsion, especially with the trend toward much higher by-pass ratio. This is desirable as considerably more data is avail­able on the subject of propellers than for jet systems.

YAW MOMENT ARMS

YAW MOMENT ARMS

POWERED MODEL OF A SINGLE-ENGINE LOW-WING AIRPLANE:

d

0.3

b

Sp =

.53

S

T

0.5

L

Rc =:

1 ■

• 10*

Figure 28. Yaw moments of a low wing airplane configuration (14,a) in cruising condition:

(A) with propeller windmilling

(B) with full power on Tc = 1.0.

The normal forces originating in propellers when at an angle of attack are explained in the Chapter XII. The same type forces are also obtained when sideslipping due to the angularity of flow into the disk.

Tractor Propeller. The propeller of single-engine airplanes (such as the fighters, for example, in figures 27 and 28) may have:

a solidity ratio S^ /Sp =10% a “0.7” blade angle “/?” = 30 a disk area d‘V /4 Sp = S/3

a moment arm to CG = b/4

Using the derivative dC^ /d^ = 0.035, as found in Chapter XII the lateral force may correspond to

Суз/5 “ (dCNS Id# ) (Sg /Sp) (Sp/S) –

0.035 (0.3)/3 = 0.0012 (31)

and the yaw moment due to the normal force of the propeller may correspond to

Сфр = – dCy/zp (Jp/b) = – 0.0012/4 = -0.0003(32)

For comparison, the derivative due to the fuselage may be in the order of — 0.0001, and that due to vertical tail up to + 0.0010. So, the propeller-force moment is usually the most destabilizing single component of any powerful (tractor-type) single-engine airplane configuration, such as fighters in particular.

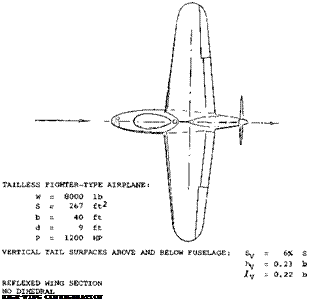
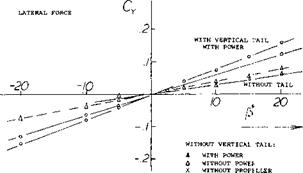
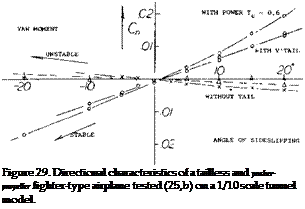
Pusher Propeller. Directional characteristics of a “tailless” airplane configuration are shown in figure 29. While a pusher propeller at the end of a fuselage is an unusual arrangement, the results promise to shed light on the interaction between this type of propeller and the wing or a vertical tail located ahead.

The yaw moment of the wing fuselage combination displays the usual destabilizing moment due to the fuselage.

The addition of a vertical tail (“double”, above and below the fuselage) stabilizes the yaw moment..

When adding the windmilling propeller (no thrust) the normal forces originating in the propeller blades increase directional stability, propeller fin effect (19).

Finally, when adding power to the configuration, a maximum of directional stability is obtained.

Подпись:YAW MOMENT ARMSПодпись:The propeller slipstream is the consequence of a pressure increment Л Cp = Tc, across the propeller disk. The average increment (v) of the speed “in” the disk is theo­retically

V// = 0.5 VTTt; (22)

Where Tc = the propeller thrust coefficient = T/qSp. Full speed, corresponding to twice this increment, is theo­retically reached at some distance (say beyond one diame­ter) behind the propeller. As far as the flow ahead of the propeller is concerned, the disk represents a “sink”, into which air is attached from “all” sides. Only a small influ­ence can expected, accordingly, of the propeller upon the vertical tail surface located ahead of it. Equation (22) suggests, on the other hand, that normal force in the, and yaw moment contribution of the propeller proper, be increased, for example by 40% for Tc = 1. Results plotted in figure 29 show an effect somewhat stronger than according to this reasoning. The added increment must be due to the influence of the propeller (suction) upon the tail surface.

INFLUENCE OF WING AND HORIZONTAL STABILIZER ON VERTICAL TAIL

In conventional airplane design, the horizontal tail surface is more or less closely combined with the vertical surface. The interaction between them, and influence of the wing upon the vertical tail are covered in this section.

Sidewash. Consider the configuration at the bottom of figure 13, where the wing is located at the lower side of the fuselage. The flow around the lower side when opera­ting at an angle of yaw is reduced, while flow over the upper side is increased. A rotation, or circulation of the flow, is thus produced, about the longitudinal axis of the fuselage. At the vertical tail surface location above the fuselage the flow over the top represents a certain side- wash and it combines with the lateral velocity component due to sideslipping. In the case of a low-wing configura­tion, this type of sidewash is stabilizing. Sidewash angles (*) at the location of the vertical tail surface, where directly measured (10 ,d) for the “shortest” among the configurations are illustrated in figure 11. Without a horizontal surface present, average angles were found to be as follows: configur – di /d/і (d6 jd/s ) type of flow dC^/ /d^s ratio ation

high wing – 0.040 – 0.40 reduced side flow 0.030 0.64

no wing + 0.360 0 basic cross flow 0.047 LOO

low wing + 0.640 + 0.28 increased flow 0.057 1.21

HIGH WING WITH z = 0.20 cx

a) WINDMILLING:

CY3V

= 0.0080

– 0.0040 = 0.0040

Cn fiV

= 0.0010

+ 0.0008 = 0.0018

b) WITH

POWER:

CYfiV

= 0.0100

– 0.0050 = 0.0050

Cn^V

= 0.0010

+ 0.0010 = 0.0020

1/5 SCALE MODEL,

WITH:

S =

9.4 ft4

b =

7.5 ft

d =

2 ft

_P

c =

1.35 ft

cx =

4/3 c

Sv =

13% S

(EXPOSED FIN +

RUDDER)

h –

0.44 b

Rc =

106

POWEF

t, SO THAT

T =

0.18 W

CTp =

0.54 –

RATIOS OF VERTICAL TAIL CONTRIBUTION ARE: HW/LW -0.1, or

LW/HW = 1.4

NOTE: FIRST VALUES ARE WITH TAIL, SECOND VALUES WITHOUT.

LOW WING IS MUCH MORE STABLE THAN HIGH WING.

POWER INCREASES SIDEViASH AND STABILITY IN LOW WING.

Figure 13. One and the same type of airplane configuration tested (21,g, h) in low-wing as well as in high-wing arrangement.

Подпись:For example in the LW configuration, the local angle of sideslip is (1 + 0.64)^ ; and the ratio is 1.64/1.36 = 1.2. The force derivatives vary roughly in proportion to those of the flow angle (/$ + 6 ). In form of an equation, therefore, the lateral force in the vertical tail corresponds to
dC^/d^ =0 + 4(dA /d^HdC^/d^ (17)

where (o) indicates the force derivative of the tail on fhselage, but in the absence of a wing. The difference between LW and HW is appreciable.

Horizontal Tail Interference. Results of a wind-tunnel investigation (13 ,f, g) on the interference of horizontal tails are presented in figure 12. In comparison to the lateral tail-force derivative without the wing, ratios are as follows:

configuration

w’out H’tail

ratio

with H’tail

ratio

high wing

0.75 (0.65)

0.70

0.83

(0.82)

0.82

mid wing

1.00 (1.00)

1.00

0.98

(0.99)

1.00

low wing

1.16 (1.15)

1.16

1.07

(1.06)

1.07

The ratios found are confirmed by results listed in paren­theses as quoted from (12,d). In comparison to low-wing conditions explained above, all high-wing configurations are lower in directional stability. In the presence of the horizontal tail, the variations due to wing position are ggnerally less than without that surface. The rotation or circulation of the flow field discussed above, is evidently reduced when adding a pair of horizontal “fins” to the fuselage.

End-Plate Effect. A horizontal tail surface added to a vertical fin, would be expected to have the same effect as an end plate attached to a wing tip. For an average horizontal tad which may have a span twice the height of the vertical tail surface the effective aspect ratio of the surface is theoretically increased to = 1.8 A as indi­cated in Chapter III. Based on equation (14) the lateral force derivative dC^ /d^ of the tail assembly would then be increased from 0.026 to 0.042 for A^ = 1, or from 0.045 to 0.063 for A^ = 2, for example ratio’s of 1.6 and 1.4 respectively.

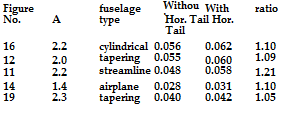
Fuselage Wake. Experimental values for dC/d^ , show­ing the influence of the horizontal upon the vertical tail, are as follows:

dCju/d/3

It is evident from these statistics that the large improve­ment indicated by theory, resulting in a ratio around 1.5 (as discussed above) are not obtained in configurations where the horizontal tail is attached to the fuselage. It must be assumed that the wake (boundary layer) develop­ing along the fuselage disrupts the lifting line or the trailing vortex sheet originating from the tail assembly eliminating the predicted and plate effect.

INFLUENCE OF WING AND HORIZONTAL STABILIZER ON VERTICAL TAIL

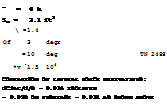
Подпись: 0 0.1 0.2 °.3 CS С„Ис/Є) Подпись:INFLUENCE OF WING AND HORIZONTAL STABILIZER ON VERTICAL TAILПодпись: ^ = 4 h S„ = 3.1 ft2  = 1.4 Of 3 degr = 10 deg TN 2488 *v = 1.5 106 COMPARISON OF LATERAL FORCE DERIVATIVES: dCiat/d/S = 0.034 ISOLATED = 0.028 ON FUSELAGE = 0.031 AS SHOWN ABOVE Подпись:

Influence of Canopy. The experimental results discussed so far, regarding cross flow and sidewash at the vertical tail, apply to perfectly smooth and plain wind tunnel models. Test results for the complete airplane configura­tion shown in figure 13, tested with the wing in low as well as in high position show:

a) Without the vertical tail, lateral forces and yaw mo­ments are essentially the same for both wing positions.

b) With the tail on, its contribution to both force and moment is larger for the low-wing configuration.

The ratios of the due to tail derivatives, LW/HW ^ 1.4, or HW/LW ^ 0.7, are in the same order of magnitude as those which can be obtained above. [121]

Figure 14. Distribution of lateral or normal force (load) in vertical surface and fuselage tail end of a fighter-type airplane configura­tion (9,g).

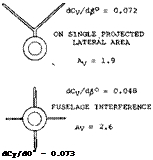
INFLUENCE OF WING AND HORIZONTAL STABILIZER ON VERTICAL TAILПодпись: dCy/d0° = 0.073 The Load Distribution over the vertical surface of a con­ventional airplane configuration, is plotted in figure 14. While the load in the tail end of the fuselage is practically zero without surfaces attached, a small lateral force is induced when adding the vertical fin. The force in the tail of the fuselage is further increased when adding the hori­zontal surface (preferably in the lowest possible position). However, the lateral force in the vertical surface is very much reduced as against the theoretically expected load. In fact, when attached to the fuselage, the force derivative of the fin in figure 14 is smaller than in free flow.
dC^/d^ = 0.039 in free flow (estimated)

= 0.023 when attached to fuselage = 0.027 with horizontal tail as shown

To explain this result obtained at a reasonably large Rey­nolds number the original report (9,g) stated “large losses in dynamic pressure resulting from the wakes of the canopy and wing-fuselage juncture, were found to occur in the vicinity of the vertical tail”.

It can also be said that the vertical tail, having an exposed area ratio S^/S between 5 and 6% only, is too small and not high enough.

INFLUENCE OF WING AND HORIZONTAL STABILIZER ON VERTICAL TAIL

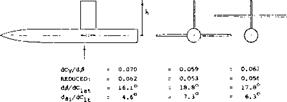
AR RATIO = 1.8 = 1.2 = 1.4

"REDUCED" MEANS THAT THE RESULTS AS TESTED AT M = 0.5 KERE REDUCED TO M O, BY DIVIDING BY FACTOR OF 1.1.

THE LATERAL FORCE ANGLE CORRESPONDING TO 0.062 (FOR EXAMPLE)

IS d^/dClat = 16.1°, WHERE 16.1 – 11.5 = 4.6° REPRESENTS THE INDUCED ANGLE.

FOR COMPARISON, THE LIFT-CURVE SLOPE OF AN ISOLATED RECTANGULAR SURFACE WITH A = 2.2 IS delat/d4 = 0.050.

AR RATIO MEANS (EFFECTIVE/GEOMETRIC) ASPECT RATIO.

NOTE: c = 0.5 ft CHORD OF 64A0.0

h = 1.1 ft – FROM FUSELAGE AXIS

S = c h ft: = REFERENCE AREA

Rc = 1.6 (10) = REYNOLDS NUMBER

NACA RM L53J19

Figure 15. Effectiveness of a vertical tail surface (fin) tested (6,b) on a cylindrical “fuselage”.

Horizontal Tail Position. In all examples listed above, the horizontal tail increases the effectiveness of the vertical surface by approximately 10%. From the available experi­mental results plotted in figure 16 the vertical position of the horizontal surface on the vertical fin changes the lateral force derivative as follows:

a) The horizontal surface at 1/2 the height of the vertical tail reduces the effectiveness.

b) maximum derivatives are obtained with the horizontal on top of the vertical tail

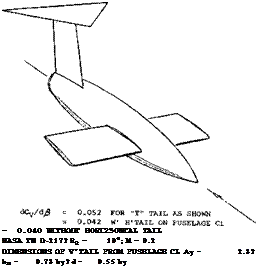
‘T” Tail In uppermost position, the horizontal surface forms a “T” together with the vertical fin. As explained in (15,e), advantages of the “T” tail are as follows:

a) the stabilizing effectiveness of the vertical tail is in­creased.

b) the horizontal tail is removed from the field of maxi­mum downwash and the irregularities of the propeller slipstream (if there is one).

c) lateral tail effectiveness is preserved to highest angles of attack.

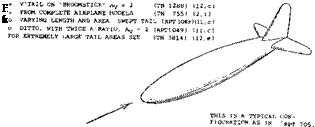
A “T” tail is also included in figure 17. Another “bold” configuration is shown in figure 18. In all examples tested, the experimental values obtained, remain somewhat below the theoretically expected lateral force derivatives.

INFLUENCE OF WING AND HORIZONTAL STABILIZER ON VERTICAL TAIL

Figure 16. Effectiveness of vertical tail surfaces, as a function of the vertical position at which the horizontal surface is attached.

of = о TO 10° Rv = 5(10)5 £5A006

INFLUENCE OF WING AND HORIZONTAL STABILIZER ON VERTICAL TAIL

dCv/d£° = 0.026 EACH

VERY INEFFECTIVE

INFLUENCE OF WING AND HORIZONTAL STABILIZER ON VERTICAL TAIL

MOST EFFECTIVE

Figure 17. Lateral force derivative developing in the tail configura­tion shown (6,a).

INFLUENCE OF WING AND HORIZONTAL STABILIZER ON VERTICAL TAIL

(15) Characteristics of “T” tails:

a) Sleeman, Auxiliary Surfaces, NASA D-804 (1961).

b) Goodson, “T” Tail and Double Tail, NASA D-950 (1961).

e) Multhopp, “T” Tails, Aero Digest May 1955.

Подпись: = 0.040 WITHOUT H0RI250NTAL TAIL NASA TN D-217? RQ ~ 106; M - 0.2 DIMENSIONS OF V'TAIL FROM FUSELAGE CL Ay = 2.3? bH = 0.73 hy? d = 0.55 hy Подпись:

Figure 18. Lateral force characteristics of a vertical tail surface (I6,b) for three different arrangements of the horizontal surface, including that of a *T” tail.

“V” Tail The lifting characteristics of dihedraled wings are presented in Chapter III. The neutral force in each panel of a combined horizontal plus vertical tail assembly as in figure 19, approximately corresponds to

dC/v/do^7?=(dC^ /doC)a

where “o” indicates the lift curve slope for the dihedral angle Г – 0. When exposing the “V” tail to an angle of yaw, the angle of attack normal to the panels changes as

oCn — sin^e sin Г

The lateral component of the neutral forces (Fу = N sin Г ) thus corresponds to

dC^. Ids = (dC^ /doc)o sinzT

This mechanism is easily understood for zero lift (where the angle of attack is zero). When at an angle of yaw, one side (one panel) then assumes a positive and the other one a negative normal force. Disregarding a rolling moment, the resultant is the lateral force indicated in the last equation.

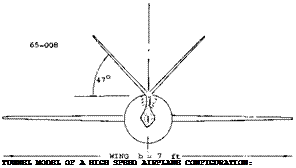
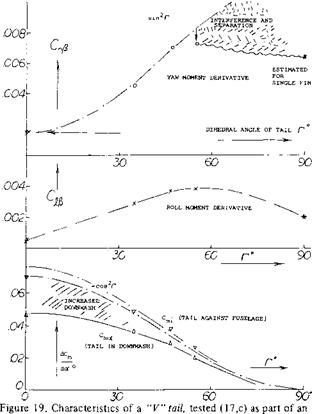
“V” Derivatives. Experimental results of a “V” tail tested alone (without a fuselage) are presented in Chapter XI. Lateral and longitudinal characteristics of a single-engine airplane model using a variable “V” tail are reported in (17,c). Figure 19 shows configuration and derivatives as tested. It should be noted in particular:

1) that interference and flow separation starts above Г = 45°,

2) that the tail panels move up and into reduced down – wash, as the dihedral angle is increased,

3) that a roll moment due to yaw is obtained, similar to that in a dihedraled wing.

The particular “V” tail tested, is mounted on top of a dorsal “trunk”. The apex point of the tail is thus raised above the fuselage wake. The dorsal part also adds to lateral surface area. As a result, the lateral force derivative is some 30% larger than according to basic “V” tail theory (see Chapter III).

s =

8.1

ft2

A1RATIO OF TAIL =

5, FOLDED DOWN

5 =

1.2

ft

st =

.41

S

TO HINGE LINE OF 1

"ELERUDDER"

Л =

.53

b,

SHOULD BE 0.47 b,

EFFECTIVE

NACA TN 1478 (18,c)

DERIVATIVES IN THE GRAPHS REPRESENT THE TAIL CONTRIBUTIONS

INFLUENCE OF WING AND HORIZONTAL STABILIZER ON VERTICAL TAIL

airplane configuration.

Подпись: TAIL SURFACE: WING Ьн = 5.0 INCH b = о ti ll CO INCH c = Jt = Подпись:Подпись:Подпись: O L 0Подпись:Подпись: 04Area Required. A dihedral angle of 30s provides a ratio between vertical and horizontal tail performance that is comparable to conventional tail assemblies. The linear dimensions (chord end projected horizontal span) of the “V” tail should then be l/cos30° = 1.16 times those of the equivalent conventional horizontal tail. The total sur­face area required, is roughly the same. Therefore, if drag is to be reduced by using a “V” tail, this can only be expected on the basis of reduced interference (only 2 panels joining the fuselage, instead of the conventional 3). It must also be taken into consideration that the combina­tion of two different control surfaces in one unit, may pose some problems in design, construction and opera­tion.

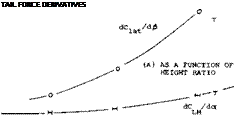
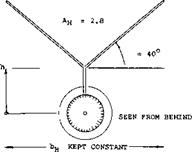
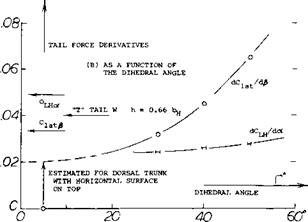
“Y” Tail To avoid any fuselage interference of the “vis­cous’" type described above, the “V” tail can be moved up in the manner as shown in figure 20, thus forming a “Y”, together with the added vertical stub (19). Since in the tail family tested, the horizontal span b^ is kept constant, we have referred all coefficients to the area (cbK ). Of course, the stub must be expected to contribute some lateral force of its own.

Graph (A) indicates how the derivative dC^. /d # in­creases with the height ratio of the vertical part of the configuration. As the tail surfaces are raised more and more, something similar to a “T” tail is obtained; and the “Y” tail is thus realized to be a crossbreed between “V” and “T”. When increasing the dihedral angle of the tail in figure 20, keeping the span b^ constant, the lateral force derivative increases in the manner as shown in Graph (B).

Pitching Moment. Consideration of “V” or “Y” tails is not complete without some account of their longitudinal contribution. Pitching moments of the tail configurations in figure 20, were measured behind a wing with the same aspect ratio and twice the linear dimensions of the hori­zontal tail projection. Using the tail volume = 0.25/0.6 = 0.42, the derivatives dC^ /dal were obtained as plotted in the graphs. The lifting or pitching effective­ness of the tail:

increases when raising the tail assembly out of fuselage

wake and wing down wash,

increases slightly when making the dihedral angle lar­ger, while keeping hH constant.

(16) Characteristics of unusual tail configurations:

a) Sleeman, Tail Configurations, NACA RM L57C08.

b) Fournier, “Exotic” Configurations, NASA D-217 (1960).

c) See “V” tails in (18) and “T” tails in (16)..

d) Sleeman (see a), “Y” Tails, NACA RM L56A06a. [122]

For comparison, we have also put a pair of points into the two graphs, representing a “T” tail having the same height and span as the “Y” tail in figure 21. The lateral and longitudinal effectiveness of the “T” tail is equal to the best “Y” tails. In final analysis, the roll moments due to vertical tails when at an angle of yaw also must be consid­ered, Chapter XIII.

INFLUENCE OF WING AND HORIZONTAL STABILIZER ON VERTICAL TAIL

(NOT,

SHOWN) :

TESTED AT:

10.4

INCH

O’ = ZERO

3.6

INCH

M = 0.6

6.0

INCH

Rc = 5 10;

INFLUENCE OF WING AND HORIZONTAL STABILIZER ON VERTICAL TAIL

006

004 002-

WbH

06

INFLUENCE OF WING AND HORIZONTAL STABILIZER ON VERTICAL TAIL

Figure 20. Stability characteristics of a “Y” shaped tail assembly

(16,d):

(A) as a function of vertical location (length of dorsal piece),

(B) as a function of the angle of dihedral.

I

(18) In the configuration as in figure 21, there is little “viscous” fuselage interference. When used in connection with the tail end of a conventional fuselage, wake interference would be similar to that in figures 13 and 14.

(19) Ribner, Propellers in Yaw, NACA Rpt 819 & 820 (1945).

FUSELAGE INTERACTION

In all airplanes with a central vertical fin, the fuselage has a considerable influence upon the lateral forces produced on and by the vertical surface.

Aspect Ratio. Modern airplanes usually have vertical tail surfaces with an exposed geometric aspect ratio larger than unity. The lateral or normal forces originating in them, may thus be proportional to the angle of yaw or sideslip. The lateral force characteristics of vertical tails can be from the data such as (5,a) or that of Chapter XVIII. In the statistical evaluation of tested lateral forces (subscript “lat”) we will use equation (12) of Chapter XVIII, for indicating the yaw angle required to produce a certain force in the vertical tail. This equation is:

VdCA6 =10° +(10°/Аг)+19°/Ac (14)

Because of physical continuity between fuselage and tail, it is difficult to determine the effective ratio A^; and the magnitude of the effective lateral area due to the appre­ciable amount of fuselage interference upon the vertical surface.

(4) Yaw moments due to other appendages:

a) Jaquet, Fuselage with Ducts, NACA TN 3481 (1955).

b) MacLachlan, Influence of Canopies, NACA TN 1052 (1946).

c) External stores or tanks.

(5) Lateral Force on tails

a) Dods, Nine Related Horizontal Tails NACA TN 3497.

Cylindrical Fuselage. In configurations where the fuselage is a body of revolution, a simple geometric definition for finding the span, area and aspect ratio of the vertical tail surface is to use the distance from the tip to the body’s center line. Lateral force characteristics are shown in figure 9 of a rectangular fin attached to a cylindrical “fuselage”. This configuration is basically similar to the combination of a wing with a tip tank. A theory of the interaction is presented in (7); and tip-tank results are evaluated in the Chapter III.

Roughly, the cylinder will have a lift-increasing effect similar to an end plate. The effective aspect ratio is theoretically increased by a maximum of

AA = Av/(d/b); A^ = A ^(1 + d/b) (15)

Considering the results in figure 8, the “force angle” of the vertical surfaces tested without the presence of a horizontal surface can be explained by combining equa­tions (14) and (15). For example, for the geometrical aspect ratio A^ = 1.33 (measured to the center line of the fuselage) we obtain a sectional angle d^s/dCj^ := 15.7°, and an included component of 19/1.33 = 14.3 . The combined angle is 30°, and the force derivative is thus dCj^ /dj3 – 0.033. This is much smaller than the tested value (0.043). To account for the end plate effect of the fuselage (d/h = 2/3), the function in figure 15 of the Chapter III can be used. The effective aspect ratio is then found to be A^^ 1.33 (1.5) = 2; and the derivative of the lateral angle required, is expected to be d^/dC= 10 + 2.5 + 9.5 = 22 . The corresponding slope of the lateral force is dC^/d^ = 0.045 which is close to the tested value of 0.043 Part (b) of the illustration shows that a tapering afterbody results in somewhat reduced tail effectiveness.

Fuselage Force. In case (c) of figure 9, another vertical tail surface is attached, not to the end of the fuselage, but somewhere near half of its length. The lateral force due to the tail surface (having an aspect ratio of 2.2) is so high that it cannot adequately be explained in the manner as above. Load distribution tests (6,c) carried out on the last (swept) fin in the illustration, reveal that the combined lateral force, on the fin and induced upon the fuselage by the fin, is about 50% larger than that in the exposed vertical area. It thus seems that presence of the fin con­verts that part of the fuselage into a piece of “wing”. The vertical tail effectiveness can be explained or predicted, using equations (14) and (15) considering an area produc­ing lateral forces to be effective within the fuselage, equal in magnitude to (d c) as indicated in figure 8. In practical designs it does not seem likely, however, that a tail surface would not be located near the very end of the fuselage (where the moment arm is longest).

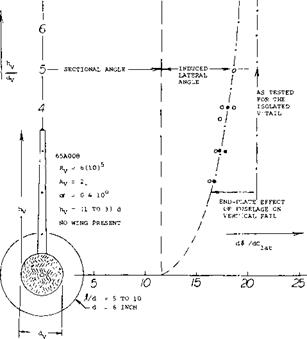
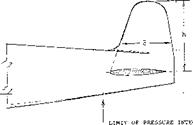
9, may be used in aircraft exhausting the propelling jet through the blunt base. Airplanes with propeller propul­sion, generally have fuselages with a more or less tapering tail end. Experimental investigation of several “families” of vertical fins (9) (10) (11) (12) permits evaluation of their effectiveness as a function of the size of the fuselage to which they are added. In one of those (8) the vertical tail aspect ratio varies between 0.5 and 4.0, and its area S^/ between 0.6 and 6.0 of the fuselage’s frontal area S. Results have been transformed to our method of defining vertical dimensions from fuselage center line. Figure 9 demonstrates for the nominal aspect ratio A^ = 2, how the lateral force angle derivative d^/dC^y. = l/CdC^./d^) varies as a function of the tail size ratio hyz/d’^, where dy = diameter of the fuselage at the quarter-chord location of the vertical tail attached to it.

(6) Vertical tails on cylindrical fuselages:

a) Sleeman, Various Configurations, NACA RM L57C08.

b) Wiley, Fin on Cylinder, NACA RM L53J19.

c) Wiley, Swept Fin & Horizontal Tail, NACA RM L55E04.

d) Few, Tails on Boat-Tailed Body, RM L57D22.

(7) Theoretical analysis of fuselage interaction:

a) Hartley, Wings with Tip Tanks, ARC CP 147 (1954).

b) Weber, Wings with Cylinder, ARC RM 2889 (1957).

(8) Michael, V’Tail Fuselage Interference, NACA TN 3135 (1954).

Подпись: A VARYING TAIL AREA, Ay = 2.1 (TN 1094) (12,b) A DITTO WING FLAPS DOWN, CL = 1.4 (TN 1094) (12,b) X VARYING TAIL LENGTH, Ay = 1.3 (TN 1766) (14,a)
FUSELAGE INTERACTION

13-8

The results can be interpolated by

й/>Ійсиі =12° + 18АЧ

where = effective aspect ratio of the tail surface, including the end-plate effect of the fuselage:

A^ = 2(l+2(d^/hA)) (16)

Assuming that the maximum diameter of the fuselage might statistically be d = 2 d^ , we readily obtain equation (15). The fuselage’s end-plate effect is thus the reason why the functions in figures 10 and 20 are or should not be straight lines.

Figure 9. Evaluation (8) showing the end-plate effect of the fuselage upon the vertical tail surface.

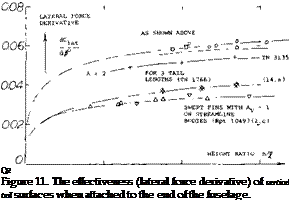
Fuselage Length has an effect different from diameter. In figure 11, we have plotted the lateral force slopes of several series of vertical tail surfaces against the size ratio h/f. The tail effectiveness increased by the end-plate effect of the fuselage is reduced because of presence and growth of the boundary layer along the fuselage. Since the “volume” of the viscous wake at the end of the fuselage is proportional to its length “j(”, the favorable interaction with the vertical surface (fin) is reduced as a function of I /h, or increasing with Ъ. Ц. Of course, when increasing the size of the vertical surface indefinitely, the force derivative should come down again, ending up at the level as for the isolated tail.

(9) Influence of horizontal on vertical tail:

a) Katzoff, End-Plate Effect, NACA TN 797 (1941).

b) Murray, End-Plate Effect, NACA TN 1050 (1946).

c) Brewer, Swept Tail Surfaces, NACA TN 2010 (1950).

d) Rotta, Aerodynamic Characteristics of Wing with End

Plate at One Tip, Ingenieur Archiv 1942 p. 119.

e) Root, Empennage Design, J. Aero. Sci. 1939 p. 353.

f) MacLachlan, Directional Stability, NACA TN 1052 (1946).

g) Подпись:FUSELAGE INTERACTIONПодпись: WRPTS L-8,12,17 (10) 0009 TAIL SECTION d 5.5 INCH Л = 32 Jt = 37 J = 42 INCH h 7 J = 9 $ = 10 INCH ^ = 16 INCH Ay = R 2.2 4 106 Подпись:FUSELAGE INTERACTIONПодпись:Подпись:Подпись: Q3Marino, Load Distribution, NACA TN 2488 (1952).

Подпись: °Y/3V =Подпись:Подпись: CПодпись:Подпись: 0.0041 ( (.0028)) Подпись: *V*fi = ARM RATIO Подпись:Подпись: CYAV cn£V FUSELAGE INTERACTIONПодпись: cn0VПодпись: 0.0042 (.0040) FUSELAGE INTERACTIONПодпись:Подпись:Подпись: = 0.07  = 2 Подпись:FUSELAGE INTERACTION0.059 ! (.042)) 1.00

ESTIMATED

0.0090 (.0083) 0.0038 (.0036 —

О

FUSELAGE INTERACTION

0.064 (.064) 0.94

:. ee)

V ь

*v у –

VALUES LISTED ARE DIFFERENTIALS DUE TO VERTICAL TAIL

(VALUES) ARE TESTED WITHOUT THE HORIZONTAL SURFACE

Figure 12. Interference of wing and fuselage upon the lateral force and the yaw moment produced by the vertical tail surface.

(10) Lateral investigation of one and the same basic wing – fuselage-tail configuration in NACA wind tunnels:

a) Bamber, I – Several 23012 Wings, TN 703 (1939).

b) Bamber, II – Lateral Characteristics, TN 730 (1939).

c) Recant, III – Component Characteristics, TN 825 (1941).

d) Recant, Side Flow at Tail, TN 804 (1941).

e) Jacobs, 209 Combinations Pitching, Rpt 540 (1935).

f) House, 4 Wings, 2 Fuselages, 2 Fins, Rpt 705 (1941).

(10) g) Fehlner, I – 5 V’Areas, 3 Fuselage Lengths, W’Rpt L-12(1944).

h) Hollingworth, II & III – Same as in (g), W’Rpt L -8 & 17

(1945) .

i) Recant, IV – Wedge-Shaped Fuselage, W’Rpt L-520 (1942).

j) Wallace, V – Tapered Wing, W’Rpt L-459 (1943).

(11) Related wing, fuselage, swept tail model family:

a) Brewer, Lateral Characteristics, TN 2010 (1950).

b) Letko, V’tail Stability Contribution, TN 2175 (1950).

c) Queijo, Size & Length of V’Tail, Rpt 1049 (1951).

d) Lichtenstein, Tail Length and H’Tail, Rpt 1096 (1952).

e) Yawing characteristics of same family, see NACA TN 2358.

f) Longitudinal characteristics, see NACA TN 2381 & 2382.

g) Wolhart, Three Aspect Ratios, TN 3649 (1956).

h) Also references (2,f, h) and (4,a) and (13,f). [120]

YAW MOMENTS OF FUSELAGES

The longitudinal moments of slender bodies are presented in Chapter XIX dealing with these bodies. The yaw mo­ment characteristics of airplane fuselages are as follows.

Basic Moments. Theoretically (without viscosity, bound­ary layer, etc.) any elongated body such as a circular cylinder for example, in longitudinal (axial) flow, devel­ops a destabilizing moment. This moment tends to turn the cylinder or any streamline body into the stable posi­tion at or near oC ox/S = 90°. Also, under ideal condi­tions, there is neither drag nor lift. Accordingly, the ideal moment is “free”, it is independent of the point of reference. In reality, every “slender” body develops a type of lift normal or lateral force, similar to that as found in slender wings.

Contrary to conditions in such wings (where the linear lift component is concentrated near the leading edge), this force originates by way of viscous boundary layer mo­mentum losses, primarily in the rear half of the body length. Thus with conventional fuselages the yaw moment resulting from such lateral forces, is stabilizing.

REFERENCE POINT SHAPE CY x/f Cna. C STABILITY J/d

IFOR Cna . * 9P 4

YAW MOMENTS OF FUSELAGES

NOSE POINT – REFERENCE FOR YAH MOMENT Cn.

Figure 2. Directional characteristics of a series of streamline bodies or fuselages.

Fineness Ratio. A series of three streamline bodies is shown in figure 2, varying in length/diameter ratio be­tween 5 and 10. The yaw moment of these bodies is presented in form of the coefficient

C^=“N”/qid2 (3)

To facilitate analysis, the moment is also referenced to the nose of the bodies, in form of the derivative

C7?^S = ^7ty5 + °-5 (4)

where 0.5 = A x/jL == distance between the nose point and the original reference axis at 0.5/. Any moment about the nose point is the sum of two components:

1) the destabilizing theroetical or the moment based on ideal flow.

2) the stabilizing moment due to the lateral force.

As explained in Chapter XIX on “slender bodies”, the maximum moment based on ideal flow approximately corresponds to

Cyp = — 0.015 (destabilizing) (5)

In comparison to this equation, the theoretical moment decreases if the fullness of the body shape and/or the length ratio is reduced. The theoretical derivative is approximately:

Су,* = — 0.015 for high length to diameter ratios

= — 0.012 for length = 6 (diameter)

= — 0.009 for length = 4 (diameter)

Lateral Force. As noted in figure 2 the lateral force coefficient of the bodies is referred to the squard of their diameter

Cy4 =Y/qd2 (6)

the derivative of this coefficient increases approximately in proportion to the length ratio. This means that the lateral force grows in proportion to wetted area, skin friction and drag. If referring the coefficient to the “area” (di ) the roughly constant force derivative

dCy I dp = (d/i ) dCyd I dp = 0.003 (7)

is obtained. This value must be expected to vary in pro­portion to the body’s drag coefficient (shape, surface roughness, appendages, interference).

Roughness. The streamline body in figure 3, was tested (2j) in smooth condition as well as with stand-type rough­ness applied to the surface. Using a grain size к of 0.9 mm, so that кЦ ^ 0.001, the minimum drag coefficient was increased fourfold and the lateral force was doubled. In non-viscous fluid flow, the longitudinal of yaw moment would correspond to equation 5. Considering skin friction and when adding roughness, two things are to be ex­pected:

1) the theoretical destabilizing moment will be reduced

2) part of that moment will be replaced by lateral force.

YAW MOMENTS OF FUSELAGESПодпись: G6-Since the force is likely to develop or to be centered in the rear half of the body length, the corresponding mo­ment about the fuselage’s or airplane’s CG, is usually stabilizing.

cL


YAW MOMENTS OF FUSELAGES

LIFT


ROUGH


0.4

02


2 (10)6


d = 0.15 S. = d27/4


R


/0


YAW MOMENTS OF FUSELAGESYAW MOMENTS OF FUSELAGESYAW MOMENTS OF FUSELAGESYAW MOMENTS OF FUSELAGESYAW MOMENTS OF FUSELAGES

YAW MOMENTS OF FUSELAGES

at = ZERO

DERIVATIVES AROUND

P = 0;

SMOOTH

ROUGH

SURFACE

Clat

= Y/zS.;

CY/S

= 0.0080

= 0.0170

DATERAI, FORCE

cn

= "N"/qS. i ;

Cn,

= -.0098

= -.0046

YAW MOMENT

CD.

= Dmin/clS- =

CD.

= 0.051

= 0.202

MINIMUM DRAG

Figure 3. Directional characteristics of a simple fuselage body, tested (2,j):

a) in smooth condition,

b) with sand-type roughness added.

(2) Directional characteristics of fuselage bodies:

a) See references in the chapter on “slender bodies”.

b) Allen, Influence of Viscosity, NACA Rpt 1048 (1951).

c) Queijo, Tail Size and Length, NACA Rpt 1049 (1951).

d) Lichtenstein, Tail Length, NACA Rpt 1096 (1952).

e) Bates, Flat Fuselage Shapes, NACA TN 3429 (1955).

f) Letko, Cross Section Shape, NACA TN 3551 (1955).

h) Letko, Cross-Section Shapes, NACA TN 3857 (1956).

i) Pass, Directional Stability Information, NACA TN 775 (1940).

j) Engelhardt & Hoerner, Influence of Surface Roughness, Rpt Aerodynamic Laboratory TH Munich 1/1943.

YAW MOMENTS OF FUSELAGESПодпись: AERODYNAMIC = AC CENTER і Подпись: CПодпись: ЛYAW MOMENTS OF FUSELAGESLocation of Force. In the sand-covered body in figure 3, the experimental results can be obtained analytically when reducing the ideal moment equation 5 by 20%, and assuming that the lateral force be centered around 0.6 of the body length. The three lengths in figure 2 have been evaluated, using tested values and equation 5 with a con­stant of — 0.012 as well as — 0.011. Using equation 7 the stabilizing component due to lateral force, is estimated to be

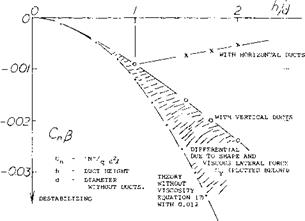
CnA = + (x/i) 0.003 ЦЦ) (8)

It then seems that the center of the viscous force is at x between 0.6 and 0.8 of the body length.

Shape. It is evident in figure 2, that the body with the round and full forebody has a larger destabilizing mo­ment. On the other hand, the last shape, with a heavier afterbody (and a blunt base) is seen to be more stable. The family of plain fuselage bodies shown in figure 4 was tested (2,f, gji) with the same length and volume, but differing in cross-sectional shape. At angles of yaw up to 8° for one shape and to 15 for another the lateral forces and yaw moments vary in linear proportion to the lateral angle, so that the corresponding derivatives are constant. In terms of fuselage lenth f and the diameter d of the “round” type, results are presented in form of the coeffi­cients defined above. The moment derivative is listed as tested (about the half-length axis) as well as about the nose point. In terms of lateral force the rectangular shapes behave in a manner similar to “wings”. The “flat” body produces the smallest, and the upright rectangular shape the largest lateral force.

0.58 POINT WHERE LATERAL. ^FORCE IS CENTERED

YAW MOMENTS OF FUSELAGES

x ——– ► .46 DITTO FOR 0.01-2 IN E(7)

YAW MOMENTS OF FUSELAGES

((0.53(0.015) = 0.008; 0.010 – 0.008 = 0.002; 0.01И09)2 = 0.009;

0.009 – 0.002 = 0.007; 0.007/0.015 = 0.46 r x/f ) )

.33 CY<* =

YAW MOMENTS OF FUSELAGES

AC

EQUATION (7) WITH 0.011

0.011

– 0.007

ORIGINAL POINT OF REFERENCE 0.33Jf

Figure 4. Lateral and directional characteristics of a family of four basic fuselage shapes, analyzed as explained in the text.

Analysis. All body shapes in figure 4, except the round one, are slightly unstable (about the nose point). This means, considering the fuselages to be wind vanes, they would assume a small angle of yaw (either positive or negative). The lateral curvature of the rectangular shapes evidently produces destabilizing suction forces. Using slender-body theory as presented in Chapter XIX, the basic destabilizing moment corresponds to the derivative as in equation 5 using the maximum height (h) instead of

(d) , and with a constant of 0.011. Referring the moments of all shapes tested, to the diameter (d) of the circular cross section, their theoretical derivatives are

dC^/d = 0.011 (h/d)2 = Cjidp (9)

After subtracting this ideal from the experimental total values, derivatives C77are obtained, tentatively repre­senting the moments due to the tested lateral forces. The center of these forces is then found to be at

XU ~ ^nV/3 (1°)

In the rectangular shapes, the center is between 0.3 and 0.5 of the length. The round shape shows, on the other hand, a location between 0.6 and 0.7 of the length. It seems that the flow goes smoothly around the forward end of this fuselage, and a lateral force only develops on the leeward side of the rear half of the length.

“Ducts”. Figure 5 presents the directional characteristics of a fuselage to which a pair of ‘’ducts” (solid bodies, without internal flow) were added. When exposed to an angle of yaw, the destabilizing moment is increased due to the ducts located on top and below the fuselage. Roughly, the ideal moment might be expected to grow with the square of the combined height “h”, as indicated by equa­tion 5 used with a constant of 0.012. In reality, the lateral area of the fuselage plus duct combination increases at a lesser rate than h. Also, the lateral force, the derivative of which is plotted in the lower part of the graph, is likely to contribute a stabilizing component to the yaw moment. Assuming, for example, a location of the force’s center, 0.3 X behind the yaw axis, approximately 2/3 of the differential indicated, can be explained. For the rest, it can be argued that the constant of equation 5 must reduce, as lateral forces replace the ideal moment.

Lateral Ducts. The vertical inlets shown in figure 5, were also tested when attached to the sides of the fuselage as wing root ducts. The graph shows that the value of the unstable yaw-moment derivative slowly reduces with a reduction of combined width of fuselage plus the pair of ducts. Important is the fact that the moment does not grow with the volume added to the fuselage. Rather, height and lateral projection are responsible for the magni­tude of the destabilizing yaw moment. The reduction as

tested, might be explained by viscosity. It should also be noted that the pitching moments of the “ducts” as shown in figure 5, are presented in Chapter XI.

When applying ducts to the side of the fuselage it is generally desirable to install a boundary layer bleed sys­tem or allow the duct area to project above the boundary layer. This is necessary so as to provide the engine with air at high levels of ram efficiency. Also, if the inlet ducts supply a single plenum chamber it is possible to encounter a directional instability. Such an instability was en­countered on the original F-80 airplane. In this case the airplane tended to yaw to an angle where one side duct had clean air without boundary layer flow, the opposite side being effectively stalled. The stabilizing yaw moment corrected the yaw angle causing the other duct to operate in clean air. This alternate filling of the opposite duct resulted in a yaw oscillation that was unsatisfactory. The addition of boundary layer bleed ducts in the system corrected the problem.

YAW MOMENTS OF FUSELAGES

HEIGHT RATIO

Fuselage Forward. Directional characteristics of a wing – body combinations are presented in figure 6. The “fuselage” in the center might be found in a configuration where the tad surfaces are supported by a pair of booms within a tailless airplane. Dividing the fuselage contribu­tions (based upon wing dimensions):

AC^s/ACyp =-0.0012/0.0010 = – 1.2 = Ax/b

(П)

we find that the neutral point in regard to the moment about the vertical axis, is located at (1.2 b) forward of the CG of the airplane. The yaw moment caused by viscosity and lateral force evidently combines with the ideal mo­ment to make the configuration very unstable. Assuming that this ideal moment may correspond to

C7*3=C//bXdz/S) 0.013 =

0.99 (0.077) 0.013 = -0.0010 (12)

the remaining component is —(0.0012 —0.0010) = —0.0002. Dividing by the derivative of the lateral force coefficient лСУ/з = 0.0010, yields A x/b —0.0002/0.0010 = 0.20. In other words, the center of the lateral force is estimated to be (0.20 b) ahead of the CG at x/j( = 0.55, as shown in the illustration.

dCL/do( = 0.058


YAW MOMENTS OF FUSELAGES

YAW MOMENTS OF FUSELAGESYAW MOMENTS OF FUSELAGES

Подпись: Figure 5. Directional characteristics of a fuselage (TN 3481) with a pair of “ducts” added on top and below.

Figure 6. The yaw moment contribution of a forward located fuselage.

Engine Nacelles. The “fuselage” in figure 6 resembles a plain and smooth engine nacelle. Analysis as above, sug­gests that the stabilizing yaw moment due to lateral force about the CG of a conventional airplane configuration may be small. Equation 7 might thus be adequate to predict the yaw moment due to ordinary engine nacelles. Engine nacelles, installed in the wing, also differ from fuselages as to their length. The ratio X /d is smaller and the nacelle body generally blends into the wing. A model – tested example of a typical nacelle is presented in figure 7.

YAW AXIS THROUGH CG

YAW MOMENTS OF FUSELAGES

FOCKE-WULF FW-200 LONG RANGE (ATLANTIC)

OPERATIONAL ABOUT 1940

b = 33 m ENGINE NACELLE TESTED M) ONE OF 4,

S 121 ш2 ON A 1 TO 25 SCALE MODEIL AT

Vx = 360 km/h Rc = 4(10)[116] FULL-SCALE: NACELLE

4 x 720 HP DIAMETER = 1.4 m

CD = 0.02 min

ENGINE NACELLE TESTED AS ONE OF 4,

ON A 1 TO 25 SCALE MODEL AT Rc = 4(10)6 FULL-SCALE NACELLE DIAMETER = 1.4 m

Figure 7. Directional characteristics of an engine nacelle (3,b) tested as part of the wind tunnel model of a 4-engj. ne military airplane.

Splitting the body into two halves, the upper one may roughly have an effective length ratio J( /d = 2, and the lower one = 4. As explained above, the yaw moment coefficient, equation 5, reduces with the length ratio. The reduction factor is about 0.6 for J /d = 4 and 0.4 for X /d = 2; the average is 0.5. Since the length is different in the two halves of the nacelle considered, we will refer the moment as tested to (d3); thus:

C^3 = “N”/qd3 = C^(//d) (13)

Using the factor as above and the average “exposed” length ratio = 3, we obtain from equation 7:

(С7*У% = ~ °-5 (°-013) [117] [118] [119] = – 0.020

This result is slightly higher than the tested value (0.019). Using the experimental lateral force differential due to the nacelle, (Суd )уз = 0.005, a stabilizing component

(Cnd3)A =(Cyd)fi (Ax/d) = 0.005 (Дх/d)

can be found. To explain the difference as above (0.020 — 0.019) = 0.001, the center of Cyd must be assumed to be (0.001/0.Q05) = 0.2 nacelle diameters aft of the yaw axis through the CG (as indicated in the illustration). However, the cowling (ring) at the front end of the nacelle would increase the destabilizing moment above the value of — 0.020 as computed above.

Airplane Configurations. The fuselage and engine nacelles of typical airplane configurations without a vertical tail attached and propellers have destabilizing yaw moments about as follows:

single engine in fuselage C^ =-0.0001 typical twin-engine = — 0.0002

four-nacelle configuration = — 0.0003

These moments are small by comparison with typical vertical tail surface which contributes a stabilizing deriva­tive between 0.0005 and 0.0010.

III. VERTICAL TAIL CHARACTERISTICS

The purpose of die vertical tad surface is to provide directional stability and control moments. Analysis of the yaw moments developed is complicated by the structural connection between tail, fuselage and horizontal surface.

DIRECTIONAL CHARACTERISTICS OF AIRPLANES

In considering the directional characteristics of airplanes it is assumed that the wings are kept horizontal by a suitable deflection of the ailerons. Thus, the vertical axis may be isolated from those in the other two directions. The static stability of such motions is then of the same type as that of a weather vane (“weather cock”). Subjects discussed in this chapter are: yaw moments due to fuselage and engine nacelles, stabilizing and control characteristics of the vertical tail and the influence of the propulsion system on yaw moments. Yaw moments arising in the wing (in connection with roll moments) are presented in Chapter XIV on lateral stability.

I. GENERAL

“Yawing” is meant to indicate rotation about the normal (or vertical axis). The angle of yaw indicates the

angular displacement about that axis, of the airplane in relation to the wind. In contradistinction, sideslipping means a lateral displacement of an airplane, without rotation, as in figure 1. However, to get into a sideslip, the pilot has to yaw his airplane first. As far as the usual wind tunnel tests are concerned, the models are not “yawing” at all. The term “yawing” moment thus seems to be misleading. Actually, static forces and moments are measured at an angle of yaw, or in sideslipping condition. It thus seems to be better to call this type of moment “yaw moment”. In a dynamic analysis of motions about the normal axis, there is also a damping moment due to yawing. This moment will be discussed in the dynamic part of Chapter XIV dealing with “lateral stability”.

Подпись: Figure 1. System of axes used in analysis and presentation of directional characteristics of airplanes.

Подпись: (1) Regarding systems of reference for forces and moments, see NACA Rpt 474 (1933), or Perkins & Hage “Performance Stability Control”.

Reference. The system of axes used in this chapter is illustrated in figure 1. The angle of yaw ” and/or of sideslipping due to yaw or when sideslipping, are

defined about the vertical or lift axis, while the “lateral” force is normal to the fuselage axis. There is a convention whereby forces and moments are designated to be positive when their direction coincides with “positive” displacement of the airplane, that is a motion to the right is positive as seen by the pilot. It must be noted, however, that the angles /3 and ^ have opposite signs. A stabilizing yaw moment (“N”) produced by a vertical tail-surface would thus be represented by a positive value of the derivative d“N”/d/^, or a negative value of d“N”/d^ , while the derivative of the lateral force in the tail responsible for the moment would have the opposite sign in either case. To avoid any misunderstanding, it is recommended to think in terms of “stabilizing” or “destabilizing”, regardless of the direction (right or left) into which the airplane may turn.

Yaw Moments arising in conventional airplane configurations, are as follows:

a) due to fuselage and nacelles, usually destabilizing;

b) stabilizing moment provided by the vertical tail surface;

c) a destabilizing contribution due to propeller normal force, (see figure 3 chapter XII)

The yaw moment derivative of the wing can theoretically be zero. In reality, a stabilizing component is associated with the roll moment which every airplane requires for lateral stability, chapter XIV. In the discussion of direc­tional stability in this chapter, it is assumed that any roll moment be eliminated (balanced) by aileron deflection. In short, the wing is assumed not to contribute to the yaw moment of the airplane.

Notation. The notation specifically applying to directional characteristics is as follows:

Y = lateral force; “N” = yaw moment

where “N” (indicating the “normal” axis about which the moment is defined) should not be confused with N, de­noting “normal force”. Non-dimensional coefficients are

С у = Y/qS; and Cn = “N”/qSb (1)

where S = wing area and b = wing span of the airplane considered. Usually, and at least within the range of lift coefficients below stalling, the lateral force as well as the yaw moment vary in proportion to the angle of sideslip­ping. The most convenient way to describe this variation is by means of the derivatives

Су/з = dCy jdp; and С-ті/З = dC^/d/5 (2)

where /5 = angle of sideslipping, in degrees. In airplanes, the axis about which the yaw moment is taken, is usually the vertical (or the normal) through the CG.

Static Stability. Like the longitudinal case an airplane will have or will be statically stable when it has the tendency to return to its direction of flight after being disturbed. Although there is always an interacting roll effect it is possible to assume proper compensation so that the yaw stability is treated separately. Thus if the airplane has static stability in yaw a moment must be generated from the displacement that will tend to return it to a zero slideslip. Thus in the stability axis of notation dQv/dfi must be positive, figure 1, if the airplane is to be statically stable in yaw.

FLUID DYNAMIC LIFT SECTION LIFT AS INFLUENCED BY ROTATION

Blade Section Lift: The thrust or lift produced by heli­copter rotors, propellers and fans depends on the blade section lift characteristics. The lift of the blade sections is influenced by the three dimensional boundary layer developed on the blade due to the effects of rotation. Tests on various sections of a rotating propeller (24,a) have shown that both the lift curve slope and the maximum lift coefficient of a section will increase when installed on a rotating blade. These data (figure 38) show the increases are greater on the inboard sections. On the outboard sec­tions of the propeller the section lift characteristics ap­proach that of the two dimensional airfoil. These data confirm the pressure distribution data given in (24,b) and the operating characteristics of propellers which show much higher blade angles for stall than would be expected based on two dimensional airfoil data. This is illustrated by a Cu of 3.2 for the section near the hub, r/R = .4, com­pared with the two dimensional value of CL* of 1.4 as shown on figure 38.

The increase in Clx on the inboard sections is caused by a delay of separation due to the action of centrifugal force causing an outward displacement of the boundary layer and a corresponding reduction of its thickness. This boun­dary layer displacement sets up Coriolis forces (24,c) which accelerate the boundary layer in the direction of the flow. Thus a favorable gradient is set up which prevents separation and thus leads to the improved lift curve slope and the C^/ observed on the inboard sections of the propeller.

Based on the above it is apparent that when applying two dimensional airfoil data in the analysis of helicopter rotors, propellers and fans that the effects of rotation on the characteristics of the airfoil data must be considered. The effects of rotational speed, blade radius, airfoil type and basic operational lift will influence the magnitude of the change that can be expected.

FLUID DYNAMIC LIFT SECTION LIFT AS INFLUENCED BY ROTATION

Figure 38. Section lift coefficients as measured on a rotating propellei as a function of blade radius.

SLIPSTREAM EFFECTS ON TAIL SURFACES

In the design and stability analysis of the tail surfaces it is necessary to determine the flow conditions with regard to velocity and direction. The flow at the tail surfaces is effected by the wings and fuselage as discussed in Chap­ters XIII and XIV and can be influenced by the slipstream wash of the propulsive system. This is especially true with propeller driven airplanes as the slipstream cross section is large with respect to the airplane. This makes it nearly impossible to locate the tail surface outside the slipstream at all the flight conditions. In the case of tractor single engine propeller airplanes, the tail surface is influenced by the propeller wash at all conditions. This can be a bene­ficial effect, except when the airplane is operating at a large yaw angle for instance where the tail goes outside the slipstream.

Because of the higher velocities of the efflux of the ducted propeller and turbo fan engines, it is possible to locate the power plants in positions whe the exhaust flow will not directly impinge on the tail surfaces. Because of the higher velocity of the engines, their body shape and induced effects their location becomes important in the design of the tail.

In this section the influence of propulsive lift on the design and analysis of the tail surfaces will be considered.

Wing Lift Interaction with External Jet. When a wing operates in the wake of jet engines a large increase in both the lift and drag coefficients would be expected due to the increased dynamic pressure in the jets. Considering only the forces on the wing the data of (10,a) indicates a nearly constant increment of CL with changes in angle of attack, figure 24. The increment changes with Mach num­ber up M = 0.9 and increases with the engine pressure ratio. Since the jet remains fixed in relation to the wing the flow from the jet will be essentially the same relative to the wing at all angles. Thus, when the angle of attack changes, the efflux of the engine does not change relative to the wing, explaining why the increment in lift remains constant with angle.

At the lower angles of attack, the drag is increased by the efflux of the engine. When the operating CL is greater than.2 the jet exhaust on the wing causes a drag reduc­tion due to a reduction of the induced effects. The pitch­ing moment was not changed due to jet exhaust over the wing.

Slipstream Flow Field. The flow field at the location of the tail as affected by the slipstream of a propeller has repeatedly been mapped (11), (12) showing the dis­tribution of direction (downwash) as well as that of the dynamic pressure. Such surveys can be extremely irregular and their study is likely to suggest that tail surfaces may never work to satisfaction within the slipstream of a propeller. As an example, one such distribution is shown schematically in figure 25. The slipstream is distorted. Behind the usual single-rotation type of propeller (in the airplane tested, turning counter-clockwise) the two sides are not symmetrical. The slipstream rotation (corre­sponding to torque) modified by the directing effect of the wing is displayed, both in the downwash and in the dynamic pressure concentration in certain spots. As a consequence, the average downwash is increased in the left and reduced in the right tail-surface panel of the airplane tested.

SLIPSTREAM EFFECTS ON TAIL SURFACESSLIPSTREAM EFFECTS ON TAIL SURFACESПодпись:Tail Load Distribution. The tail load distribution of the P-40 airplane (tested in the NACA’s Full-Scale Tunnel) is shown in figure 26:
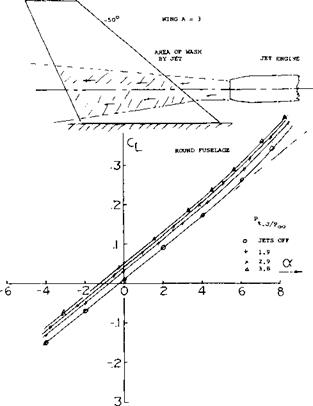
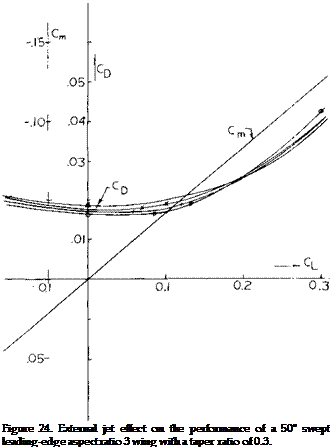
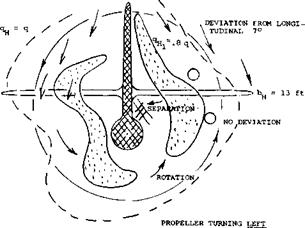
1) Without the propeller and at zero angle of yaw we can expect the loading to be symmetric. The dynamic pressure ratio (outside the fuselage) is essentially qn/q = 1.0. At CL = 0.8 in the wing, the average downwash angle at the tail is £ – -6.5° so that oCH = 10 – 6.5 = 3.5°.

2) The resultant average tail force corresponds to CNW = 0.14, so that (dCN/doc)M = 0-04. This small lift curve slope reflects the strong interference of the fuselage, prac­tically interrupting the lift in the center of the tail surface.

3) With propeller and power on, with a thrust coefficient Tc = 0.7, everything is strongly asymmetric. In particular, corresponding to a downwash angle increased to the level of 8 = —13° the lift on the right side of the horizontal surface is rendered somewhat negative. The average tail force is about half of that with the propeller off. In fact, the tail effectiveness in the power-on condition as shown would be better when taking the right side panel off completely, see (13Ді). [109]

SLIPSTREAM EFFECTS ON TAIL SURFACESПодпись: Figure 24. External jet effect on the performance of a 50° swept leading-edge aspect ratio 3 wing with a taper ratio of 0.3.

4) When at positive angle of yaw (nose to right, tail to left) the basic wing downwash tends to be increased at the right side. However, power and slipstream of the right­turning propeller have an opposite tendency. The most severe asymmetric loading (in pounds) must be expected at high speeds (low lift coefficients) when sideslipping to the left (left wing forward). A corresponding yawing to the right usually takes place in pull-up maneuvers, caused by the gyroscopic moment of the right-turning propeller.

However irregular the distribution may be, horizontal surfaces pick up comparatively continuous normal forces, and they are not necessarily very sensitive as to local dynamic pressure variations. We will, therefore, disregard distributions at first, and we shall evaluate, consider and use the consequences of slipstream as they are integrated by the horizontal surface.

Dynamic Pressure at the Tail. The dynamic pressure with­in the slipstream of a propeller at the horizontal tail is theoretically

qH = q(!+Tc); qH/q = 1+Tc (26>

2

where q = 0.5 ?V = dynamic pressure corresponding to the airplane’s speed “V”. In other words, the added pres­sure ratio is

Aq/q = Tc (27)

Considering a horizontal tail surface completely located within the slipstream, its reactions to variations in the angle of attack or the elevator angle would then tenta­tively be proportional to the ratio to q^ /q. Under realistic conditions, the influence upon the tail surface is smaller however:

1) Depending on what you call thrust (at the propeller or “net effective”) the slipstream loses some of its A q through friction along the fuselage, et cetera.

2) The slipstream mixes with the surrounding flow so that the differential indicated by equation 27 is reduced.

3) The horizontal surface may not entirely be covered by the slipstream (or by those of two or more propellers, according to configuration).

4) The distribution of the dynamic pressure across the span of the tail surface is non-uniform, as mentioned above.

5) The slipstream is limited in size. The lift in the H’tail, therefore, cannot be expected to increase “fully” in pro­portion to (1 + Tc) as in equation 26.

SLIPSTREAM EFFECTS ON TAIL SURFACES

d/bjj = 0.75

Tc = 0.6

CL =0.5

Figure 25. Example for the distribution of dynamic pressure and downwash in the vicinity of the horizontal tail of a single-engine airplane.

where к = .5 as possibly as in equation (28). For example, at CLoC = 1, Tc = 1 for к = 0.5 and dt/doc = —0.4, we may expect to have a tail effectiveness, corresponding to 0.6 (1.5) = 0.09 = constant. However, the airplane is likely to change speed during its pitching motions. Neither q H/q nor downwash and a number of forces and moments depending upon the thrust coefficient are, therefore, con­stant when considering the “static” derivative dCm/dCL.

Vertical Variation. The evaluation above is based upon the condition that the horizontal tail is really “in” the slip­stream, as far as vertical location is concerned. Dynamic pressure ratios are plotted in figure 28 versus the vertical displacement z, above or below the “center” of the slip­stream at the location of the tail. The function found might be expressed by

q H /q = cosn where 9°- к (z/r)m

where k, m and n are suitable constants. In the form as interpreted, a maximum value of

d(qH/q)/d(z/r) = -2 (29)

Подпись:

Подпись: Horizontal Tail Span. The effective dynamic pressure effects at the horizontal tail shave been determined from available experimental results. In cases where the pressure was directly tested, an average value was taken from the distribution across the horizontal-tail span. In some cases the effective pressure was determined from the Cm variation caused by changing the angle of incidence of the tail surface against the fuselage. The dynamic pressure ratios thus obtained are plotted in figure 27. The average ratio reduces as the horizontal span is increased beyond the diameter of the single-propeller slipstream. For example, at bH = d corresponding to d/bH = 1 the graph indicates a q^/q between (0.6 and 0.7)TC so that qu/q ^ 1 + (2/3)Tc . At d > (1.0 or 1.2) bM the added pressure ratio may reach a certain plateau, between (0.7 and 0.8) Tc . As a rough approximation, one might assume qH/q^ 1+0.5 Tc (28) for “conventional” tractor-propeller-driven airplanes. Dynamic Pressure Effects. Considering an airplane in powered flight we will assume that it performs pitching oscillations, at constant speed, with the thrust, thrust co-efficient and dynamic pressure constant at the tail. The contribution of the horizontal tail is then proportional to the angle of attack, times (1 +dc./doc)(qH/q) = (l +de/dcx')(l +kTc)

might be encountered when “leaving” the slipstream area due to the loading distribution on the propeller blade.

SLIPSTREAM EFFECTS ON TAIL SURFACES

X ARC FIGHTERS MODELS (10,b) £> AVA AIRPLANE MODELS (17, d) 0 FROM OTHER SOURCES (TR 941)

SLIPSTREAM EFFECTS ON TAIL SURFACES

Figure 27. Mean dynamic pressure ratio at the horizontal tail located across the slipstream of singe-engine airplane configura­tions.

Downwash Angle. The downwash angle is generally t = w/V, where w = downward velocity imparted by the wing. After adding propeller and slipstream both the downwash velocity (w) and the longitudinal velocity (V) are in­creased, so that

£ = (w + Д w)/(V + v) (30)

where w and t – negative, and v = increment of V. Directly behind the trailing edge of a wing the downwash angle can be expected to be the same as without the slipstream (£~ — oC ). Subsequently, the slipstream tends

SLIPSTREAM EFFECTS ON TAIL SURFACES

Figure 28. Variation of the average dynamic pressure across the slipstream, at the location of the horizontal tail, as a function of vertical displacement from the “center”.

to keep that direction, so that its angle is not reduced as much as the downwash sheet. In fact, the slipstream may be expected to be directed downward at least as much as that of an isolated slipstream or jet. As illustrated in figure 29, the downwash at “some” distance behind such a propeller, is theoretically w = -v cxf, so that the angle corresponds to

6/<x – —v/(V + v)

=-( vt+f; – о/ /1+tc

= -(1 -(1/ Vl + TJ) (31)

20

The fuselage of an airplane was tested (15,g) with operat­ing propeller in front, but without the wing. As plotted in figure 30, the resultant average downwash angle in the slipstream at the location of the tail can be expressed by

<5 = -0.21 (X (32)

where the % power produces a function similar in charac­ter to that in equation (31). For example, at Tc =1, that equation yields £/<x ~ —0.29. Momentum is evidently lost in the slipstream through dissipation and by way of friction along the fuselage. A similar investigation of a fuselage plus propeller, but no wing, in (16,c) shows downwash angles around 80% of the theoretical expecta­tion.

Fuselage + Wing + Propeller. When adding a propeller operating at zero thrust to a fuselage-wing combination, it is quite often found that C ^ as in figure 31 and AE as in figure 32 are both higher (by a few%) than without the propeller. It is also possible that the down wash angle increases at a rate higher than indicated by equation (33) over a small range of the thrust coefficient. The flow pattern along the wing roots (or along the engine nacelles) becomes evidently improved by the slipstream (mixing, turbulence, energy). It seems to be necessary, however, that there is a flow separation first, before the slipstream can have this effect. — Average down wash angles, evalu­ated from distributions at the location of the horizontal surface or as integrated by the tail, are plotted in figure 32. For an average value of d£0 = —0.5 da’, (as in wings with A in the order of 6, at the usual location of the horizontal tail) equation (31) changes into

btlt0 =2-21 l/T+Tc (33)

The experimental points plotted in this form are between 0.5 and 0.8 of the theoretical expectation. Again, there are evidently losses in the slipstream this time also along the wing roots. One reason for the spread in the graph is the wing plan form. In comparison to a tapered wing, a rectangular wing has only some 75% of the downwash in its center plane. When adding the propeller slipstream, therefore, the ratio E І£0 must be expected to be higher in the rectangular and smaller in highly tapered wings.

W = 6000 lb

P = 1000 HP

d = 9 ft

S = 260 ft2

Подпись: Figure 30. Fuselage with running propeller of Navy SBA-1 airplane. Downwash due to the slipstream. jrr^ r^v

SLIPSTREAM EFFECTS ON TAIL SURFACES

SLIPSTREAM EFFECTS ON TAIL SURFACES

DOWNWASH COMPONENT w = – v of DOWNWASH ANGLE £ = w/(V + v)

Figure 29. Downwash produced by a propeller; see (15,b). Ex­ample for a = 10°, Tc =1 and v/V = 0.4. The resulting downwash angle is theoretically £ = —2.9°. [110] [111] [112]

Wing Roots. It is explained in the preceding chapter how most fillets increase, and that cut-outs reduce the down – wash derivative at the location of the tail. Downwash angles tested behind the cut-out configuration as in figure 33 of the first chapter on “longitudinal stability” are included (o ) in figure 32. It is seen that the downwash is reduced to 70% of that of the original complete wing (denoted by £0 ). When adding the propeller slipstream it seems that the 70% ratio is maintained (70% of the increasing function). Cut-outs should, therefore, be very effective in regard to stability. Since the propeller more than replaces the lift that is likely to be lost on account of the cut-away wing chord, not much of a deterioration of performance may be expected. On the other hand, wing – root fillets leading to increased downwash derivatives must be considered to be detrimental to longitudinal stability, particularly when in the slipstream.

(14) Sweberg, Horizontal Tail Load Distribution, NACA W’Rpt L-227 (1944).

(15) Flow field behind twin-engine nacelles:

a) Stiess, Do-17 in Flight, Ybk D Lufo 1938 p 1-206.

b) Schmidt, Do-17 in Flight, Ybk D Lufo 1941 p 1-443.

c) In 2- and 4-engine pusher configurations, see (ll, c).

Jet Propulsion. Jets originating from engines mounted in the wing can also be expected to have some effect upon the flow conditions at the horizontal tail. In the example of a twin-engine airplane as in figure 34, each jet produces some 1500 lbs of thrust through an outlet (nozzle) area of not more than 1.2 ft2. In climb condition, the corre­sponding thrust coefficient (on outlet area) is in the order of Tc = 30, which is more than 30 times what a conven­tional propeller would have in the same flight condition.

Л

AVA

HS-124 TWIN ENGINES 2 Sd/S =

0.35 (21,1?)

NACA

MW NACELLE WITH Sp/S = 0.17

(20,a)

0

NACA

TWIN ENGINES MID-WING

(22,f)

a

NACA

TWIN ENGINES 2 Sp/S = 0.33

(20,b)

X

NACA

B-28 TWIN ENGINES

(22,c)

Y

ARC MID-WING NACELLE

(6, c)

»

NACA

NACELLE MID-WING

(20,a)

©

NACA

4-UNDERSLUNG NACELLES

(23,h)

AVA WING PLUS MW PROPELLER, 0.21

(16,a)

a) WING-NACELLE COMBINATIONS

b) LOW-WING CONFIGURATIONS:

A NACA PURSUIT W’ S /S = 0.38 (l, b)

V NACA No. 12/13 FiBhTER, z/c = 0.1 (l, b)(13,d)

+ ARC "SPITEFUL" WITH Sp/S =0.48 (13,b)

A He-70 AND Me-109 AIRPLANES (.19, b)

II NACA PURSUIT AIRPLANE Rc = 5(10)5 (13,c)

c) MID-WING CONFIGURATIONS:

0 ARC WITH PROPELLERS 3 Sd/S =0.74 (6,d)

H ARC A = 6, d/c = 1.34, CLq = 0.6 (6,a)

= NACA WITHOUT TAIL, Sp/S = 0.35 (13, a)

Подпись:Подпись:Подпись:Подпись:Подпись:SLIPSTREAM EFFECTS ON TAIL SURFACESDownwash Due to Jet. Strong jets as described above may have a downwash practically equal to their angle of at­tack, t = -<x. In comparison to the slipstream of a propeller, the size (diameter) of a jet is small, however. The combined cross-sectional area (2.4 ft2) of the two jets in figure 34 is not more than 3.5% of the horizontal tail area (69 ft2). By comparison of the pitching moments with and without tail and thrust, respectively, it is found in the graph that the downwash angle variation dt/dC^ or da /dec is increased by jet action between 30 and 40%. Qualitatively this result may be explained by spreading the downwash momentum of the jets over a cross-section area equal to that of the horizontal tail. For CL =0.6, where Tc = 30, we may then obtain, for 2 Sj/S = 0.035.
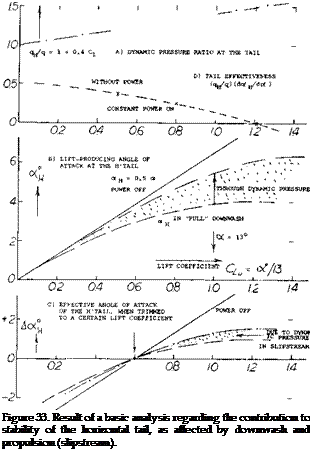
A tie = 0.4 (30)0.035 ~40%

where “0.4” is assumed to be the Д (d£/dcx:) in the original jet as against the downwash ratio behind the wing at zero thrust. This analysis should be refined by intro­ducing Tc~ C L, and A t – f(Tc ). A physical explanation for the influence of the jets upon downwash at the level of the horizontal tail is their dissipation, the transfer of momentum through mixing, upon the surrounding flow.

(17) High-wing, low-propeller airplane configurations:

a) See several German airplane designs in (18,a).

b) Millikan, Lockheed “Vega”, J A Sci 3 (1936) p 79.

c) Hagerman, Single Engine, NACA TN 1339 (1947); for lateral characteristics of same configuration, see TN 1379.

d) Bryant-Williams, “Puss Moth”, ARC RM 1687 (1936).

e) Avion “W”, Serv Tech Aeronautique (Brussels) Bull 15 (1935).

Подпись: Figure 33. Result of a basic analysis regarding the contribution to stability of the horizontal tail, as affected by downwash and propulsion (slipstream). Aft Mounted Engine Tail Interference. Rear mounted en­gines will influence the longitudinal stability of aircraft due to the flow induced on the tail surfaces by the lift of the engines and their supporting structure, by their thrust line orientation with respect to the eg and by interference effects. The aft location of the engine can also be im­portant with regard to the flow interference of the wing on the intake air of the engine. This is illustrated on figure 35 for typical aircraft with aft mounted engines as a func­tion of angle of attack and yaw angle for a range of the flow coefficients (16,e).
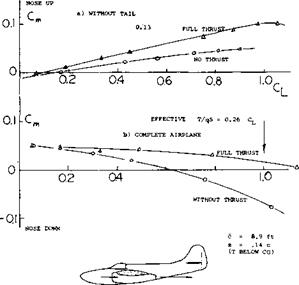
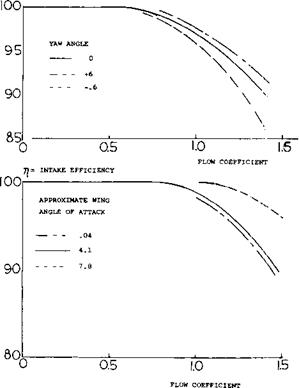
The lifting forces of aft mounted jet engines, including induced and interference effects, will effect the aircraft stability and the tail design. This is illustrated in (16,a) where the placement of aft mounted engines on a trans­port type airplane is investigated. As might be expected, the nacelles located furthest aft generally have the most favorable effect on longitudinal stability, especially at the higher angles of attack, figure 36. This result is expected on the basis of the lift produced by the engine nacelles and their interference effects on the horizontal tail. When the engines are mounted forward on the airplane, it will be noted from figure 36 that a destabilizing moment is produced when the angle of attack is above 20 degrees. At this condition the wake of the flow across the engine nacelles is spoiling the lift of the horizontal tail, thus re­ducing the stability.

Jet Engine Effects on Tail Surfaces. Although the efflux produced by jet engines does not impinge directly on the horizontal and vertical tail surfaces, their location in­fluences the flow at these surfaces (16,a). The level of interference produced by the engines depends on their location, thrust, wing lift augmentation and flight speed. The engine location and orientation with respect to the aircraft eg influences the directional and longitudinal sta­bility due to the thrust moment arms. For instance, the engine out yawing moment of tail mounted engines is generally less than for aircraft with wing mounted engines due to the reduced moment arm. This is especially true for typical four engine transport aircraft as compared with aft mounted two engine aircraft. [113] [114]

SLIPSTREAM EFFECTS ON TAIL SURFACES

TWIN-JETS AT FUSELAGE SIDES, 1.2 ft2 OUTLET EACH W – 10,000 lb; CG AT 27% MAC

T = 0.28 W = RATED, EFFECTIVE THRUST

T = 2(1650) lb = MAXIMUM AT SEA LEVEL b = 45.5 ft. Ьд = 17 ft

S 385 ft.2; Sjj/S = 18 %

WING SECTIONS 66-014 AND 66-212

Figure 34. Bell P-59 first U. S. jet-propelled fighter (around 1943) as tested (16,b) in the Full-Scale Tunnel.

7| = INTAKE EFFICIENCY

SLIPSTREAM EFFECTS ON TAIL SURFACES

Figure 35. Intake efficiency of aft mounted nacelles as a function of angle of yaw and wing angle of attack.


SLIPSTREAM EFFECTS ON TAIL SURFACES

Figure 36. Effect of aft mounted nacelles on longitudinal stability.


Engine-Nacelle-Fuselage Integration. The fuselage nacelle combination can be designed to eliminate interference effects and prevent separation on the cowl by using a coke bottle type contour. Test (23) indicates the axial force can be reduced to just the added skin friction of the engine cowl skin friction. This is accomplished with a thin NACA-1 series cowl which gives a favorable interference effect that more than cancelled out the nacelle pressure drag. Very high drag Mach numbers (0.97) are achieved with such a design.

(19) Engine nacelles with propellers:

a) Wood, Combinations, NACA T Rpts 415, 436, 462 (1932/33).

b) Kuhn, Wing-Propeller Combination, NACA T Rpt 1263 (1956). [115]

(21) Investigation of twin-engine airplanes:

a) Hoerner, Longitudinal Stability of Ju-288 Bomber in the DVL Wind Tunnel, Junkers Rpt Kobu-EW, 18 March 1941.

b) Rogallo, NA B-28 Stability, NACA W Rpt L-295 (1943).

c) Johnson, Lockheed “Electra”, J A Sci 1935/36 p 1.

d) Weiberg, Transport Airplane, NACA TN 4365 (1958).

e) Sweberg, Twin Engine, NACA W Rpt L-425 (1942).

0 Bryant, Longitudinal Stability, ARC RM 2310 (1940).

g) Morris, Analysis of Flight Tests, ARC RM 2701 (1953).

(22) Investigation of 4-engine airplanes:

a) Mathews, Boeing B-29, NACA TN 2238, T Rpt 1076 (1952).

b) Weiberg, Transport Airplane, NASA TN D-25 (1959).

c) Cowley, Armstrong-Whitworth 4 Engines, ARC RM 1624 (1933).

d) Edwards, 4-Engine Swept Wing, NACA TN 3789 (1953/6).

(23) Blaka, Aft Engine Nacelles for M=0.6 to 1.0, NASA TMX-3178.

12-24

Slipstream Effects of Wing Mounted Engines. As with aft mounted engines, the induced and interference effects of wing mounted engines will influence the flow at the tail surfaces and thus the stability. This is illustrated on figure 3 7; which shows the destabilizing moment curve of wing mounted nacelles when operating at angles above 20 .

With wing mounted nacelles arranged to produce high levels of lift augmentation, the size and location of the horizontal tail becomes critical as is discussed in (8,a). The high lift augmentation ©f the wing by the engine will result in high downwash angles at the normal horizontal tail location, which reduces the longitudinal stability. By moving the horizontal forward to a region outside the wake, the stability problem can be overcome.

An investigation was made of the effects of the engine located at the wing tip (16,f). In this case the engine is used to counter the tip vortex of the wing and thus improve the drag in a manner similar to tip tanks. The interference drag of other engine locations are covered for the larger fan jet engines, such as (16,g.).

SLIPSTREAM EFFECTS ON TAIL SURFACES

(24) Section lift as influenced by rotation

a) Hemmelskamp, Tests of sections on a propeller, Gottingen, Rep. No. 2, 1950.

b) Baskin et al, Theory of the lifting airscrew, NASA TT F-823

c) Schlichting, Boundary layer theory, McGraw Hill 1979

d) Stepniewski, Rotary Wing Aerodynamics, NASA CR 3082

SLIPSTREAM EFFECTS OF DUCTED PROPELLER AND FAN ENGINE ON WINGS

The reduced temperature of the efflux produced by duct­ed propellers and turbo fan engines has made it possible to direct their flow over the wing to increase lift. The lift increase produced by the wing due to slipstream effects is a function of the conditions in the slipstream,, which depends on the thrust loading of the engine. The data for combinations of fan engines is generally presented in terms of conditions in the slipstream which are different from those used for propellers and are given as follows:

Turbine Engine Definitions. The conditions in the slip­stream of a turbo fan engine are described by the gross thrust which is

Gross Thrust = F^ = mj Vj (21)

where m/ is the mass flow at the engine nozzle exit and V/ is the jet exit velocity. Gross thrust is equal to the net thrust F when the engine is at zero velocity. Thus,, at V = 0

F9 = Fn (22)

Net thrust is the actual thrust of the engine and is equal to the change in momentum of the fluid passing through the engine. It is thus equal to the gross thrust minus the drag caused by accelerating the air being swallowed by the engine to the forward velocity of the engine. Thus, if the efflux of the engine were deflected, say 90°, to produce only lift, the mass of air handled times the free stream velocity would be drag. The net thrust Fn is the flight direction and is then

Fn = F^ cos £ – mc V0 (23)

where Є is the turning angle of the flow and mc is the mass flow handled by the compressor.

In some NASA reports F^ is used to define the axial force, the force along the x axis of the body, figure 1. This is taken to be the total force on the system, including the net force F-y, and the drag force D.

Since the gross describes conditions in the slipstream of the engine the other characteristics of the engine wing combination may be defined in terms of the coefficient C

Cm.= F<j /q S = T/qS (24)

where T = the static thrust of the engine and S the wing area, sometimes used as the semi span area. The dynamic pressure q is based in the free stream.

In comparing the effectiveness of the turning of various systems, the static-thrust recovery efficiency is used. This efficiency is defined by

V = + FM2 /Т (25)

Ducted Propeller Wing Lift. A ducted propeller mounted in front of a wing arranged so that its efflux washes the upper and lower surfaces will also increase lift. Like an open propeller, the lift is increased due to the higher slipstream velocity and the increment is a function of the turning angle of the flow. Based on (6,b), ducted pro­pellers can be expected to provide high lift augmentation as the increase improves with increasing jet aspect ratio and a corresponding decrease in the slipstream net thick­ness, figure 16. Thus it is desirable to use several small diameter jets, such as ducted fans, in front of a wing to produce the greatest lift augmentation for a given total thrust.

To obtain the required thrust at small diameters ducted propellers are needed for good propulsive efficiency. With ducted propellers the total wing can be immersed in the jet wake and flaps can be used to further augment the turning of the flow (7,a). As shown on figure 17, the basic wing lift is increased by the turning of the jet and an increase of circulation lift. A measure of the effectiveness of turning with the flaps set at 90° is given on figure 18. From this plot it appears that the best split of the wake occurs for Va above the wing. Here the greatest turning is obtained, along with the highest lift to thrust ratio.

SLIPSTREAM EFFECTS OF DUCTED PROPELLER AND FAN ENGINE ON WINGS

Figure 16. Turning effectiveness of rectangular wings in static jets, ^ = 0.

Wing Lift with Turbo Jet Engines. Like propellers and ducted fans, turbo jet engines can augment the lift of a wing to make possible reduced takeoff and landings with effective lift coefficients much higher than is possible with flaps. Since the size of the turbo jet engine is much smaller than the ducted fan and propeller, there are many more configurations that can be used to increase the wing lift. Possible configurations that have been considered are illustrated on figure 19 and include basically uriderslung engines with various flaps and engines mounted over the wing. Also included is the possible configuration where the engine is mounted directly in front of the wing.

The configuration chosen will depend on the performance improvement possible, safety considerations, weight and the noise produced. With the underslung configuration the flap deflection will increase the noise level, figure 20. Since noise is an important consideration, especially with STOL aircraft, the choise of configuration will probably hinge on the level of noise produced.

6* 90

Подпись:Подпись:Подпись:Подпись:Подпись:Подпись:SLIPSTREAM EFFECTS OF DUCTED PROPELLER AND FAN ENGINE ON WINGSa

a

CONTINUOUS

PITCHING MOMENT ABOUT 0.25 c ft/lb

Figure 18. Turning effectiveness of flaps on wing with a ducted fan.

(7) Ducted Fan Wing Interaction:

a) Newsome, W., Deflected-Slipstream Cruise-Fan Wing, NASA TN D-4262.

b) McKinney, Fan-Powered V/STOL Aircraft, NASA SP-116. [108]

Propulsion Lift Engines Over Wing. The need for noise reduction of STOL aircraft plus the indication that a wing could be very effective in turning the efflux of engines led to consideration of exhausting the flow over the wing upper surface. This system with low jet velocities can lead to a low noise configuration (9,c). A possible arrangement of such a system, figure 20,b, indicates that high turning efficiencies can be obtained along with large improve­ments of the total lift (9,a, b).

Подпись:Подпись:Подпись:The turning efficiency for flap settings of 20 to 60° nozzles of various aspect ratios are given on figure 23. Based on tests at the static condition the higher levels of turning efficiency appear to be for those cases where the flow spreads out on the wing forming a high energy jet that follows the wing contour. For instance, (9,b) when flap guide vanes were used on the aspect ratio 2 nozzle turning equivalent to a nozzle of aspect ratio 4 were obtained. Typical untrimmed lift drag and moment char­acteristics are given on figure 23 for the aspect ratio 4 nozzle and the flaps set at 60°. As with the underslung engines, the full potential of lift augmentation cannot be realized due to trim and engine out considerations. How­ever, with further development this method of improving lift is expected to be highly competitive.

SLIPSTREAM EFFECTS OF DUCTED PROPELLER AND FAN ENGINE ON WINGS

Lift with Underslung Engines. By deflecting flaps directly in the efflux of a turbo fan engine very high operating lift coefficients (8,a) and Chapter 5 are obtained. As shown on figure 21, a maximum lift coefficient as high as 8 is possible with a C^of 3.5 and the use of a wing equipped with double slotted trad edge flaps and a leading edge flap. Associated with the high lift coefficient is a large diving moment so that the trimmed lift is lower, however. Because of the large lift coefficient the downwash at the tail becomes very large, requiring careful placement of the horizontal tail.

Typical operation of a wing with externally blown flaps is given in figure 22 from (8,e). In this case the wing is operated at lift coefficients considerably below the maxi­mum to allow for an engine failure. This is a major problem in the design of augmented lift systems, as lateral moment also becomes very large due to the lift loss in area of the failed engine (8,d).

Although large values of CL are possible with underslung nacelle wing combinations, the practical aspects of safety, noise and trim reduces the lift advantages so that other configurations become more desirable.

SLIPSTREAM EFFECTS OF DUCTED PROPELLER AND FAN ENGINE ON WINGS

Figure 20. Effect of Пар deflection on noise level for external blown underslung flaps.

(9) Upper Surface Blown Jet-Flap:

a) Phelps, A., Wind-Tunnel Investigation, NASA TN D-7399.

b) Smith, C. C., Large-Scale Semispan Unswept Wind-Tunnel Test, NASA TND-7526.

c) Reshotko, Engine Over the Wing Nose, J of Aircraft April 1974.

(10) Effects of Jet Flow on Wings:

a) Putnam, Jet Flow on Wings, M = .4 to.95, TN D-7367.