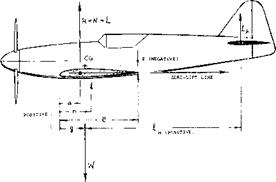
Using the various components of longitudinal moment together with the downwash mechanism, it is now possible to evaluate or to predict the static stability of plain wing-fuselage-tail configurations.
Moment Due to Tail Figure 15 presents characteristics of a simple airplane configuration. The stabilizing moment derivative (dC^dCY ) of the horizontal tail is found from the difference of the tests with tail on and tail off. The tail’s moment is theoretically
dCmJdCL= – (dCL /doc) H (SH/S)(^/c)(l +df/d(r)(do:/dCL)
(27)
In the example as in the illustration, the known terms in this equation are dCL/doc = 0.07, Su/S = 0.15,4 M/c = 3.4, so that VM = 0.5. By comparison of the stabilizing moments, with and without the wing, we find (1 + (dt/doC)) = 0.45, so that dt/doc = — 0.55. The rest is as tested.
|

AVION W 5
WING: A = b/c = 6 RECTANGULAR AND STRAIGHT, dCj/daC = 0.078; 4(10)
HORIZONTAL TAIL: SH/S – 0.14; ^/c =2.3; VH = 0.32; WITH CUT-OUT
AERODYNAMIC 3ENTER AT x/c = 0.34, and z/c = 0.25, AS AGAINST WING LE
CENTER OF GRAVITY ASSUMED AT x/c = 0.25, AND z/c = -0.40
REFERENCE (17,e) TESTED AT Rc = 4(10)5
|
IN THE GRAPH INDICATING:
A – AC^ = -0.09 CL DUE TO CG 9% AHEAD OF AC В – £Cm = -0.09 CL2 ШЕ TO CG 0.4 c BELOW AC C – <3Cm~ CL2 DUE TO VARIATION OF DOWNWASH df/dc<

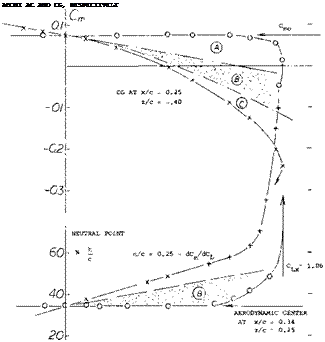
Neutral Point. When moving the CG of an airplane aft stability reduces to zero when reaching the neutral point (neutral stability). For a given configuration, with a pitching moment as in equation (27), this point is indicated by
(a/c)-(n/c) = dQn« /dCL (28)
To be stable, n must be longer than a (see figure 1). Since іц changes little when changing g and n, if the variation of the combined CL due to a change in CLW is small, the absolute value of the combined d/Cm/dCL (about the leading edge) is equal to n/c. The location “n” of the neutral point is thus aft of the leading edge. Usually, the fuselage contributes a positive Д (dCry/dCY), resulting in a forward shift of the AC while the horizontal tail provides the stabilizing dCniH/dCL, usually between — 0.1 and — 0.2, thus extending the neutral point, say to 30 or possibly 35% of the chord. All these variations are indicated by
Дх/с = – A(dC*/dCL) (29)
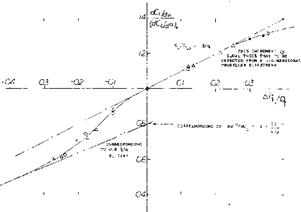
High Wing. Figure 24 gives an example for the neutral point of a “parasol” configuration. Between CL = 0 and 0.9, the neutral point moves from x/c = 0.34 to above 0.6. This variation is primarily caused by the stabilizing action of the wing’s lift at its AC in reference to the CG. In a manner similar to that in airfoil sections and/or in wings, an aerodynamic center can also be determined for an airplane configuration; the neutral point. This can approximately by considering [105]
-2 C 02 04 Об 08 Ю CL
Figure 24. Longitudinal characteristics of a “parasol” type airplane configuration. Aerodynamic center and neutral points, all including the horizontal tail, set at – 4.5 against wing zero lift line.
In the graph indicating:
A – С*, = ~ 0.09 CL due to CG 9%c ahead of AC В – Cm = – 0.09 CL2 due to CG 0.4 c below AC C – due to variation of downwash d/daf
where z = positive in a high-wing arrangement. Note that the influence of vertical displacement corresponds to that of a mechanical pendulum, the CG is suspended below the wing’s center of lift. It should also be noted that d(ACrr)/dCL = constant for a certain displacement “z” of the wing against the CG or vice versa. In the case of figure 24, it was found by trial and error, that the Cm(CL) function can be made into a line practically straight between Cl = 0.2 and + 0.8, when raising the reference point to the level of z = 0.24 c, above the wing’s гею lift line. The neutral point NP (aerodynamic center of the configuration, including the horizontal tail) is thus found to be at
x = 0.34 c; and z = 0.24 c
measured from wing leading edge and above its zero lift line (which corresponds to oc0 = — 0.7 ). The explanation for the comparatively high location of the NP (in figure 24) may be found:
(a) in lift (and drag) originating and/or increasing in the rear end of the low aspect ratio “square” fuselage, as the angle of attack is increased;
(b) possibly of some progressive viscous interference of the fuselage with the wing’s downwash;
(c) in the low position of the horizontal tail in relation to the wing and its downwash sheet (see later under “low horizontal tail”).
It is thus seen that the downwash and its variation, as the tail moves up or down as a function of CL, contribute to the position of the “aerodynamic^center.” In view of the reduction of stability due to propeller and slipstream action (discussed later) an increase of dCrrJdCL as indicated in equation 30 may be desirable to a degree. On the other hand, strong stability at high lift coefficients, makes control of the airplane during a landing maneuver difficult, particularly when the airplane is designed for tail – down and tail-first type of contact with the ground
Wing Wake. As shown in (15,d) the turbulent viscous wake emanating from the trailing edge of an average plain wing section, has the following characteristics at a conventional location of the horizontal tail:
x = 2 c, measured from trailing edge of wing
0/c = 0.5 Cds~0.005 = momentum thickness ratio
6л ~ 1.10 = displacement thickness of wake Vmin ~ 0-94 V = minimum speed, in center of wake S ^ 0.1 f c = total thickness of wake [106]
|
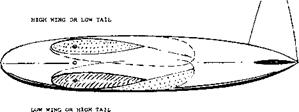
WING: 0018/09, 0.5 TAPERED A = 6, Rf = 8(10)6 VET
deader.= 0.080 (W’OUT TAIL), = 0.086 (WITH TAIL) FUSELAGE: ROUND, 1/d = 5.9; 1/b = 2/3
HORIZONTAL TAIL SURFACE: S^S = 0.18; lH/c = 2.6
0009 ELLIPTICAL, AH = 4.5
HORIZONTAL TAIL CONTRIBUTIONS:
|
|
|
(WdX
|
dc/dd
|
|
d</dcL2
|
|
|
HW
|
-3.16
|
+0.16
|
-0.47
|
0.53
|
-0.8°
|
+ 1°
|
|
MW
|
-3.15
|
+0.15
|
-0.50
|
0.50
|
-0.6°
|
0
|
|
LW
|
-9.14
|
+0.14
|
-0.53
|
0.47
|
ZERO
|
-1°
|
|
A INDICATES FUSELAGE VISCOUS LIFT EFFECT В REPRESENT A PLUS DOWNWASH VARIATION
|
|
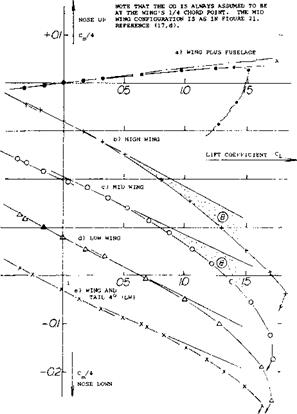
Figure 25. Influence of vertical location of the horizontal tail surface as against wing and vortex sheet. Note that the CG is always assumed to be at the wing’s 1/4 chord point. The Mid Wing configuration is as in figure 21. Reference (17,d).
|
Depending upon the geometrical arrangement, the wake sheet may meet the horizontal tail surface, at a certain angle of attack or lift coefficient. A theoretical and experimental study (15,a) indicates that in this event, the lift of the tail surface basically corresponds to the reduced dynamic pressure within the wake. However, within a field of flow with a velocity gradient in the direction normal to its span, an airfoil becomes attracted toward
the side of increasing velocity. The result can be a certain irregularity in the forces or moments supplied by the horizontal tail surface. Pitching moment coefficients of a simple airplane configuration are plotted in figure 25:
(a) for wing plus fuselage, mid-wing configuration,
(b) with wing and CG in high position
(c) for a symmetrical mid-wing combination,
(d) for a wing and CG in lowered position,
(e) for a wing and tail setting of + 4° against the fuselage.
By reasons of symmetry, configuration (b) must have an inflection around C L and/or oc = zero. There are evidently “dents” in the C^CjJ functions of (d) and (e), at CL ~ 0.3 and 0.4, respectively. At these critical lift coefficients, the slope dCm/dCL is locally reduced. Of course, in the operation of an airplane, the “mixing” action of the propeller (if any) or variations of wing shape causing a distortion of the vortex sheet (such as dihedral, cut-outs, flaps) may render the dent in the func
tion insignificant.
|
Low Horizontal Tail From the date on the mid-wing configuration in figure 25, it is seen that the Cm(CL) function is curved in such a manner that the value of dCm/dCb increases with lift coefficient. The reason for this is the wing plus fuselage alone function of VSCL, figure 25, and evidently the fact that the tail (when below the vortex sheet) moves into the field of reducing down – wash shown in figure 20. At a conventional tail location x/b ~ 0.6, the variation may be approximated by equation (26). For the mid wing in figure 25, the angular displacement of the horizontal tail away from the vortex sheet is ^ — 0.25 oc, so that Az/b = – 0.25 (doc/dCL) CL ^ – 0.06 CL, at x/b = 0.6. The resultant increment of the angle of attack at the tail corresponds to
A ((fc/doc)* – (A z/b) d£x/doc = -1.5 (0.06) C L0.5
|
![FLUID DYNAMIC LIFT Подпись: - 0.045 q (31) where d£x/doc is assumed to be — 0.5. The change of the angle at the tail is thus proportional to cx0CL ^ <x}] or CL , where the dot indicates that the angle is measured from the zero lift line. For an assumed aerodynamic angle of attack at the tail ocHo = (1 - 0.5) oc = 0.5 oc, the increment of this angle reaches the magnitude of 9% (in the example considered) at CL = 1. Differentiation then yields an increment of the tail contribution to longitudinal stability of 18% at CL = 1, which may mean an extension of the neutral point by дх/с = — A^lC^/dC^) in the order of 4%, in a conventional airplane.](/img/3130/image724_4.gif)
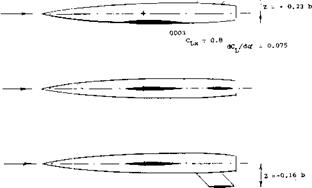
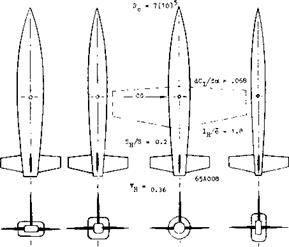
Vertical Position of Tail There is considerable evidence indicating that an improvement of stability does take place, as the horizontal tail moves below the vortex and wake sheet. For example, the midwing configuration in figure 25 shows an increment of the tail-moment contribution at CL = 1, in the order of 8% (not counting the increment due to fuselage). The high wing or low-tail arrangement m the same graph has a tail moment of 12%.
|
b = 11 INCH
|
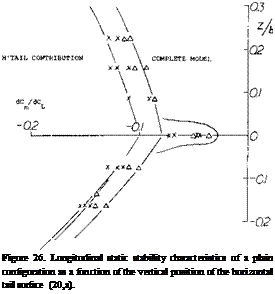
Another advantage of the latter configuration (with the CG at the wing’s quarter point) is the fact that the horizontal tail is always below the vortex sheet where (as in figure 20) the downwash is less than the maximum. As a consequence, the low-tail configuration exhibits a dCm/dCL = 0.18 (at CL = 0.8), while the mid-wing type has only — 0.16. Results of a systematic investigation (20,a) are plotted in figure 26 and indicate:
(a) With the horizontal tail either above or below the vortex sheet, the stabilizing contribution of the tail is increased in comparison to that on fuselage center line.
(b) The improvement is greater below than above the wing chord. The derivative d£/dz is evidently favorable below, and unfavorable above the vortex sheet.
(c) Directly on the fuselage (at its center line) the tail contribution is extremely low. It must be assumed that viscous interference (described in the “horizontal tail” section) is maximum here.
‘T” Tail. An extreme measure to avoid interference with the downwash sheet as well as with any wake, is to place the horizontal tail as high as possible. An example of a very high location of the horizontal tail surface, on top of the vertical surface (thus forming a “T” tail) is shown in figure 27. The tested pitching-moment derivatives (at lift coefficients below ~ 0.5) are as follows:
where do^ц /doC = (15 — 11.5)/15 = 0.23 only. Using the ratios as indicated in the illustration, and the lift angle of the wing doc /dCL = 15 as tested, the value dCmH/dCL~
— 0.085 is obtained. This compares with the test value of
– .08 shown on figure 27. Considering now the horizontal
|
WING: 0.6 TAPERED A = 4, 65A008
H’TAIL: SH/S = 0.2; j^/c = 1.8
h/ H = 0.6 FOR "T" TAIL
|
HORIZONTAL TAIL CONTRIBUTION:
dCmH/dCL Лх/5 ON FUSELAGE CL -0.08 +8%
MT" TAIL POSITION -0.25 +25%
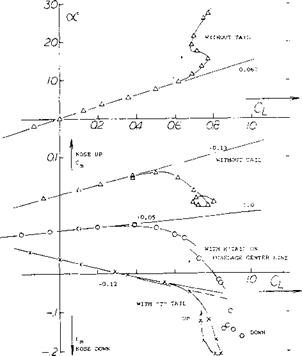
where the members in the last column indicate the stabilizing differentials of the horizontal tail. The + 0.13 is essentially due to the fuselage, hinged at 0.54 of its length (a point not typical in conventional airplanes). With the horizontal tail located on the fuselage center line, the configuration is not stable. Analysis using equations 22 and 23 suggests that the downwash angle is
de/dCL ~ — 9.2 — 2.3 = — 11.5°
which is 2.5 times the induced angle of attack. The influence of the fuselage upon the effective aspect ratio is estimated to result in AL = 0.7 (4) = 2.8. Using the corresponding lift angle of
(doc/dCL)M = 10.5 + 6.5= 17°
the contribution of the horizontal tail then is calculated to be
^mn/dCL – — (doCM /d<X ) (SJS) (4 /с) (da: /dCL )/(doC /dCL )Figure 27. Influence of vertical position of the horizontal tail
(32) surface (20,d) on longitudinal stability. Rc = 8(10)6.
surface raised to the top of the vertical tail, we may expect that the downwash is reduced to 0.6 of that assumed above (see figure 20). Fuselage interference is assumed to be zero; in fact, the upper side of the horizontal surface is completely undisturbed. Since AH = 4 = A as in the wing, we obtain dotCM/dc*r = (15 — 7)/15 = 0.53, which is more than twice the 0.23 ratio for docH/dcxT above. Consequently:

 dCmw/dCL = – 0.53 (0.2) 2.1 = – 0.22


while – 0.25 was obtained from test (see figure 27). The “T” tail configuration thus does two things:
it avoids the downwash maximum near the vortex sheet,
it avoids viscosity-induced fuselage (wake) interference.
“71” Tail at High Angles: While the “T” tail, as in figure 27, is safely placed outside (above) the wing wake, the variation of downwash as in figure 20, should be expected to reduce stability, in the range of higher lift coefficients corresponding to what is explained above under “low horizontal tail”. Indeed, comparison of the C^Cl) functions in figure 27, without tail and with “T” tail, reveals a reduction of the stabilizing tail moment between CL = 0.3 and 0.6, similar in absolute magnitude to the stabilizing amount of I 0.45 I, derived above for a low-tail configuration. Therefore, the advantage of the “T” tail arrangement rests primarily in the elimination of fuselage interference. Disregarding structural considerations, a really high location of the horizontal tail has another disadvantage. At very high angfes of attack, the horizontal surface is bound to get into the wake from the stalled wing. As seen in figure 27, the pitching moment then turns unstable (into the positive direction) thus presenting a situation which is likely to get into the “deep stall condition, Chapter XVI.
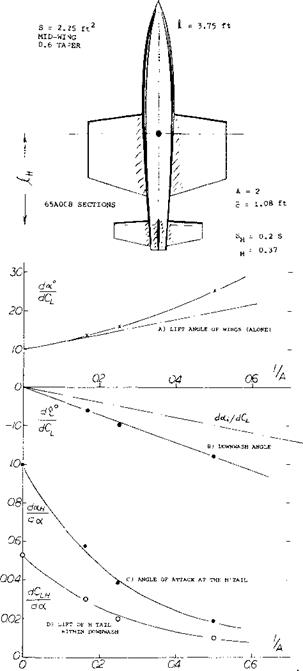
Aspect Ratio. A given tail plus fuselage assembly was tested (17,f) in combination with 3 wings having the same area, but differing in aspect ratio, between 2 and 6. The lift of the horizontal tail is found as the differential between the complete configuration and wing plus fuselage (tested without tail). Including for A = go, or 1/A = 0, the slope (dCL/do^ )й of tail plus fuselage tested alone, figure 28 demonstrates how the lift of the tail is reduced with a reduction of aspect ratio on account of increased downwash. It follows that
doCH/da: = (dCLH/doe)/(dCL/da: ) (33)
and del doc = doc jdoc – 1, so that
de/dCL = (docH/doc)(doc /dCL) – doc /dCL
where doc/dCL = lift angle of the respective wings as tested (plotted at the top of the graph). It is thus seen
that down wash increases and the stabilizing contribution of the tail reduces as the aspect ratio of the wing is reduced. For example, at A = 2, where ijc = 0.37 //1.08 = 1.3 and V =1.3 (0.2) = 0.26, the tail contribution is dCmw/dCL = – (dCLH/doO Vw (d(X/dCL) = – 0.03 (0.26) 25 = — 6.5%, which is only ~ 1/3 of what it is in average conventional airplane configurations.
|
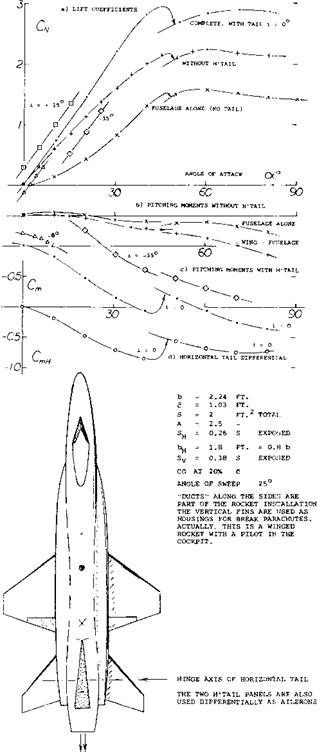
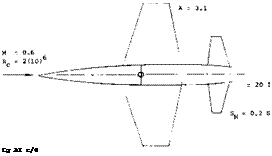
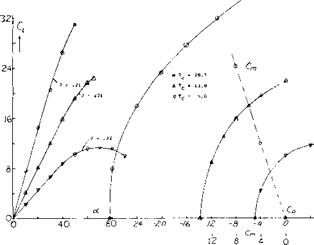
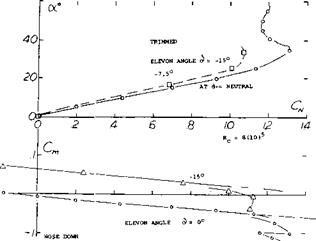
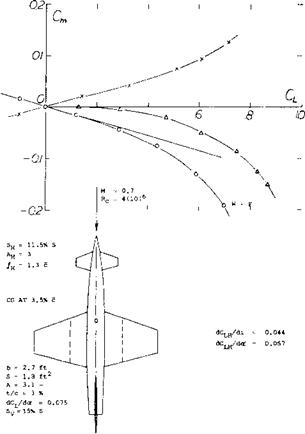
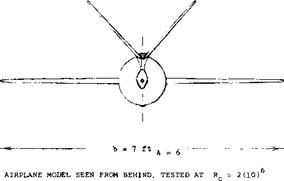
Figure 29. Longitudinal characteristics of a model (22,b) similar to the NASA and North American “X-15”, tunnel-tested at low speeds (Rc = 2(10)fe).
|
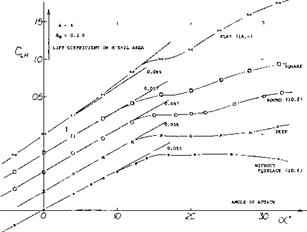
Big Fuselages. Small aspect ratios are used on winged missiles (21), where not only down wash is a problem but also the size of the body in comparison to wing and tail is critical. Another example involving small wings and a large fuselage, is the high-altitude research craft X-15. Characteristics of a model similar to this airplane are presented in figure 29. The maximum width of the body is 0.34 b; its plan-form area is — 1A times total wing area. Analysis of these data show:
(a) The lift curve slope (without horizontal tail) within the range of small angles of attack, dCL/doC = 0.055, corresponds to A = 2.5.
(b) The maximum lift coefficient (without tail) is CL~ 0.7 CM= 1.5, at oL =45°.
(c) When adding the horizontal tail, its contributions to lift and pitching moment are not linear.
(d) There is a critical angle of attack near 50 , where forces and moments exhibit discontinuities.
The non-linearities (c) and the discontinuities seem to be a consequence of the fuselage flow pattern (separation). It must be noted, however, that the wing eliminates most of the fuselage lift, by way of downwash, so that the lift- curve slope as in (a), is fairly constant.
Tail Contributions. The interaction between fuselage and horizontal tail in the configuration as in figure 29, is complex. A qualitative analysis is as follows:
(a) By comparison of dC^/di = — 0.026 with dCL/di = 0.020, a tail length = (0.027/0.020)c = 1.35 c is found.
(b) Based on exposed area of S ц = 0.26 S, the lift-curve slope of the tail is dCLH/di = 0.020/0.26 = 0.077, which seems to be proper for an “exposed” aspect ratio of A = Ъгц /S ц = 6.3.
(16) Simple aiqilane configurations in wind tunnels:
a) Schlichting, Interference, Ybk D Lufo 1943, Rpt IA028; see (10,e).
b) Gruenling, Investigation of Me-109 Model, ZWB UM 7857 (1944).
d) Sherman, 17 Combinations, NACA T Rpt 678 (1939).
e) Service Technique Aeronautique (Belgium), Bull 15, Feb 1935.
(17) f) Stivers, NACA TN 4238 (1958) and NASA D-13
(1959) .
g) Fournier, Three-Body Configuration, NASA TN D-217
(1960) .
(18) Influence of vertical CG location:
a) Andrews, Flight (Aircraft Eng) 1937 No. 1474 & 1479.
b) Francis, Notes on Stability, ARC RM 1833 (1938).
c) Bryant, “Puss Moth” High Wing, ARC RM 1687 (1935).
(19) Further variants of the configurations as in figures 25,26,27, references (17,f)(18,d)(20,d), are reported in NACA RM A52D23/E01/L15a, in TN 3551,3857, and in NASA D-13; between 1952 and 1959.
(c) At <X = 20° , the tail moment differential is A С mul A <X = — 0.022, in presence of the wing. This is less than the dCm/di = — 0.026 above.
(d) Again at oc = 20°, the lift differential due to tail is ACl/A<X – 0.016. Combining this value with the derivative in (c), a tail moment arm Лц = (0.022/0.016)c = 1.38 c is obtained.
The difference between the derivatives as agains: j and <x, is due to downwash as well as to a more or less unknown contribution of the fuselage. On the basis ofS*» (total) =
2.1 S ц (exposed) = 0.55 S, a (AC L/Да: ) и ~ 0.016/0.55 = 0.029 is obtained. Comparison with 0.077 as in (b) leads to doc н I doc = 0.029/0.077 = 0.38 and df/doc = – 0.62. These values seem to be reasonable. More accurate predictions cannot be made, however, for a configuration:
where the fuselage is long and wide,
where the tail length is no longer than ^ wing chord.
To show the problematic character of the analysis, the downwash as derived above, is only 1.4 times the induced angle, which seems low.
X-15. The model in figure 29, is evidently one representing the NASA-North American research airplane “X-15”. Flight-test reports (22,c) reveal that the airplane is flown approximately:
Long Fuselage. The configuration in figure 30 serves first as another illustration for a long fuselage (forward). Assuming that the body in the middle may have a weight equal to 1/4 of the total, its addition moves forward the combined CG more than 20% of the “mac”; thus A (dCrr/dC _ ) ~ — 0.20, on account of fuselage weight. Its aerodynamic contribution is, on the other hand, Д (dCm/dCu ) = + 0.07. A long fuselage forward thus more than cancels its destabilizing effect; and we have an explanation, how long-nosed configurations such as that in figure 29, for example, can be stable in longitudinal direction.
Zero-Lift Moment. Theoretically the fuselage does not develop lift. Its free moment (+ 0.07) has to be compensated, however, by a positive lift force in the horizontal tail. At higher lift coefficients, say at C L = 1.0, therefore, АСтн ~ — 0.07, which means in the configuration considered a AClh = + 0.07/0.66 ~ 0.1 and a total CLH ~ 0.2. This would not be a problem; in fact, in an airplane using wing flaps, the fuselage moment would tend to overcome the negative (nose-down) moment produced by those flaps. On the other hand for a range of small lift coefficients (at high speeds) near Cb = 0, the differential depends entirely upon the angle “i” at which the wing is set against the fuselage. In a convention design, і (measured at the wing’s zero-lift line) is in the order of
at c< = 10° and with і = – 12° launching
at а: = 5° and with і = – 9° climbing
at oc = 15 ° and with і = – 20° recovering
s
This means that operation is at C L between 0.2 and 0.8. This range is small in comparison to that in figure 29. Other data and expected performance (22) of this airplane are:
|
b =
|
22 ft
|
T* =
|
60,000 lb
|
W – 31,000
|
lb with fuel
|
|
M =
|
^ 6 ~
|
|
3,500 kts
|
W = 13,000
|
lb burnt-out
|
|
l =
|
50 ft
|
s =
|
200 ft2
|
max altitude
|
~250,000 ft
|
(20) Influence of vertical location of the H4a. il:
a) Stivers, Vertical Location of Tail, NACA RM A57I10.
b) Multhopp, “T” Tails, Aero Digest, May 1955 .
c) Interaction with V’tail, see NACA TN 1050 & 2907.
d) Letko, in connection with (17,c), NACA TN 3481 (1955).
(21) Nielsen, Wing Body Tail Combinations, NACA T Rpt 1307 (1957).
(22) Aerodynamic characteristics of the X-15 research airplane:
a) Clark, Space Flight, Aero Space Engg, April 1959 p 43.
b) Bowman, Tunnel-Tested Characteristics, NASA TN D-403 (1960).
c) Flight Test Analyses, NASA TN D-615,623,723,1057,1059,1060,1159 (1960/62).
d) Weil, Review of Operation, NASA TN D-1278 (1962).
f) For data, see Jane’s All the World’s Aircraft 1961/62 p 292.
Figure 30. Three-body airplane configuration tested (17,g) at M = 0.2 and Rc := 2(10)4*. See text for principle results.
several degrees, so that the fuselage may be in horizontal position when cruising. Thus і = 0.3/0.06 = 5 , for example, for an assumed dCL/d<Y = 0.06. To balance the fuselage moment at CL =0, for instance high speed dive, a negative (down) load in the horizontal tail is required. In the example considered, that load would be in the order of 50% of the airplane’s weight (estimated on the basis of conventional values for tail volume et cetera), assuming a terminal speed two times the cruising speed and disregarding any changes due to compressibility.
Taper Ratio. It is explained in the “downwash” section, that rectangular wings have less, and tapered plan forms more downwash in their center plane. Using a final (rolled-up) ratio t/ocL = 2.6 and an increment of at least 0.1 (as derived from equation 23),
d£/doc = – (tlocL )(d(*L /doc) = – 2.7 (5/17) = 0.8
or even higher, can be estimated for the doubly-triangular wing shape in figure 30. Analysis of the wide and large tail surface (S ц/S = 0.4) stretched out between the two nacelles (with A H = 4, plus end-plate effect supplied by the vertical fins) leads to an average effective ratio o^h /ос somewhat below 0.2. The configuration shown, or any similar, highly tapered wing, is thus rather inefficient in regard to longitudinal stability.
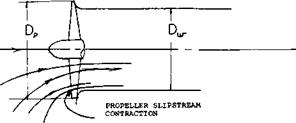
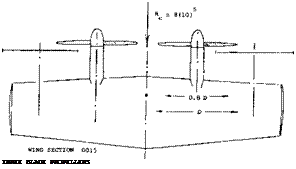
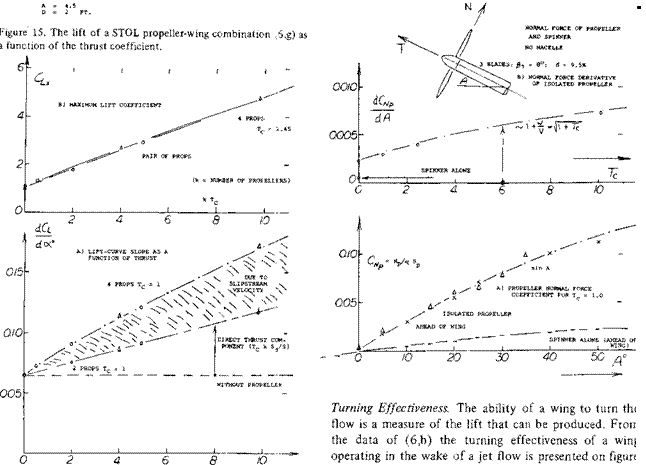
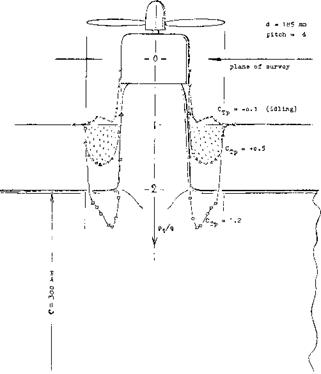
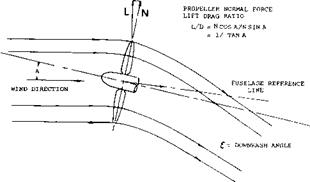
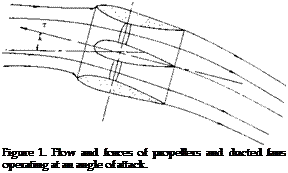
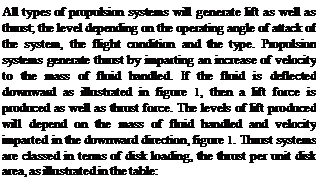
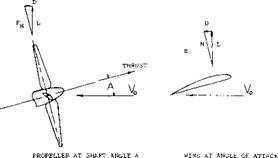
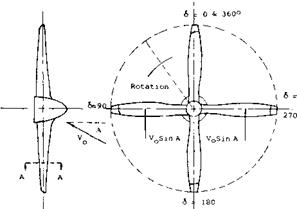
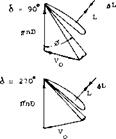
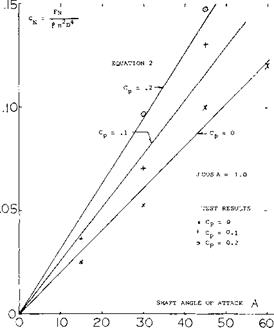
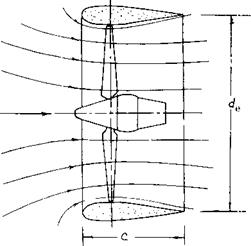
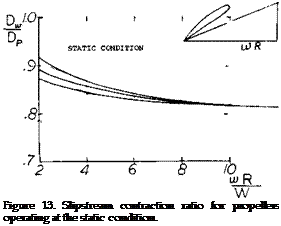 The actual velocity imparted to the slipstream by the propeller consists of axial, radial and tangentional components of velocity, which are periodic in nature. Immediately downstream of each blade the velocity increment is a maximum. In between the blades the velocity increment is a minimum, but is still more than 50% of the peak. Except at zero and low speeds the radial velocity is small and can be neglected. The tangentional component of velocity in the slipstream is in the same direction as the


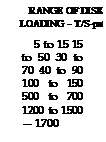


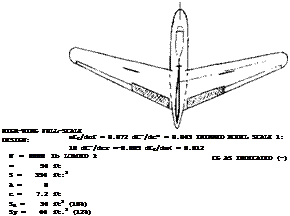
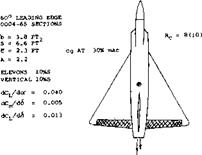
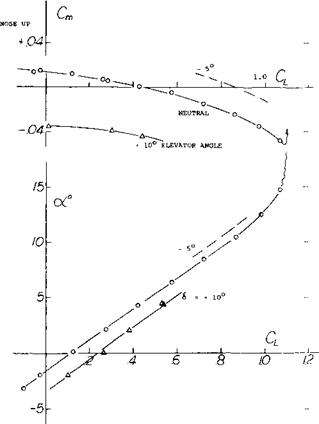
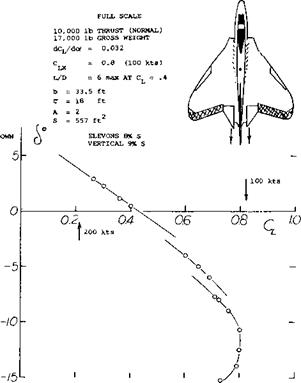
 Interceptor. The research efforts reported in (28,c) and (29,b) eventually led to the first rocket-powered and “tailless”, operational airplane (31). Here as in many other configurations designed without a special horizontal control surface, one can argue whether a vertical surface is a tail or not. Apart from delta designs, one of the very few operational tailless airplanes is or was the U. S. Navy’s F7U-1 “Cutlass” fighter (33). To provide directional stability, this airplane carries a pair of fins (above the wing), each approximately at Уі span. Principles of tailless airplanes and some results of model tests are presented in
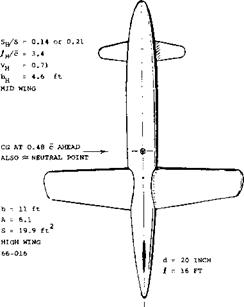
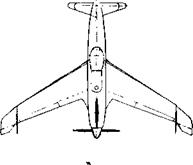
 THE LARGE FIN, FOUND NOT TO BE SUFFICIENT, WAS AUGMENTED BY A PAIR OF AUXILIARY FINS MOUNTED BELOW THE WING, NEAR THE TIPS.
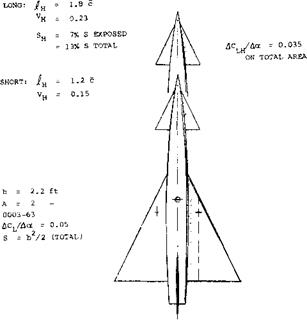
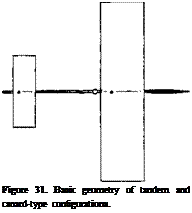
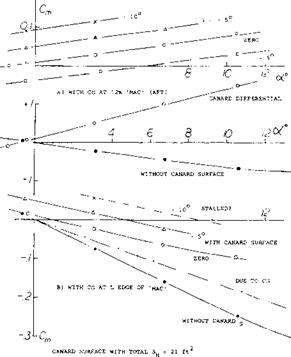
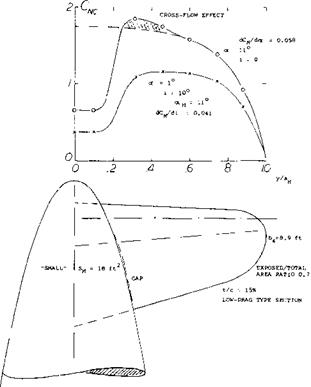
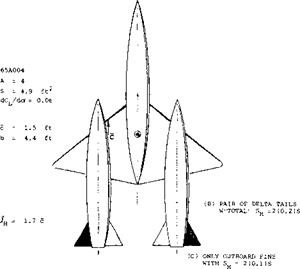
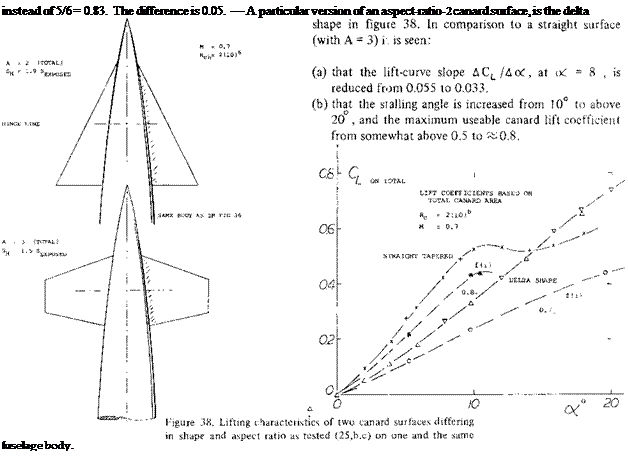 Interference. The canard surface leaves behind a certain downwash — and a pair of tip vortices. The possible interference of this system with the wing is mentioned in several reports (25). In the case where the canard surface is large the downwash is highly destabilizing. However if the distance is large and the front surface small the consequences of such interference are of minor importance. Theory predicts that the two lifting surfaces have the same induced characteristics as a wing to whose load distribution the lift of the canard surface is added. In reality, the wing load is expected to be reduced in the center, and to be increased outside the canard span. Again, this may not be important in a small straight wing. However, in the example of a delta wing as in figure 37, a relocation of lift from the center outboard, can be expected to make the wing’s pitching moment more negative (nose-down and stabilizing). There is some indication of possible interference in (b) above, where the canard moment grows to “1.8”, while the moment arm ratio is only 1.5. It can be speculated that the short-fuselage design exhibits a differential due to interference in the order of &(dCm/dCL) = – 0.02. This differential can readily be explained, as above. The fact that the long configuration does not experience a similar differential, may be associated with the much longer distance that the downwash field has to proceed, before it reaches the wing. It. is also likely that the canard downwash reduces the positive moment of the fuselage. Finally, de/doc at the location of the wing, must be expected to reduce, as the angle of attack is increased.


![FLUID DYNAMIC LIFT Подпись: - 0.045 q (31) where d£x/doc is assumed to be — 0.5. The change of the angle at the tail is thus proportional to cx0CL ^ <x}] or CL , where the dot indicates that the angle is measured from the zero lift line. For an assumed aerodynamic angle of attack at the tail ocHo = (1 - 0.5) oc = 0.5 oc, the increment of this angle reaches the magnitude of 9% (in the example considered) at CL = 1. Differentiation then yields an increment of the tail contribution to longitudinal stability of 18% at CL = 1, which may mean an extension of the neutral point by дх/с = — A^lC^/dC^) in the order of 4%, in a conventional airplane.](/img/3130/image724_4.gif)



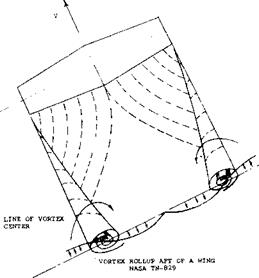
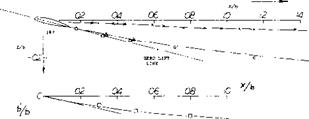




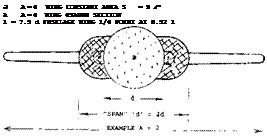
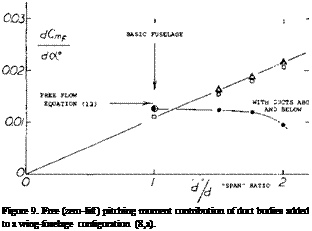 The horizontal tail surface is a lifting device, similar to the wing and is appreciably affected by the fuselage to which it is usually attached.
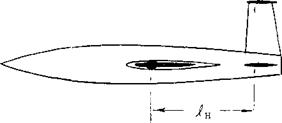
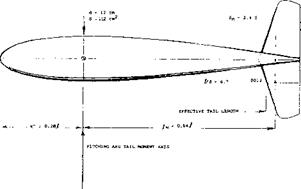
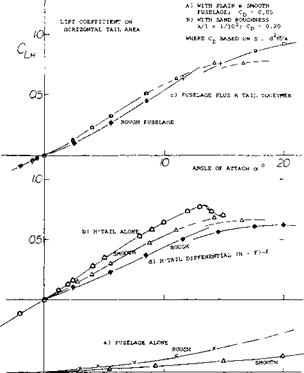
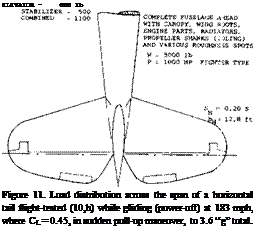 ential due to horizontal tail, this coefficient should theoretically be equal to CLH. However the moments as tested (10,f) were some 5% less, which means that the effective tail arm is 5% shorter than the geometrical arm. This reduction, indicated in figure 12, is discussed later, under “effective tail length”.
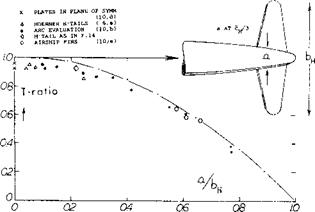

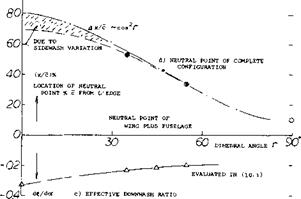
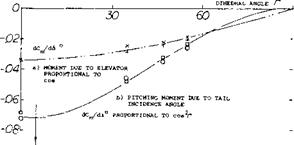


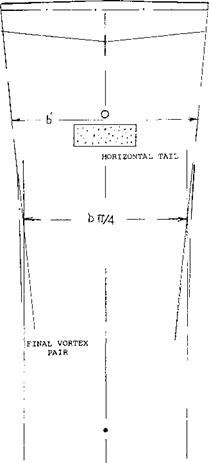 Дх/с: dCAnH/dCL/ —cos2r (20)