Our heavyweight helicopter equal in the world does not have
In Rostov started production of the most load-lifting rotary-wing car The Russian holding «Helicopt[...]

Everything about aircrafts and helicopters. News and events in aviation worldwide. Civil, transportation, military helicopters and airplanes.

Everything about aircrafts and helicopters. News and events in aviation worldwide. Civil, transportation, military helicopters and airplanes.

Everything about aircrafts and helicopters. News and events in aviation worldwide. Civil, transportation, military helicopters and airplanes.

Everything about aircrafts and helicopters. News and events in aviation worldwide. Civil, transportation, military helicopters and airplanes.


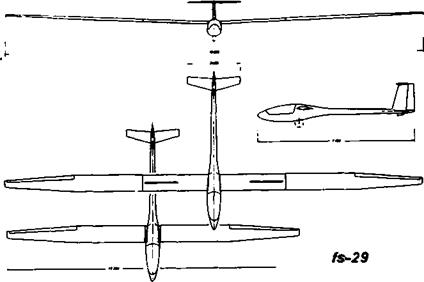
At high speeds, the R. C. glider, like the racing power model, must fly at low Cl – The wing profile, for both good penetration and soaring, is expected toproduce low drag at both high and low speeds. It should be specially designed to do this, as described in Chapter 9. In addition, the wing profile may be varied in flight by means of flaps or camber changing devices. In full-sized sailplanes both techniques are employed. The importance of wing loading is also brought out by mathematical analysis. The glider with light wing loading sinks slowly at low speed, at high speed a high wing loading improves penetration. The two conditions are incompatible unless wings of variable area can be used. Such complex devices have been employed on models and full-sized gliders. Large flaps, or even flexible, sail-like surfaces, may be extended on outriggers behind the wing (see Fig. 4.6). Apart from mechanical complications which tend to increase the weight and so to some extent defeat the purpose, the vortex-induced drag at low speeds of a broad chord is high. In terms of sinking speed, results tend to be disappointing, but when the flaps are retracted the penetration is improved greatly. Another solution, but involving much greater mechanical difficulties, is the variable span sailplane with wing extensions, either telescoping or folding. Perhaps inspired by the full-sized experimental FS-29 (Figure 4.7), Rolf Decker developed and flew a telescopic winged model sailplane in 1985. This may well prove to be successful in contests. Reliability of operation is very difficult to achieve. Models with interchangeable wings of various areas are fairly common, but while they enable adjustment to be made to conditions before each flight, there is no means of

making changes during a flight, which is the real aim. For soaring, light wing loading and low span loading are required, for penetration wing loading should be high and span loading is less significant in terms of glide ratio at speed. Such models are not permitted in the main championship classes, unless the change of geometry can be controlled remotely by radio. It is allowed to add or remove solid ballast between flights, but not to change wings. Folding wings are another possibility.
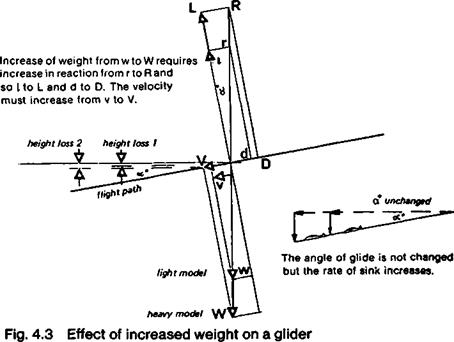
The addition of extra weight to a glider, assuming no other changes are made, will not affect the angle of glide or glide ratio, as Figure 4.3 shows. However, to support the additional load, the extra reaction force must be found, as indicated at R. This compels the model to fly faster down the glide path.* Ballasting a model glider does not affect the
|
|
glide ratio but does increase the sinking speed at any particular trim. Full-sized gliders frequently carry water ballast, sometimes totalling more than the pilot’s weight, to obtain good penetration, that is, good glide ratios at high speeds (Fig. 4.4). If thermals become weak, the ballast is jettisoned to reduce wing loading, W/S, and span loading, W/b, both of which reduce minimum sinking speed. There is no reason why model gliders should not adopt this technique. The advantage of jettisonable ballast for a R. C. glider is that the water may be dumped prior to landing, with much less danger to structure than the usual lead weight box. The ballast in full sized gliders is usually carried in plastic bags inside the * leading edges of the wings ahead of the main spar, so their effect on trim is slight The
•The increase in V will increase Re slightly and so change the character of the boundary layer. In practice any change in glide ratio resulting from this is small.
 |
:: Fig. 4.4 Effect of weight on penetration of sailplane
inertia in steep turns or in up-gusts actually relieves the spars of some up load. In landing the reverse occurs, so the water must go before touch down.
 |
|
Adding ballast does nothing to improve the basic aerodynamic design. If the design is bad, increasing W/S will improve penetration slightly at some cost in sinking speed for soaring. By the same token, reducing wing loading will help the sinking speed but at a high cost in speed performance. A well-designed sailplane with low drag will sink slower and penetrate better than a clumsy design. If it is light to start with there is still the option of adding or subtracting ballast as required by conditions (Fig. 4.5).
0
Plan and elevation drawings of Sigma w
Fig. 4.6 A sailplane with variable area and camber wings
44
|
Fig. 4.7
|
The FS-29, an experimental 13 to 19 metre sailplane with telescopic wings, enabling wing area and aspect ratio to be varied in flight: large span, high a. r., low span loading and low w/s for soaring, small span, low a. r. and high w/s for penetration. Compare with Figure 4.6 on p.44.
Gliders hardly ever need to fly at the speed which yields the best L/D ratio or flattest glide •in still air. As a rule, they are either soaring or penetrating. When penetrating, a speed • faster than that for L/D max is needed. For example, in making headway against a wind, if the model’s best L/D airspeed is 10 metres/sec., and it faces a wind of slightly more than that speed, flight at best L/D will cause it to move backwards relative to the ground. A higher speed would enable some forward progress to be achieved, albeit at a high rate of. descent In addition, between upcurrent zones, thermal or hill lift, there is almost always sinking air. A detailed analysis of the behaviour of sailplanes in such conditions is to be found in most books about foil-sized gliding, but the modeller does not have the benefit of ^Instruments and computers in the cockpit to tell him what his best speed to fly should be.
5 As a very rough approximation, the model might achieve best results on many occasions
by flying between lift areas at about twice its stalling speed, and faster still if it needs to make ground against the wind (Fig. 4.2). This requires efficient, low drag aerodynamic design over a wide range of lift coefficients, from, perhaps, Cl 1 0 down to Cl 0.2 or 0.3. While the best L/D ratio remains a useful indication of a model’s all-round efficiency, it is rarely important in practice.
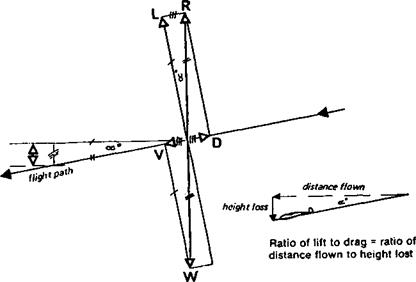
In Figure 4.1 the forces (resolved again as in Figure 1.4) on a gliding model are shown. From the geometry of this diagram it is found that the angle of glide, a, is the same as the angle between the total air reaction force, R, and the resolved lift component, L. From this it follows that the ratio of height lost to distance covered in the glide is exactly the same as the ratio of lift to drag. (The various equalities of triangles are marked in the diagram.) For this reason the glide ratio is often quoted as the Lift to Drag or L/D ratio.
Flight at minimum sinking speed is slow at a high Cl. The minimum rate of descent occurs when the ratio of Cl1’3 to Cd is highest (The derivation of this is given in Appendix 1.) This ratio is often termed the power factor for a model, since it also indicates the trim condition for level flight with minimum motor power. The ratio is written in a number of ways which are all equivalent
afThe last gives a value which is equal to the power factor squared.) The power factor Should not be confused with the maximum L/D ratio. The flattest glide, covering greatest distance over the ground in still air, is not the best trim for minimum sinking speed, which requires slower flight at higher Cl – Depending on the wing profile, the minimum sinking speed may occur at angles of attack fairly close to the stall, or, in many cases, at a flight speed about 75% of that for the best L/D. This is the trim to be sought when a glider is soaring.
To increase the maximum speed of a racer in level flight, it is easily found from Figure 1.4 ;foat either an increase in thrust or a decrease in drag will cause acceleration. Thrust is a «batter of engine tuning and correct choice of propeller. To cut drag, the model must be *18eaned up’, i. e., the total coefficient of drag, Cd. must be reduced. After the leration, when equilibrium is restored, drag force will be once again equal to thrust, since this has been achieved by reducing Cd. the drag equation balances at a higher, as required. The lift force also depends on speed of flight (Fig. 2.1). To balance the equation at the new, higher speed, assuming the ‘cleaning up’ process has not involved у change of wing area or weight, the lift coefficient, Cl, must be reduced. The wing t be trimmed at a lower angle of attack. This re-trimming alone will reduce the vortex
|
Fig. 4.1 The lift to drag ratio of a gliding model
|
induced drag. A reduction of parasite drag of a speed model carries a bonus in the form of, this reduction in induced drag after re-trimming. Also, re-trimming to another angle of attack changes the profile drag of the wing. It may or may not decrease it; this depends almost entirely on the choice of aerofoil section, especially on its camber and its thickness form.
If the minimum weight of the model is not controlled by contest rules, a lighter model requires less total lift force for level flight at any speed. Ibis means that a lighter racing model will fly at a lower angle of attack than a heavy one of identical size and shape. This will cut induced drag, and, as before, may cut profile drag, depending on the aerofoil. A light, clean, model, with appropriate aerofoil, will fly faster.
F
I 4.1 GENERAL POINTS
|
( |
The diagrams of Chapter 1 and the main relationships of lift and drag to flight velocity, wing area, etc., help in the analysis of all model performance problems. For engine driven і models the need is usually either to achieve maximum speed with full control, for a pylon racer, or maximum rate of climb with a few seconds’ engine run, followed by a safe transition to gliding with a slow rate of sink, for duration types. For rubber driven models ; the climb problem is to make the most effective use of the energy stored in a given weight і of rubber, with, again, a smooth transition to gliding at the minimum possible rate of I descent For motor-assisted gliders, and electric-powered models, the primary concern ‘ may be with the margin of power available for climbing above the bare minimum required for level flight. For sailplanes the achievement of minimum sinking speed is always important, with safe characteristics on the towline for thermal soarers. For radio – controlled sailplanes, the quality of‘penetration’ is equally necessary. A model with good penetration is one which still retains a low rate of descent when flying fast. This will і enable it not only to make headway against a wind without too much loss of height, but in cross-country and slope soaring it will be able to pass through areas of sinking air more easily and reach the next upcurrent zone both sooner and higher than a sailplane with poor glide at high speeds.
I Fcr speed tasks, a sailplane has to fly very fast down a steep glide slope, with high ‘ speed reversals of direction at each end of the course. The requirements are very similar to those of the powered pylon racer, with the difference that the same model must also soar.
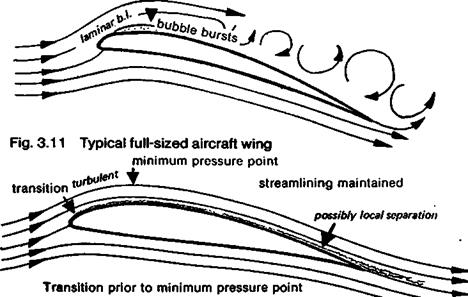
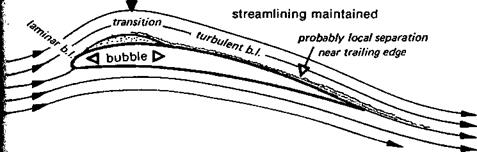
With favourable circumstance, if, for example, the deceleration of flow behind the ininimum pressure point is gradual, laminar separation may be followed by turbulent re – ichment (Fig. 3.6). The barrier of stagnant air disturbs the boundary layer in much the ie way as a ridge or hump on the wing and if the Re at this point is large eneugh, this іу bring about transition to turbulent flow. The increased thickness of the turbulent er brings it back to the wing surface, leaving the zone of stagnation as a separation >ble underneath. After this, the turbulent boundary layer continues against the pressure ienf and may reach the trailing edge without further separation. The greater average
momentum of the air particles in the lowest layers enables them to keep moving against the pressure forces tending to check them.
Within the separation bubble there is a local, detached circulation of flow with the layers of air nearest the skin flowing forwards. A very flattened vortex forms, extending spanwise. It has also been found that cross-vortices develop in the boundary layer behind the bubble, aligning themselves more or less chordwise.
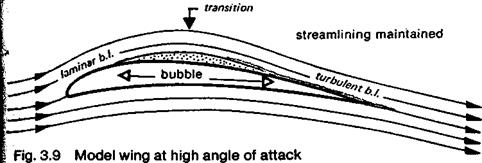
Laminar separation bubbles are almost always present on model aircraft wings, often despite efforts to prevent their appearance by use of turbulators. They occur also on full – J sized sailplanes and other small, slow-flying aircraft, though with less serious effects. The | lower the Reynolds number, the larger the effect of the separation bubble on the total drag j of the wing. Sometimes the separation bubble may be 40% of the wing chord in extent, the j flow separates over the whole middle part of the upper surface, but re-attaches before the I trailing edge (Fig. 3.8). At high angles of attack the minimum pressure point on many | aerofoils moves forward and the bubble follows close behind, sometimes becoming, shorter. The turbulent boundary layer after the bubble may then not have sufficient energy to enable it to remain attached completely, and it may separate somewhere before the trailing edge. As the angle of attack increases further, the separation point moves almost to the leading edge, and eventually the ‘bubble’ bursts. This is how most model wings stall (Fig. 3.7 and 3.10). The direct result of the low Reynolds number is an early stall. In subsequent chapters these effects are examined in respect of their influence on the design of aerofoil sections for models.
On large wings at high speeds, laminar flow rarely persists far behind the leading edge because Re is high and small imperfections of the surface force early transition without a separation bubble. Full-sized powered aircraft are thus usually free from laminar separation problems (Fig. 3.11).
|
Fig. 3.10 Model wing at stall
|
 |
In Figure 3.5 it is supposed that a model wing has a laminar boundary layer at the leading edge, with fairly high angle of attack. Over the front portion of the wing the pressure decreases as the airflow accelerates. The upper laminae thus feel slightly more viscous traction from above. They speed up, and pass this acceleration down from layer to layer so that the whole boundary layer gains momentum. The increasing velocity helps to
I Fig. 3.8 Typical small model wing at low angle of attack
Laminar separation with long bubble and turbulent re-attachment
|
|
Short bubble with turbulent re-attachment
maintain laminar flow, quite large bumps and imperfections in the wing may be overbidden without transition.
Where the point of minimum pressure is reached, the mainstream flow begins to slow blown. This checks the outermost lamina of the boundary layer and it, too, begins to slow. down. The influence passes downwards as before. However, the lower laminae were ‘ never moving very fast, and it requires only a slight deceleration for them to be brought to standstill. Some distance behind the minimum pressure point, therefore, the lowest parts of the laminar boundary layer halt The air at this point is stagnant and it forms a barrier ito the air moving in from upstream. The longer the deceleration continues, the more the boundary layer slows down. The stagnant barrier grows in size, forcing the flow off the wing surface altogether. This is laminar separation.
[t^n a turbulent boundary layer there is no tidy system of sliding layers. Instead air particles move with a good deal of freedom, up and down as well as in the general direction of the main flow. Although any one particle moves along at unsteady speed, the average rate of flow near the wing skin in the lowest parts of the turbulent boundary layer is considerably faster than it was before transition. This increases the skin friction, but because the particles are moving faster, they have greater momentum and are less easily halted. A typical velocity diagram for such a boundary layer after transition is considerably thicker as a whole than before, and as the Re rises further (i. e., as the flow moves further towards the trailing edge), the turbulent boundary layer continues to
 |
‘ thicken. The main airstream above the boundary layer has to accommodate to this sharp thickening of the b. l. in the transition zone, and to the further thickening thereafter. In
addition to the increased skin friction, the turbulent boundary layer, by compelling the main flow to accommodate in this way, increases the form drag of the wing profile (Fig. 3.4). It is as if the profile were thicker, causing a larger disturbance to the mainstream.
A very smooth surface, free from dirt, waves and other flaws, may delay transition. Transition on such surfaces moves aft, the critical Re in the boundary layer is high. A rough surface, or one with relatively large waves or bumps, brings transition forward, reducing the critical Re. For each type of surface there is a critical boundary layer Reynolds Number which for a given speed of mainstream flow is reached at some particular point. If the mainstream flow speeds up, the critical Re remains the same but it is reached earlier; i. e. the transition point or zone moves forward as speed rises, and back as speed is reduced. With full-sized aircraft transition usually takes place quite near the leading edge of wings, unless special aerofoils and very smooth surfaces, or other devices such as boundary layer suction, to remove the turbulent layers as it forms, are used. With models laminar flow tends to persist, which at first seems to give such small wings an advantage in terms of drag. Unfortunately other factors arise because of changes of pressure associated with the generation of lift by the wing.
Small surface imperfections such as rough spots, blobs of paint, fly specks, or, on a model, flaws in covering, bumps caused by protruding spars,’ etc., tend to disturb the laminar boundary layer, but at low boundary layer Reynolds numbers (i. e., near the leading edge of the wing), viscosity tends to damp down the disturbances and the laminar flow successfully over-rides them. Low flying speeds and small dimensions encourage the formation of laminar boundary layers on the leading edges of model wings. Even when the surface is not perfect, and no surface ever is, the boundary layer will initially be laminar. As the flow continues to move over the surface, the boundary layer Re rises with distance covered, and the damping effect of the viscosity becomes progressively less. Somewhere a critical point will be reached at which the small air ripples caused by surface irregularities just manage to maintain themselves without being damped out, and a small distance behind this point any minute disturbance will overcome the damping effect altogether. A distinctly wavy or rough surface will cause this sooner, i. e., at a lower Re. The laminae break up rather sharply and the flow makes a transition to turbulence (Figure 3.3). The
34
. point or narrow zone on the surface where this occurs is the transition zone, and it is j. associated with a critical boundary layer Reynolds Number. At higher b. l. Re (that is, l behind this zone on the wing) the boundary layer will be turbulent