Category Pressure and Temperature Sensitive Paints

Measurements of Pressure Time Response

The fast time response of PSP was achieved by Baron et al. (1993) using a commercial porous silica thin-layer chromatography (TLC) plate as a binder; the observed response time of this PSP was less than 25 ns. Although this fragile PSP cannot be practically used for wind tunnel testing, Baron’s work suggest that a short response time of PSP can be obtained using a porous material as a binder. Mosharov et al. (1997) reported that the response time of anodized aluminum

(AA) PSP was in a range of 18-90 |j. s, depending on a luminophore and on some features of an anodization process. Asai et al. (2001, 2002) also measured the response time of an AA-PSP with Ru(dpp) as a luminophore using a pressure chamber with a solenoid type valve. According to Jordan et al. (1999b), a sol-gel – based PSP achieved the frequency response of as high as 6 kHz. Ponomarev and Gouterman (1998) and Scroggin et al. (1999) developed binders by mixing hard particles with polymers to increase the degree of porosity. Ponomarev and Gouterman found that increasing the number of hard particles above a critical pigment volume concentration drastically shortened the response time. Table 8.1 summarizes the response times of some PSP formulations along with their luminescent lifetimes.

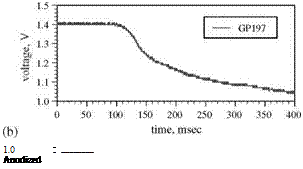
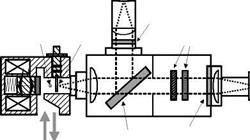
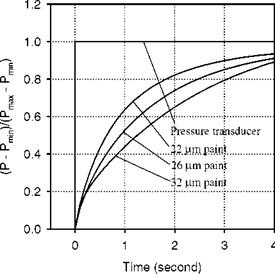
Solenoid valve type switching has been used to generate a step change in pressure for measurements of the response time of PSP by a number of researchers (Engler 1995; Carroll et al. 1995, 1996; Winslow et al. 1996; Mosharov et al. 1997; Fonov et al. 1998). Figure 8.8 shows a typical pressure jump apparatus used by Asai et al. (2002) for testing the time response of PSP. This apparatus had a small test chamber connected directly to a fast opening valve having a time constant of a few milliseconds. Sample plates used in this apparatus were typically aluminum coupons coated with PSP. Figure 8.9 shows the time response of the luminescent intensity for several PSP formulations using PtOEP as a probe molecule in binders GP197, AA, and Poly(TMSP) to a step change in pressure from vacuum to the atmospheric pressure. The pressure signal from a kulite® pressure transducer was also shown in Fig. 8.9 as a reference. The PSP based on GP197 was very slow and its time constant was in the order of seconds. Figure 8.10 shows the thickness effect on the time response of PtOEP in GP-197 to a step change of pressure (Carroll et al. 1996). In contrast, AA-PSP had the sub-millisecond time response, and Poly(TMSP)-PSP had a comparable response time to AA-PSP since Poly(TMSP) having a very large free volume is very porous. The time constant of Poly(TMSP)-PSP was about a few milliseconds. Jordan et al. (1999b) conducted frequency response experiments of sol-gel-based PSP using a speaker driver producing an oscillating pressure wave, and achieved the frequency response as high as 6 kHz. For a porphine-based PSP on a silica-gel TLC plate, Sakamura et al. (2002) utilized Cassegrain optics to detect a periodic pressure fluctuation of about 1 kHz in a chapped impinging air jet. The aforementioned measurements indicate that a high porosity is required to achieve the high time response of PSP. This viewpoint was examined by Asai et al. (2001) for a mixture of GP-197 with hard particles of BaSO4. Figure 8.11 shows the reduced response time to a step change of pressure with elevating the concentration of BaSO4 as a result of an increased porosity. Asai et al (2001) also noticed that a fast-responding porous PSP usually had lower temperature sensitivity.

Measurements of Pressure Time Response

Light Guide from Xe Lamp


Bandpass Filter

for Excitation Light Photomultiplier


Pressure PSP Transducer Sample


Tube (PMT)


Sharp Cut Filter


Measurements of Pressure Time Response

Bandpass Filter

for Luminescence Emission


Dichroic Filter


Fig. 8.8. Schematic of a pressure jump apparatus. From Asai et al. (2002)


Measurements of Pressure Time Response

(c)


Measurements of Pressure Time Response

Fig. 8.9. Time response of several PSPs to a step change in pressure, (a) kulite sensor (reference), (b) GP197-PSP, (c) AA-PSP, and (d) poly(TMSP)-PSP, where PtOEP is used a probe molecule. From Asai et al. (2002)

Measurements of Pressure Time Response

Fig. 8.10. Time response of PtOEP in GP197 to a step change of pressure, depending on the paint thickness. From Carroll et al. (1996)

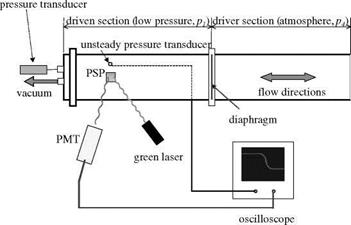
Another apparatus for creating a step pressure change is a shock tube (Sakaue et al. 2001; Teduka et al. 2000). A shock tube can generate a pressure rise in a few microseconds, and therefore it is a good device for testing a porous PSP having a response time less than a millisecond. Figure 8.12 shows a schematic of a simple shock tube for testing the time response of PSP (Sakaue et al. 2001). The shock tube had a 55×40 mm cross-section, a 428 mm long driver section, and a 485 mm long driven section. An aluminum foil diaphragm was burst by a pressure difference between the driver and driven sections, where the driver pressure was one atmospheric pressure. A pressure transducer (PCB Piezotronics model 103A11), which was connected to a 2 mm diameter pressure tap on the shock tube wall, was used to measure the unsteady reference pressure. Absolute pressures were measured using an Omega pressure transducer connected to the driven section. PSP was applied to a 25.4 mm square aluminum block flush mounted to the shock tube wall. The reference pressure transducer and PSP sample were mounted 300 mm from the diaphragm. A 532-nm laser was used as an illumination source for PSP and the laser spot size was about 2 mm on the sample surface. The luminescent emission from PSP was collected by a PMT through a long pass filter (> 570 nm) and the readout voltage from the PMT was acquired using a LeCroy oscilloscope. The response time of the PMT was about 2 |j. s. The time resolution of the apparatus was also limited by the laser spot size. The laser spot size dspot and the shock velocity us gives the limiting detectable

pressure rising time tlimit = dspot/us (about 3-5 |j. s) for this setup.

steady absolute

Measurements of Pressure Time Response

Fig. 8.12. Schematic of a simple shock tube setup for testing PSP time response. From Sakaue(1999)

Measurements of Pressure Time Response

Fig. 8.13. Pressure data obtained from AA-PSP with a thickness of 9 pm and pressure transducer compared with theoretical calculation. From Sakaue (1999)

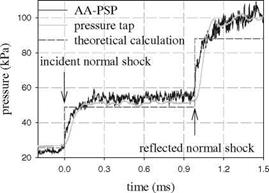
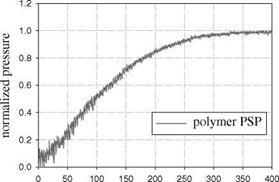
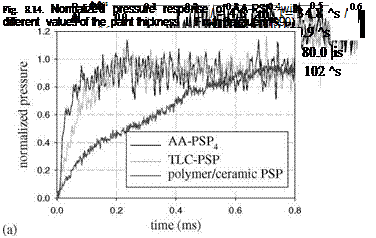
Figure 8.13 shows typical pressure signals from a Ru(dpp) AA-PSP (9 pm thick) and the pressure transducer along with the theoretical pressure jumps associated with the incident and reflected normal shock waves. This AA-PSP was able to follow the sharp pressure rises after the incident and reflected shock waves passed through the laser-illuminated spot. Figure 8.14 shows the normalized pressure signals from the AA-PSP with different thickness values (4.3, 9.0, 13.2, and 27.2 pm). It was found that the diffusion response time of this AA-PSP

followed the power-law relation TdiJJ h0573. Figure 8.15 shows a comparison of
Подпись: 1.2
Measurements of Pressure Time Response

the time response of four PSP formulations to a step change of pressure. These formulations used the same probe molecule Ru(dpp) with four different binders: AA, TLC, polymer/ceramic (PC), and conventional polymer RTV. The response times of AA-PSP and TLC-PSP were in the order of ten microseconds, whereas the conventional RTV-PSP had a much longer response time (in the order of hundred milliseconds). In addition, it was found that PC-PSP had a longer response time (about 1 ms) than the thicker but more porous TLC-PSP. For a very porous PSP, the porosity of a binder had more pronounced influence on the time response of PSP than the binder thickness. This is consistent with the theoretical analysis presented in Section 8.2.

Measurements of Pressure Time Response

time (ms)

Fig. 8.15. Comparison of the time response among (a) porous Ru(dpp)-based PSPs (AA – PSP, TLC-PSP, and PC-PSP) and (b) conventional polymer PSP Ru(dpp) in RTV. From Sakaue(1999)

Diffusion Timescale

Diffusion Timescale Подпись: (8.26)

For a porous polymer layer where diffusion is Fickian under some microscopic assumptions (Cunningham and Williams 1980; Neogi 1996), the diffusion equation Eq. (8.1) is still a valid phenomenological model as long as the diffusivity Dm is replaced by the effective diffusivity Dmeff. Hence, an estimate

Eq. (8.26) as a generalized form of Eq. (8.13) clearly illustrates how the fractal dimension d fr and the porosity parameters aV rp-o1re and hpore / h affect the

response time of a porous PSP. For aV rp-1re << 1 or hpore/h << 1, Eq. (8.26)

naturally approaches to the classical square-law estimate Eq. (8.13) for a homogenous polymer layer.

On the other hand, for aV r-1ore >> 1 and hpore /h ~ 1, another asymptotic estimate for rdiJf is a simple power-law as well

Tdiff ~ h2-dfr/Dm. (8.27)

The estimate Eq. (8.27) is asymptotically valid for a very porous polymer layer. The exponent in the power-law relation between the response time Tdiff and

thickness h deviates from 2 by the fractal dimension d fr due to the presence of

the fractal pores in the polymer layer. The relation Eq. (8.27) provides an explanation for the experimental finding that the exponent q in the power-law relation Tdiff hq is less than 2 for a porous PSP. In addition, this relation can

serve as a useful tool to extract the fractal dimension of the tube-like pores in a very porous polymer layer from measurements of the diffusion response time. For example, the fractal dimension dfr of a pore in the polymer Poly(TMSP) is

dfr = 1.71, while for GP197/BaSO4 mixture the fractal dimension dfr is close to one. In addition, based on the experimental results shown in Fig. 8.5, we know that the fractal dimension dfr for Poly(TMSP) linearly decreases with

temperature in a temperature range of 293.1-323.1 K. This implies that the geometric structure of a pore in Poly(TMSP) may be altered by a temperature
change. Note that the diffusivity Dm of oxygen mass transfer is also temperature – dependent, but it is independent of the coating thickness h. Therefore, the experimental results in Fig. 8.5 mainly reflect the temperature effect on the geometric structure of pores in the polymer rather than the diffusivity.

Table 8.1. Response times and luminescent lifetimes of PSPs

Paint

Thickness

Qrm)

Life­

time

(ns)

Response

time

Comments

References

LPSF1 (pyrene)

2

5 ms

OPTROD formulation

Borovoy et al. (1995)

PSPL2 (pyrene)

20

0.2 s

OPTROD formulation

Fonov et al. (1998)

PSPL4 (pyrene) PSPF2 (pyrene) PF2B (Ru(dpp))

13

5

0.172 s 0.1-2.6 ms 0.48 s

OPTROD formultation OPTROD formulation McDonnell Douglas (MD)

Fonov et al. (1998) Fonov et al. (1998) Carroll et al. (1996b)

PF2B (Ru(dpp))

15

5

0.88 s

formulation MD formulation

Carroll et al. (1996b)

PF2B (Ru(dpp))

25

5

1.2 s

MD formulation

Carroll et al. (1996b)

PF2B (Ru(dpp))

35

5

2.4 s

MD formulation

Carroll et al. (1996b)

PtOEP/polymer

19

50

0.82 s

concentrated luminophore near

Carroll et al. (1996b)

PtOEP/GP197

22

50

1.4 s

outer surface of the binder

Carroll et al. (1996b)

PtOEP/GP197

26

50

1.6 s

Carroll et al. (1996b)

PtOEP/GP197

32

50

2.4 s

Carroll et al. (1996b)

Ru(dpp)/RTV

6

5

22.4 ms

Winslow et al. (1996)

Ru(dpp)/RTV

11

5

58.6 ms

Winslow et al. (1996)

Ru(dpp)/RTV

16

5

148 ms

Winslow et al. (1996)

Ru(dpp)/RTV

20

5

384 ms

Winslow et al. (1996)

Ru(dpp)/PDMS

4-5

5

3-6 ms

Hubner et al. (1997)

PtOEP/GP197

50

2.5 s

Baron et al. (1993)

PtOEP/copolymer

50

0.4 s

Baron et al. (1993)

H2TFPP/silica

1.5-10 ms

silica with a binder

Baron et al. (1993)

h2tfpp/tlc

luminophore/AA

25 ns 18-90 ns

depended on the luminophore

Baron et al. (1993) Mosharov et al. (1997)

Ru(dpp)/FIB and

5

<500 ns

and anodization processes approached the apparatus

Ponomarev &

alumina

PtTFPP/FIB and

50

<500 ns

response time approached the apparatus

Gouterman (1998) Ponomarev &

alumina

PtTFPP/porous

50

60 ns

response time

Gouterman (1998) Scroggin (1999)

ceramic

Ru(dpp)/AA

5

80 ns

Sakaue et al. (2001)

Ru(dpp)/TLC

5

70 ns

Sakaue et al. (2001)

. Effective Diffusivity

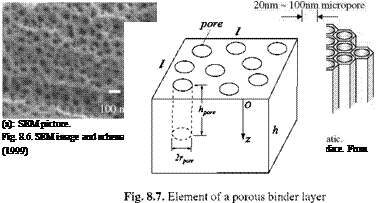
Diffusion in a porous material can be considered as a diffusion problem in a two – phase system made up of one disperse phase and one continuous polymer or other material. In PSP, the disperse phase is composed of numerous pores filled with air. Figure 8.6 shows a typical scanning electron microscopic (SEM) image of an anodized aluminum (AA) surface for PSP. Consider an element of a porous polymer layer of the length l, width l, and thickness h, as shown in Fig. 8.7. The coordinate z is normally directed to the polymer layer from the upper surface of the layer. First, we assume that many cylindrical (tube-like) pores are distributed and oriented in the z-direction in the element. The effective radius and depth of a pore are denoted by rpore and hpore, respectively. The radius of a pore is much larger than the size of a molecule of oxygen. In general, the depth of a pore is smaller than or equal to the layer thickness, i. e., hpore < h. For simplicity of

. Effective Diffusivity Подпись: (8.20)

expression, the normal directional derivative of the oxygen concentration [O2 ] at

. Effective Diffusivity

The effective diffusivity Dmeff of the porous polymer layer with many

. Effective Diffusivity Подпись: (8.21)

cylindrical pores is given by a balance equation between the mass transfer through the apparent homogenous upper surface and the total mass transfer across the air – polymer interface, i. e.,

where Npore is the total number of the pores in the element and Dm is the

diffusivity of the polymer continuum. The integral term in Eq. (8.21) is the total mass transfer across the peripheral surface of the pores in the element. Thus, the effective diffusivity Dmeff is given by

Подпись: Dmeff ^ DmПодпись: (8.22)1 + [vn( hpore )/Vn(0) – 1]Npore П r2pore l~2 -2 —1 Г hpore

+ Npore 2n rpore l~vn(0)]0 Vn(z)dz

In a simplified case where vn(z) = const. across the thin layer, Eq. (8.22) becomes

Dmeff / Dm = 1 + 2 av rpore h, (8.23)

where av = Npore nr2pon hpore l~2h – is the volume fraction of the cylindrical pores

in the polymer layer. Eq. (8.23) indicates that an increase of the effective diffusivity is proportional to the volume fraction of the pores and a ratio between the polymer layer thickness and the radius of the pore. Eq. (8.23) for Dmeff is

valid only for an ideal porous polymer layer with the straight cylindrical pores oriented normally. Nevertheless, this model can be generalized for real porous polymers where topology of the pores is often highly complicated.

For more realistic modeling, the topological structure of a pore is considered as a highly convoluted and folded tube in a polymer layer while the cross-section of the tube remains unchanged. The integral in Eq. (8.22) should be replaced by an integral along the path of a highly convoluted tube-like pore. In this case, the concept of the fractal dimension should be introduced because the length of a highly convoluted tube is no longer proportional to the linear length scale of the tube in the z-direction (e. g. hpore) (Mandelbrot 1982). According to the length-

area relation for a fractal path, the integral along the path is proportional to Af2

or hf, where dfr (1 < dfr < 2 ) is the fractal dimension of the path of a pore

and Apore <x h2pore is the characteristic area covering over the path. Loosely

speaking, the fractal dimension represents the degree of complexity of the pore pathway. In order to take the fractal nature of pores into account, Eq. (8.22) is generalized using a Riemann-Liouville fractional integral of the order dfr, i. e., (Nishimoto 1991)

Dmeff /Dm = 1 + [vn( hpore )/vn(0) _ 1 ]Npore П rtIre l~2

, Chpore d. (8.24)

+ Npore2nrporel v_1(0) vn(z)(dz) fr

. Effective Diffusivity Подпись: -1 hdfr, Подпись: (8.25)

Note that a unitary constant with the dimension [m1_dfr ] is implicitly embedded in the third term in the right-hand side of Eq. (8.24) to make Eq. (8.24) dimensionally consistent. This dimensional constant is implicitly contained in all the results derived from Eq. (8.24). In a simplified case where vn(z) = const. across a thin layer, a generalized expression for Dmeff is

where Г( 1 + d fr ) is the gamma function. Here, hpore is interpreted as a linear length scale of a convoluted tube in the z-direction and av is the volume fraction
of the apparent cylindrical pores. Eq. (8.25) clearly shows that the effective diffusivity Dmeff is not only proportional to hdfr, but also related to the porosity parameters aV rp0re and hpore /h. For dfr = 1, Eq. (8.25) is simply reduced to Eq. (8.23) for the straight cylindrical pores.

Time Response of Porous Pressure Sensitive Paint

8.1.2. Deviation from the Square-Law

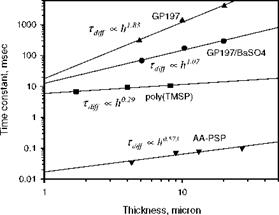
Compared to a conventional homogeneous PSP, a porous PSP has a much shorter diffusion time ranging from 18 |j. s to 500 |j. s due to enlarged air-polymer interface (Sakaue and Sullivan 2001; Sakaue et al. 2002a). Interestingly, recent measurements of the response time for three polymers, GP197, GP197/BaSO4 mixture and Poly(TMSP), show that the classical square-law estimate Eq. (8.13) does not hold for a porous PSP (Teduka 2001; Asai et al. 2001). As shown in Fig. 8.4, measurements gave the power-law relations for the diffusion timescale Tdiff <x h18 for GP197, Tdiff <x h107 for GP197/BaSO4 mixture, and Tdiff ^ h029 for Poly(TMSP) at 313.1 K. For a porous anodized aluminum (AA) surface, the power-law relation is Tdff h0573 (Sakaue 1999; Sakaue and Sullivan 2001). For

the GP197 silicone polymer, the power-law exponent is close to 2 as predicted by the classical estimate for a homogenous polymer film. However, the power-law exponent for the porous materials GP197/BaSO4 mixture, Poly(TMSP), and AA – PSP is significantly smaller than 2. In addition, Figure 8.5 shows that the power – law exponent for the polymer Poly(TMSP) linearly increases with temperature over a temperature range of 293.1-323.1 K. In order to understand the time response of a porous PSP, from a standpoint of phenomenology, Liu et al. (2001b) derived the expressions for the effective diffusivity and diffusion timescale of a porous layer.

Time Response of Porous Pressure Sensitive Paint

Fig. 8.4. The power-law relationship between the response time and coating thickness for three polymers GP197, GP197/BaSO4 mixture and Poly(TMSP) at 313.1 K, and AA surface at about 300K. Experimental data are from Teduka (2001), Asai et al. (2001), and Sakaue(1999)

Pressure Response and Optimum Thickness

Pressure Response and Optimum Thickness Подпись: (8.14)

Schairer (2002) studied the pressure response of PSP based on the solution Eq. (8.11) of the diffusion equation given by Mosharov et al. (1997). In a simpler notation, the luminescent intensity integrated over a paint layer is expressed as

where в is the extinction coefficient for the excitation light, C is a proportional constant, and a and k are the coefficients. In the quasi-steady case, the indicated pressure by PSP is

Ppsp(J) = [If/I(t) – A] / B, (8.15)

where the Stern-Volmer coefficients are determined from steady-state calibration of PSP. As shown in Eq. (8.15) coupled with Eqs. (8.11), (8.12) and (8.14), the indicated pressure pPSP(t) is a non-linear function of the true pressure that sinusoidally varies with time, p(t) = p0 + p1 sin( cot), although the diffusion equation is linear. However, if the amplitude of the unsteady pressure is small compared to the mean pressure (p1 << p0), the PSP response can be linearized and it is given by

pPSP(t) = p0PSP + p1PSP sin( ot + ф) (8 16)

= P0 + P1[a( y)sin( ot) + в( y)cos( ot)]’

where

Подпись: a( Y) в(ї) Подпись: Sln( 10) 1 -10-s Sln(10) 1 -10-s Pressure Response and Optimum Thickness
Pressure Response and Optimum Thickness
Подпись: (8.17)

The quantity S = eh/ln(10) represents the optical thickness of the paint layer. The unsteady amplitude ratio and phase shift are given by

P1rsp/P1 =a + в2

ф = tan-1(в/a). (8.18)

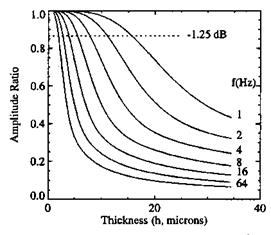
Figure 8.1 shows the attenuated amplitude ratio p1PSP / p1 at different frequencies for S/h = 0.01 qm-1 and Dm = 103 qm2/s.

The paint thickness affects both the frequency response and the signal-to-noise ratio (SNR) of PSP. As the thickness increases, the luminescent signal from PSP and thus the SNR increase, whereas the frequency response of PSP decreases as a result of the attenuation of the unsteady amplitude ratio. Hence, there exists an optimum thickness that balances the two conflicting requirements to achieve both high frequency response and SNR. Considering the unsteady luminescent signal I(t) = I0 +11 sin( at), Schairer (2002) introduced the unsteady signal amplitude

11 = Ig-Ja2 + в2 and then the unsteady SNR, SNR’ = 11 a2 + в2 .

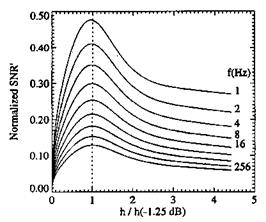
Figure 8.2 shows the normalized SNR’ as a function of the relative thickness h/h(-1.25dB), where h(-1.25dB) is the thickness that corresponds to 1.25dB (P1PSP / P1 = 0.866 ) attenuation of the unsteady amplitude ratio as illustrated in Fig. 8.1. Thus, an empirical estimate for the optimum thickness is hop / h(-1.25dB) ~ 1 that corresponds to the maximum value of the normalized

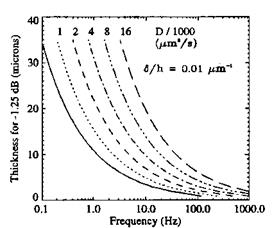
SNR’. As shown in Fig. 8.3, the optimum thickness hop ~ h(-1.25dB) decreases with the unsteady pressure frequency for a given diffusivity and relative optical thickness. Figure 8.3 indicates that the optimum thickness is less than 5 |jm for Dm < 16x 103 qm2/s when the pressure frequency is 100 Hz. For such a thin

paint layer, the absolute SNR ( ) is so low that accurate measurement of the

luminescent emission becomes difficult. This indicates that a conventional polymer-based PSP is not suitable to unsteady measurements.

When an unsteady pressure variation is no longer small, the non-linear effect of PSP response is appreciable, and the waveform of the PSP signal is distorted. In this case, recovery of the true unsteady pressure from the distorted signal is non­trivial. Assuming that the oxygen concentration is uniform across a thin paint layer, we substitute pPSP(t) = p = [O2]S^1ф0 into Eq. (8.15) and use the general solution Eq. (8.7) for [02], where S is the oxygen solubility of the binder and ф^ is the mole fraction of oxygen in air. Thus, at the air-paint

Подпись: 1 Bpo Pressure Response and Optimum Thickness Подпись: f(0) = f gt(t'-u)W(u,1)du , o Подпись: (8.19)

interface (z’ = z/h = 1), we obtain a Voltera-type integral equation for the function gt(t) = dg( t)/dt = df( t)/dt

where Po = [O2 ]0 S ~1фоІ is the initial pressure amplitude. In principle, after Eq.

(8.19) is solved for f(t), the unsteady pressure can be recovered, i. e.,

p( t ) = po f( t ) . However, since the non-dimensional time variable t’ = tDm / h2

in Eq. (8.19) contains the diffusion timescale Tdf = h2 / Dm, recovery of the true

unsteady pressure is affected by the local paint thickness unlike steady-state PSP measurements where the effect of the thickness is, at least theoretically speaking, eliminated by the intensity ratio procedure.

Pressure Response and Optimum Thickness

Pressure Response and Optimum Thickness

Fig. 8.1. The unsteady amplitude ratio as a function of the paint thickness for S / h = 0.01 pm-1 and Dm = 103 pm2/s. From Schairer (2002)


Pressure Response and Optimum Thickness

Fig. 8.2. The normalized SNR’ as a function of the relative paint thickness for S/ h = 0.01 pm-1 and Dm = 103 pm2 / s. From Schairer (2002)


Pressure Response and Optimum Thickness

Fig. 8.3. The optimum thickness as a function of the unsteady pressure frequency for S / h = 0.01 pm-1. From Schairer (2002)


Time Response

8.1. Time Response

of Conventional Pressure Sensitive Paint

8.1.1. Solutions of Diffusion Equation

Time Response Подпись: (8.1)

The fast time response of PSP is required for measurements in unsteady flows, which is related to two characteristic timescales of PSP. One is the luminescent lifetime of PSP that represents an intrinsic physical limit for an achievable temporal resolution of PSP. Another is the timescale of oxygen diffusion across a PSP layer. Because the timescale of oxygen diffusion across a homogenous polymer layer is usually much larger than the luminescent lifetime, the time response of PSP is mainly determined by oxygen diffusion. In a thin homogenous polymer layer, when diffusion is Fickian, the oxygen concentration [O2] can be described by the one-dimension diffusion equation

where Dm is the diffusivity of oxygen mass transfer, t is time, and z is the coordinate directing from the wall to the polymer layer. The boundary conditions at the solid wall and the air-paint interface for Eq. (8.1) are d[O2]/d z = 0 at z = 0,

[O2] = [O2 ]o f (t) at z = h, (8.2)

where the non-dimensional function f( t) describes a temporal change of the oxygen concentration at the air-paint interface, [O2 ]0 is a constant concentration of oxygen, and h is the paint layer thickness. The initial condition for Eq. (8.1) is [O2] = [O2]0f(0) att = 0. (8.3)

Introducing the non-dimensional variables

n(t’ ,z’) = [O2]/[O2]0 – f(0), z’ = z/h, t’ = tDm/h2, (8.4)

we have the non-dimensional diffusion equation

dn _ d2n

Подпись: (8.5)dt ~d^

with the boundary and initial conditions

dn/dZ_ 0 at z _ 0 , n _ g(t’) at z’_ 1, n _ 0 at t _ 0 , (8.6)

where the function g( t’) is defined as g(t’) _ f(t’)- f(0) that satisfies the initial condition g(0) _ 0 .

Time Response Подпись: (8.7)

Applying the Laplace transform to Eq. (8.5) and the boundary and initial conditions Eq. (8.6), we obtain a general convolution-type solution for the normalized oxygen concentration n(t’ ,z’)

In Eq. (8.7), the function gt(t) _ dg(t)/dt _ df(t)/dt is the differentiation of g(t) with respect to t and the function W(t, z) is defined as

Подпись: (8.8)W(t, z) _ V (-1)kerfc(1 + 22k z ) + У (-1)keifc(1^). k_0 Mt k_0 2jt

The derivation of Eq. (8.7) uses the following expansion in negative exponentials [1 + exp( -2л[1)]- ^ (-1 )n exp( -2^[s ), where s is the complex variable of

n_0

the Laplace transform. In particular, for a step change of the oxygen concentration at the air-paint interface, after gt(t) _ S(t) is substituted into Eq. (8.7), the oxygen concentration distribution in a paint layer is simply n(t’,z ) _ W(t’,z’), a classical solution given by Crank (1995) and Carslaw and Jaeger (2000).

Time Response Подпись: (8.9)

Instead of using the Laplace transform, Winslow et al. (2001) studied the solution of the diffusion equation using an approach of linear system dynamics. The special solutions for a step change and a sinusoidal change of oxygen were used for PSP dynamical analysis by a number of researchers (Winslow et al. 1996, 2001; Carroll et al. 1995, 1996; Mosharov et al. 1997; Fonov et al. 1998). The trigonometrical-series-type solution for a step change of oxygen given by Carroll et al. (1996) is

where Ak _ -2( -1 )k /(hXk), Xk _ (2k -1 )n/( 2h), [O2 ]max _ [O2 ](t, h), and [O2 ]min _ [O2 ](0,z). Similarly, Winslow et al. (1996) used the trigonometrical – series-type solution for a sinusoidal change of oxygen

Time Response Подпись: (8.10)

[O2 ](t, z)-[O2 ]o –

Подпись: вк Time Response

where

The constants [O2 ]0 and [O2 ]1 are given in the initial and boundary conditions [O2 ](0,z) – [O2 ]o and [O2 ](t, h) – [O2 ]o + [O2]1 sin(ot).

Mosharov et al. (1997) also presented the trigonometrical-series-type solution of the diffusion equation in a similar form to Eq. (8.9) for a step change at a surface. Note that they defined a coordinate system in such a way that the air- paint interface was at z – 0 and the wall was at z – h. For a sinusoidal change of oxygen [O2 ](t,0) – [O2 ]0 + [O2 ]1 sin( ot) at the air-paint interface, they gave a solution composed of two harmonic terms, i. e.,

[O2](t, z) – [O2]0 + [O2]1[ X(y, z’ )sin( ot) + Y(y, z’ )cos( ot)] , (8.11)

where у-(oh2 /Dm)1/2 is a non-dimensional frequency and z!- z/h is a non­dimensional coordinate normal to the wall. The coefficients in Eq. (8.11) are X(Y, z’)-

cosh[42 y(1 – z! /2)] cos( у z! / 42)+cos[42 y(1 – z! /2)] cosh( у z! / 42)
cos h(j2 y)+ cos Ы2 y)

Y( Y, z! ) –

sinh[-[2 y( 1 – z!/ 2)] sin( yz! / V2 )+sin[j2 y(1 – z! / 2)] sinh( yz!/y[2 ) .
cos h(42 y)+ cos Ф y)

(8.12)

These trigonometrical-series-type solutions, which are often obtained using the method of separation of variables, should be equivalent to the general convolution-type solution Eq. (8.7) that is reduced in these special cases.

The solutions of the diffusion equation give a classical square-law estimate for the diffusion timescale Tdiff through a homogenous PSP layer,

rdiff ~ h2/Dm. (8.13)

The square-law estimate is actually a phenomenological manifestation of the statistical theory of the Brownian motion. Interestingly, this estimate is still valid even when the diffusivity of a homogeneous polymer is concentration-dependent. The 1D diffusion equation with the concentration-dependent diffusivity can be
reduced to an ordinary differential equation by using the Boltzmann’s transformation % = z/(2t1/2); hence, the solution for the concentration distribution can be expressed by this similarity variable (Crank 1995). Clearly, the Boltzmann’s scaling indicates that the timescale for any point to reach a given concentration is proportional to the square of the distance (or thickness).

Using the solution of the diffusion equation for a step change of pressure, Carroll et al. (1997) estimated the mass diffusivity Dm for oxygen in a typical

silicon polymer binder and gave Dm = 1.23-1.88x 10- m2/s over a temperature range of 9.9-40.2oC. The values of Dm = 3.55x 10- m2/s for the pure polymer Poly(dimethyl Siloxane) (PDMS) and Dm = 1.2x 10⁻⁹ m2/s for PDMS with 10% fillers were also reported (Cox and Dunn 1986; Pualy 1989). For a 10 |jm thick polymer layer having the diffusivity Dm = 10~10 -10- m2/s, the diffusion

timescale is in the order of 0.1-1 s. Therefore, a conventional non-porous polymer PSP has slow time response, and it is not suitable to unsteady pressure measurements.

Elemental Error Sources

The elemental error sources of TSP have been discussed by Cattafesta et al. (1998) and Liu et al. (1995c). Table 7.2 lists the elemental error sources, sensitivity coefficients, and total uncertainty of TSP. The sensitivity coefficients for many variables are related to (p=KT/(T _Tre/). The elemental errors in the

variables Dt(At) , Dx(Ax ) , Dq0(At) , V, Vre/ , Пстсге/ , П//П/re/ , h/hre/r

c/cre/, and q0/q0re/ can be estimated using the same expressions given in the

uncertainty analysis for PSP, which represent the error sources associated with model deformation, unstable illumination, photodegradation, filter leakage, and luminescence measurements. The camera calibration error and temperature mapping error can be also estimated using the similar expressions to those for

PSP, i. e., var(T) ~(dT/dx) a22 +(dT/9y)a2 and var(T) = |(VT)surf • (AX)/ ,

where ax and ay are the standard deviations of least-squares estimation in image

registration or camera calibration. In order to estimate the TSP calibration errors, the temperature dependency of TSP was repeatedly measured using a calibration set-up over days for several TSP formulations (Liu et al. 1995c). Temperature measured by TSP was compared to accurate temperature values measured by a
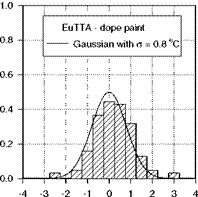
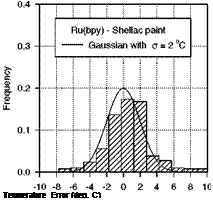
standard thermometer. Figure 7.22 shows histograms of the temperature calibration error for EuTTA-dope and Ru(bpy)-Shellac TSPs, which exhibit a near-Gaussian distribution. The standard deviation for EuTTA-dope TSP is about 0.8oC over a temperature range of 15-70oC. For Ru(bpy)-Shellac TSP, the histogram has a broader error distribution having the deviation of about 2oC over a temperature range of 20-100oC.

The temperature hysteresis introduces an additional error source for TSP, which was reported in calibration experiments for a Rhodamine(B)-based coating (Romano et al. 1989). The temperature hysteresis is related to the polymer structural transformation from a hard and relatively brittle state to a soft and rubbery one when temperature exceeds the glass temperature of a polymer. Since the thermal quenching of luminescence in a brittle condition is different from that in a rubbery state, the temperature dependency is changed after it is heated beyond the glass temperature. To reduce the temperature hysteresis, TSP should be pre­heated to a certain temperature above the glass temperature before it is used as an optical temperature sensor for quantitative measurements. It was found that for both pre-heated EuTTA-dope and Ru(bpy)-Shellac paints the temperature hysteresis was minimized such that the temperature dependency remained almost unchanged in repeated tests over several days (Liu et al. 1995c).

Elemental Error Sources

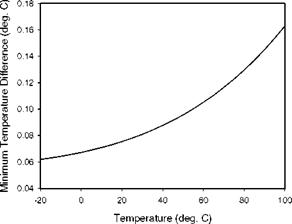
Fig. 7.21. The minimum resolvable temperature difference as a function of temperature for a Ruthenium-based TSP for (nperef )max = 500,000e, KT = 37.7oC, and Tref = 20oC

Подпись: (a)

Elemental Error Sources Подпись: Frequency Подпись: Temperature Error (deg. C)

(b)

Fig. 7.22. Temperature calibration error distributions for (a) EuTTA-dope TSP and (b) Ru(bpy)-Shellac TSP, where о is the standard deviation. From Liu et al. (1997b)

Table 7.2. Sensitivity coefficients, elemental errors, and total uncertainty of TSP

Variable

Sensi.

Elemental Variance

Physical Origin

Z

Coef.

Si

var( Ci)

1

Dt(At)

<p

[(dV/dt)( At)/V][2] [3] [4]

Temporal variation in luminescence due to photodegradation and surface contamination

2

DJAx )

V

[ (dV/dx)2 a2 +(3V/3y)2 a 2y ]V-2

Image registration errors for correcting luminescence variation due to model motion

3

Dqo(At)

V

[( dq0/ d t)( At)/q0ref]2

Temporal variation in illumination

4

Vrf

V

Vref G Й V Bd

Photodetector noise

5

V

-(p

VG hv Bd

Photodetector noise

6

n cm Cref

<p

[R2/(Rj + R2 )]2(ARi/Ri )2

Change in camera performance parameters due to model motion

7

П //П f ref

V

var(nf/Пfref )

Illumination spectral variability and filter spectral leakage

8

h/href

(p

[(dh/дx)2a2 + (h/дy)2a2 ]h-f

Image registration errors for correcting thickness variation due to model motion

9

C/Cref

V

[ (dc/d x) al + (Эс/Э y) a 2 ] c-^

Image registration errors for correcting concentration variation due to model motion

10

q0/q0ref

V

(%г4Ґ( Vq0) • ( AX )

Illumination variation on model surface due to model motion

11

KT

1

var( KT)

Paint calibration error

12

Temperature

mapping

1

(dT/dx)2 a2 + (dT/dy) a2y

Errors in camera calibration and temperature mapping on a surface of

and ( VT)sllf • ( AX )f

a presumed rigid body

M

Total Uncertainty in Temperature var(T)/(T – Tref )2 = ^ Si2 var( )/Ct2

i = 1


Uncertainty of Temperature Sensitive Paint

7.5.1. Error Propagation and Limiting Temperature Resolution

In principle, the above uncertainty analysis for PSP can be adapted for TSP since many error sources of TSP are the same as those of PSP. For simplicity, instead of the general Arrhenius relation, we use an empirical relation between the luminescent intensity (or the photodetector output) and temperature T for a TSP uncertainty analysis (Cattafesta and Moore 1995; Cattafesta et al. 1998)

T -Tref = Kt ln( Iref /I) = KT ln(U2 Vf /V), (7.25)

where KT is a TSP calibration constant with a temperature unit and U 2 is the factor defined previously in Eq. (7.2) for the PSP uncertainty analysis. Without model deformation and temporal illumination variation, the factor U 2 equals to one. Eq. (7.25) can be used to fit TSP calibration data over a certain range of temperature. The error propagation equation for TSP is

var(T) = KT у var( <Tt) + var( Kt )

(T – TKf)2 (T – Tref )2 i=f kK, (. )

Uncertainty of Temperature Sensitive Paint
where the variables (С,,1 = M} denote a set of the parameters Dt(At),

where (npere/ )max is the full-well capacity of a CCD camera in the reference conditions. The minimum resolvable temperature difference (AT)min is inversely proportional to the square-root of the number of collected photoelectrons, and approximately proportional to the calibration constant KT. When (npere/ )max is

500,0 electrons, for a typical Ruthenium-based TSP having KT = 37.7oC, the minimum resolvable temperature difference (AT)min is shown in Fig. 7.21 as a function of T at a reference temperature Tre/ = 20oC. When N images are averaged, the limiting temperature resolution given by Eq. (5.27) should be

divided by a factor N1/2.

Gated Intensity Ratio Method

Gated Intensity Ratio Method
In the gated intensity ratio method for the sinusoidally modulated excitation light, pressure can be expressed as a function of the gated detector output ratio V2 / V1

Подпись: dpПодпись: = _1.= Ksv

Ksv P dKsy

Gated Intensity Ratio Method

S0 = — ^ = 1 + 1/(KsvP) , 0 P дто

Подпись:P dV2

Gated Intensity Ratio Method

In the photon-shot-noise-limited case, the uncertainties in the detector outputs are var(V1) = V1Ghv Bd and var(V2) = V2Ghv Bd. Thus, the photon-shot-noise – limited pressure uncertainty for the gated intensity ratio method is

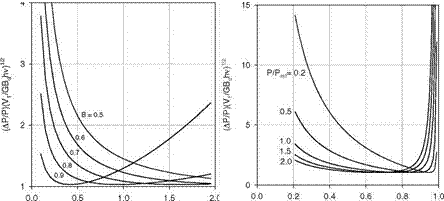
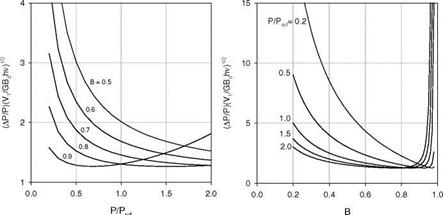
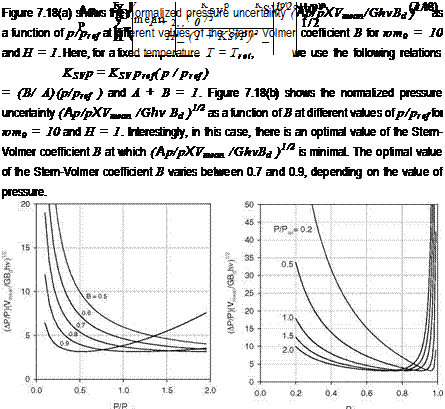
Figure 7.19(a) shows the normalized pressure uncertainty (Ap/pXV1 /GhvBd )1/2 as a function of p/pref at different values of the Stern-Volmer coefficient B for at0 = 10 and H = 1. Figure 7.19(b) shows the normalized pressure uncertainty (Ap/pXVmean/GhvBd )1/2 as a function of B at different values of p/pref for at0 = 10 and H = 1. Similar to the amplitude demodulation method, there is an optimal value of B (around 0.8) to achieve the minimal value of (Ap/pXVmean/GhvBd )1/2. In general, to reduce the noise, the gated intensity ratio method has to collect sufficient photons over a large number of cycles. For

Gated Intensity Ratio Method

example, compared to a standard CCD camera system with an integration time of 1 second, a gated CCD camera with a modulation frequency of 50 kHz needs to accumulate photons over 100,000 cycles to achieve the equivalently small uncertainty. The accumulation of photons can be done automatically in a phase sensitive camera.

(a)

Fig. 7.19. The normalized pressure uncertainty (Ap/pXVj /Ghv Bd )1/2 for the gated intensity method using a sinusoid modulation with mx0 = 10 and H = 1 as a function of P/Pref for different values of the Stern-Volmer coefficient B, and a function of B for different values of p/pref

Gated Intensity Ratio Method

Gated Intensity Ratio Method

SV ) + S 2 var( Tq) + S 2 var(V1) + S2 var(V2)


T


Gated Intensity Ratio Method

2


2


V22

(7.23)


k2


V12


0


Gated Intensity Ratio Method
Gated Intensity Ratio Method Gated Intensity Ratio Method

k*


Gated Intensity Ratio Method

= ,

KSV P dKSF ’

s „ =- Iе = і+i/(Ksvp),


Gated Intensity Ratio Method

Gated Intensity Ratio Method

(a) (b)

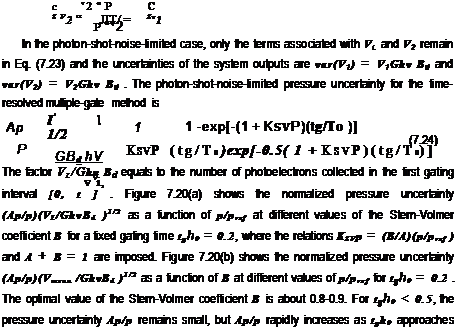
Fig. 7.20. The normalized pressure uncertainty (Ap/p)(V1/GhvBd )1/2 for the gated intensity method with a pulse excitation and tg/x0 = 0.2 as (a) a function of p/pref for different values of the Stern-Volmer coefficient B, and (b) a function of B for different values of p/pref

Pressure Uncertainty of Lifetime-Based Methods

7.4.1. Phase Method

The phase method for PSP measurements, as described in Chapter 6, determines pressure by

Подпись: p = K Pressure Uncertainty of Lifetime-Based Methods Подпись: (7.13)

where tan (p = ojt = – Vc/Vs is uniquely related to the lifetime for a fixed modulation frequency, and Vc =-Am %HMf sin(f) and Vs = Am %HMeffcos(p) are

Pressure Uncertainty of Lifetime-Based Methods Подпись: (7.14)

the DC components from the low-pass filters. The error propagation equation gives the relative variance of pressure

Pressure Uncertainty of Lifetime-Based Methods Pressure Uncertainty of Lifetime-Based Methods

The first term is the uncertainty related to temperature, the second is the uncertainty in PSP calibration, the third is the error in the given reference lifetime, and the last two terms are the uncertainties associated with the measurement system composed of a photodetector and lock-in amplifier. The sensitivity coefficients in Eq. (7.14) are

e Vc д p c

Подпись: p d VcSVc = – — = SV

Compared to the intensity-based method discussed in Chapter 4, many error sources associated with model deformation do not exist, which reflects the advantage of the lifetime-based method. When the photon shot noise of the detector dominates, the pressure uncertainty is mainly contributed by the last two terms in Eq. (7.14). In the photon-shot-noise-limited case, the uncertainties in the outputs of the detector and lock-in amplifier are var(Vs) = ^^GhvBd and

Pressure Uncertainty of Lifetime-Based Methods

Pressure Uncertainty of Lifetime-Based Methods

The estimate Eq. (7.15) for the phase method is similar to Eq. (7.4) for the intensity-based CCD camera system. The behavior of the pressure uncertainty as a function of pressure and the Stern-Volmer coefficient B is similar to that shown in Figs. 7.4 and 7.5.


Pressure Uncertainty of Lifetime-Based Methods

S,0 ——= 1 + 1/(KsvP) , 0 P d Г0


Pressure Uncertainty of Lifetime-Based Methods

In the photon-shot-noise-limited case, the uncertainties in the detector outputs

are Var(Vmean ) = VmeanG hv Bd and var(Vtd ) = Vstd Ghv Bd. Thus the photon-shot-

Pressure Uncertainty of Lifetime-Based Methods

noise-limited pressure uncertainty is

Fig. 7.18. The normalized pressure uncertainty (Ap/p)(Vmean/GhvBd )1/2 in the amplitude demodulation method with ют0 = 10 and H = 1 as a function of p/pref for different values of the Stern-Volmer coefficient B, and a function of B for different values of p/pref