Category Pressure and Temperature Sensitive Paints

Simulation

Inspired by the experimental study of Kammeyer et al. (2002a, 2002b), Liu and Sullivan (2003) studied in-situ calibration uncertainty of PSP through a simulation of PSP measurements in subsonic Joukowsky airfoil flows. It is assumed that in – situ calibration uncertainty is mainly attributed to the temperature effect of PSP and illumination change on a surface due to model deformation. The Joukowsky airfoil and subsonic flows around it are generated using the Joukowsky transform plus the Karman-Tsien rule as described in Section 7.2. An adiabatic model is
considered that is coated with Bath Ruth + silica-gel in GE RTV 118. Four point light sources for illuminating PSP and two cameras for imaging are placed at the same locations as described in Section 7.2. The twist 0twist and bending Ty of the airfoil are a function of the angle of attack (AoA or a) for a given Mach number and Reynolds number. Based on previous wing deformation measurements (Burner and Liu 2001), the typical linear relations 0twist =-0.113 a (deg) and Ty = 0.022a (in) are used over a certain range of AoA at a certain spanwise

location of a wing. Thus, a change of the illumination radiance on the airfoil surface due to the deformation is estimated using a transformation of rotation and translation for the airfoil moving in the given illumination field.

Simulation Подпись: ref  1 ref 0 Simulation Подпись: 1 Подпись: V L0 J Simulation Подпись: 1

In simulation, the measured luminescent intensity (I) distribution of PSP in the wind-on case (deformation case) is generated by

where Iref0 and Iref are the reference luminescent intensities (without wind) on the non-deformed airfoil and deformed airfoil, respectively. It is assumed that Iref0 and Iref are proportional to the corresponding illumination radiance levels

L0 and L on the non-deformed airfoil and deformed airfoil, respectively. The surface temperature T is substituted by the adiabatic wall temperature distribution Taw, and the pressure distribution is given by the Joukowsky transform plus the Karman-Tsien rule for subsonic flows. Therefore, the resulting luminescent intensity distribution contains the effects of both the illumination change and temperature variation on the surface.

Assuming that the wind-on image (I) is already re-aligned with the wind-off image Iref0 on the non-deformed airfoil by the image registration technique, in-

situ PSP calibration is made to correlate Iref0/I to p/pref using the Stern-

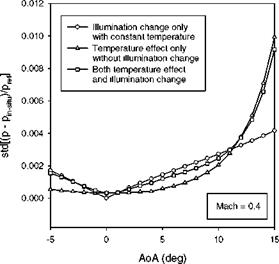
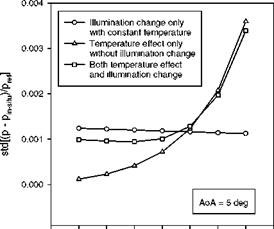
Volmer relation based on 104 virtual pressure taps on each of the upper and lower surfaces. For a given AoA and Mach number, the histogram of in-situ calibration error Ap/ pref = (p – pin_!dtu)/pref is found to be a near-Gaussian distribution, where Ap is a difference between the true pressure from the theoretical distribution and the pressure converted from the luminescent intensity using in – situ calibration. The standard deviation (std) of the probability density function is dependent on AoA and Mach number. Figures 7.15 and 7.16 show the std of the in-situ calibration error as a function of AoA for Mach 0.4 and as a function of the Mach number for AoA = 5o, respectively. Figures 7.15 and 7.16 also show the isolated effects of the temperature and illumination change on the std. The behavior of the calculated std as a function of AoA is very similar to the experimental results shown in Fig. 7.14. The concavity of the std as a function of AOA in Fig. 7.15 is mainly attributed to the movement of the airfoil.

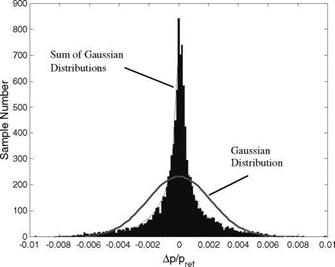
Figure 7.17 shows the simulated histogram for an overall sample set of Ap/pref (a total of 10920 samples) over the whole range of AoA and Mach

numbers, duplicating the experimental non-Gaussian distribution in Fig. 7.13 given by Kammeyer et al. (2002a, 2002b). The Gaussian distribution with the same std is also plotted in Fig. 7.17 as a reference. In fact, for a union of sample sets having near-Gaussian distributions with different the std values at different AoA and Mach numbers, the distribution becomes non-Gaussian because more and more samples accumulate near zero when forming a union of the sample sets. The probability density function of a union of the N sample sets should be given by a sum of the Gaussian distributions rather than the Gaussian distribution, i. e.,

N

N~1 ^ exp(-x2 /2a2 )/^2nai.

i=1

As shown in Fig. 7.17, this distribution correctly describes the simulated histogram. Note that we should not confuse this case with the central limit theorem that deals with a sum of independent random variables. Although the simulation is made for an airfoil section of a wing, the in-situ calibration error for a wing can be estimated by averaging the local results over the full wingspan; therefore, the behavior of the error for a wing should be similar to that for an airfoil.

Simulation

Fig. 7.15. In-situ PSP calibration error as a function of the angle-of-attack (AoA) for Mach 0.4 in Joukowsky airfoil flows. From Liu and Sullivan (2003)

Simulation

0.25 0.30 0.35 0.40 0.45 0.50 0.55 0.60 0.65

Mach Number

Fig. 7.16. In-situ PSP calibration error as a function of the Mach number for AoA = 5o in Joukowsky airfoil flows. From Liu and Sullivan (2003)

Simulation

Fig. 7.17. Histogram of the overall set of in-situ PSP calibration errors in the whole ranges of AoA and Mach numbers in Joukowsky airfoil flows. From Liu and Sullivan (2003)

In-Situ Calibration Uncertainty

7.3.1. Experiments

As pointed out before, the use of a priori PSP calibration in large wind tunnels often leads to a considerable systematic error since the surface temperature distribution is not known and the illumination change on a surface due to model deformation cannot be corrected by the image registration technique. The systematic error is also related to uncontrollable environmental testing factors. Therefore, in actual PSP measurements, experimental aerodynamicists are forced to calibrate PSP in situ by fitting (or correlating) the luminescent intensity to pressure tap data at a number of suitably distributed locations. In a sense, in-situ PSP calibration eliminates the systematic error associated with the temperature effect and the illumination change by absorbing it into an overall fitting error.

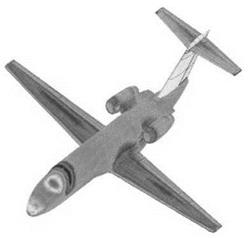
Kammeyer et al. (2002a, 2002b) assessed the accuracy of the Boeing production PSP system by statistical analysis of comparison between PSP and pressure transducers over a large numbers of data points. The Boeing PSP system is a typical intensity-based system that uses eight CCD (1024×1024 or 512×512) cameras for imaging, thirty lamps for illumination, and two IR cameras measuring the surface temperature for correcting the temperature effect of PSP. The test article was a 1/12th-scale model of a Cessna Citation that was instrumented with a total of 225 pressure taps. The tests were conducted in the DNW/NLR HST wind tunnel, a variable-density, closed circuit, continuous tunnel with slotted top and bottom test section walls (12% open). The test section was 6.56 ft wide and was configured to be 5.25 ft high. The cameras and lamps were mounted in the floor and ceiling. A run consisted of a lift polar at each of several Mach numbers from 0.22 to 0.82. Two Reynolds numbers, 4.5 and 8.3 millions, were run. Fourteen angles of attack were from -4 to 10o. Over 8300 visual images and over 2000 IR images were obtained for 676 test points. The wind-off reference images were acquired after the run when the fan had stopped in order to reduce the effect of the model temperature distribution. Figure 7.11 shows a typical pressure distribution on the model obtained by PSP.

In-Situ Calibration Uncertainty

Fig. 7.11. Typical pressure distribution obtained from PSP on a Cessna Citation model. From Kammeyer et al. (2002a)

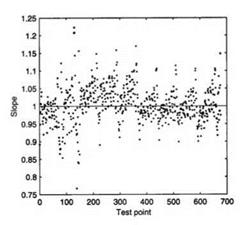
In-situ PSP calibrations were performed by utilizing 78 of 225 pressure taps for each of the cameras. Figure 7.12 shows the variation of the in-situ calibration slope (i. e. the Stern-Volmer coefficient B) as a function of test point throughout the tests, where no temperature correction was applied. The variation does not show an overall trend; the repeating pattern mirrors the pattern of the test conditions, wherein sequential angles of attack were run for sequentially increasing Mach numbers. The mean value of the slope is close to one, which is approximately consistent with the paint characteristics given by a priori calibration. The scatter is attributed to a number of factors, including the non­homogeneous temperature distributions, temperature differences between the wind-off and wind-on conditions, lamp intensity drift, and image registration error.

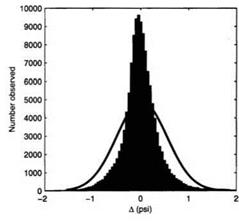
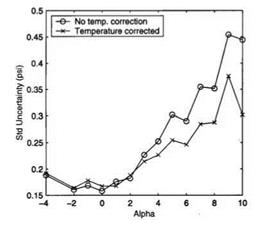
The accuracy of the PSP system was directly assessed by comparing the pressure value measured by a transducer/tap combination with that obtained from PSP at the same tap location. After some problematic pressure data were excluded, 130,391 comparisons from 221 taps and 676 wind-on test points were used as an overall set of realizations for statistical analysis. The PSP data processing included in-situ calibration, but did not exercise the explicit temperature correction. When examining the comparisons, the 78 taps were used for in-situ calibration to provide residual comparisons, while other taps provided truly independent comparisons. Figure 7.13 shows a histogram for the over set of comparisons, where a Gaussian distribution with the same mean and standard deviation is superimposed for comparison. Clearly, the distribution is non­Gaussian. A robust estimate of the 68% confidence level gives an estimate of the standard uncertainty of 0.29 psi, which corresponds to 0.0065 in Cp. Figure 7.14 shows the standard uncertainty as a function of the angle of attack for the right wing. The behavior of the dependency of the uncertainty on the angle of attack corresponds to wing deformation. This indicates that the error is associated with the movement of the model in the non-homogenous illumination field, which cannot be corrected by the image registration technique. Kammeyer et al. (2002a, 2002b) also studied temperature correction using the IR cameras. Two sets of PSP data obtained before and after temperature correction were used to assess the effectiveness of the temperature correction. Figure 7.14 shows the standard uncertainty after the temperature correction as a function of the angle of attack. The temperature correction was increasingly effective when the angle of attack was larger than 2o; it removed the spatial biases associated with the temperature distribution on the model. Overall, the standard uncertainty, priori to the temperature correction, was in the range 0.16-0.45 psi (0.04-0.1 Cp); with the temperature correction, it was in the range 0.17-0.35 psi (0.04-0.09Cp). The significance of the work of Kammeyer et al. (2002a, 2002b) is that it identifies the functional dependency of in-situ PSP calibration uncertainty on the testing parameters such as the angle of attack and Mach number.

In-Situ Calibration Uncertainty

Fig. 7.12. Variation of PSP in-situ calibration slope throughout the tests on a Cessna Citation model. From Kammeyer et al. (2002a)

In-Situ Calibration Uncertainty

Fig. 7.13. Histogram of the overall set of PSP errors compared with a Gaussian distribution of the equivalent mean and standard deviation. From Kammeyer et al. (2002a)

In-Situ Calibration Uncertainty

Fig. 7.14. Standard uncertainty of PSP on the right wing of a Cessna Citation model as a function of the angle of attack. From Kammeyer et al. (2002a)

Pressure Uncertainty Analysis for Subsonic Airfoil Flows

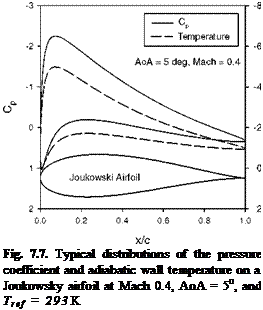
Подпись: Fig. 7.7. Typical distributions of the pressure coefficient and adiabatic wall temperature on a Joukowsky airfoil at Mach 0.4, AoA = 5o, and Tref = 293 K

PSP measurements on a Joukowsky airfoil in subsonic flows are simulated in order to illustrate how to estimate the elemental errors and the total uncertainty using the techniques described above. The airfoil and incompressible potential flows around it are generated using the Joukowsky transform; the pressure coefficients Cp on the airfoil in the corresponding subsonic compressible flows are obtained using the Karman-Tsien rule. Figure 7.7 shows typical distributions of the pressure coefficient and adiabatic wall temperature on a Joukowsky airfoil at Mach 0.4 and AoA = 5o.

Presumably, PSP, Bath Ruth + silica-gel in GE RTV 118, is used, which has the Stern-Volmer coefficients A(T) ~ 0.13[1 + 2.82(T – Tref )/Tref ] and

B(T) ~ 0.87[1 + 4.32(T – Tref)/Tref] over a temperature range of 293-333 K.

The uncertainties in a priori PSP calibration are AA/A = AB/B = 1% . We assume that the spatial changes of the paint thickness and dye concentration in the image plane are 0.5%/pixel and 0.1%/pixel, respectively. The rate of photodegradation of the paint is 0.5%/hour for a given excitation level and the exposure time of the paint is 60 seconds between the wind-off and wind-on images. The rate of reduction of the luminescent intensity due to dust/oil sedimentation on the surface is assumed to be 0.5%/hour.

In an object-space coordinate system whose origin is located at the leading edge of the airfoil, four light sources for illuminating PSP are placed at the locations Xs1 = (- c,3c), Xs2 = (2c,3c), Xs3 = (- c, – 3c), and X4 = (2c, – 3c),

Подпись: (q0 )up Xup - X s1 Подпись: 2 Pressure Uncertainty Analysis for Subsonic Airfoil Flows Подпись: 2 Pressure Uncertainty Analysis for Subsonic Airfoil Flows Подпись: 2 Pressure Uncertainty Analysis for Subsonic Airfoil Flows Подпись: 2

where c is the chord of the airfoil. For the light sources with unit strength, the illumination flux distributions on the upper and lower surfaces are, respectively,

where Xup and Xhw are the coordinates of the upper and lower surfaces of the

airfoil, respectively. The temporal variation of irradiance of these lights is assumed to be 1%/hour. It is also assumed that the spectral leakage of optical filters for the lights and cameras is 0.3%. Two cameras, viewing the upper surface and lower surface respectively, are located at (c/2,4c) and (c/2,-4c).

The pressure uncertainty associated with the photon shot noise can be estimated by using Eq. (7.5). Assume that the full-well capacity of (npe )max = 350,000

electrons of a CCD camera is utilized. The numbers of photoelectrons collected in a CCD camera are mainly proportional to the distribution of the illumination field on the model surface. Thus, the photoelectrons on the upper and lower surfaces

are estimated by ( npe )up = ( npe )max ( q0 )up / max[( q0 )up ] and (npe )low = (npe )mx (q0 )low / max[( q0 )ш ] . Combination of these estimates with

Eq. (7.5) gives the shot-noise-generated pressure uncertainty distributions on the surfaces.

Movement of the airfoil produced by aerodynamic loads is expressed by a superposition of a local rotation (twist) and translation. A transformation between the non-moved and moved surface coordinates X = (X, Y)T and X’ = (X’,Y’ )T is X’ = R( 0twist )X + T, where R(0twis,) is the rotation matrix, 0twist is the local wing twist, and T is the translation vector. Here, for 0twist = -1o and T = (0.001c, 0.01c )T, the uncertainty in q0(X)/q0ref(X’) is estimated by

var[q0(X )/q0ref(X’)] ~(q0ref )~21(Vq0)• (AX )|2, where the displacement vector is AX = X’ – X. The pressure variance associated with mapping PSP data onto a rigid body grid without correcting the model deformation is estimated by
var(p)=|( Vp)surf • (AX )mif , where (Vp)surf is the pressure gradient on the surface and (AX)surf = (X’ – X)surf is the component of the displacement vector projected on the surface.

To estimate the temperature effect of PSP, an adiabatic model is considered at which the wall temperature Taw is given by

TJT0 = [1 + r(Y-1)M2/2][1 + (y-1)M2/2] -1,

where the recovery factor is r = 0.843 for a laminar boundary layer. Assuming that the reference temperature Tref equals to the total temperature T0 = 293 K, we

can calculate a temperature difference AT = Taw – Tref between the wind-on and

wind-off cases. The adiabatic wall is the most severe case for PSP measurements since the surface temperature on a metallic model is much lower than the adiabatic wall temperature due to heat conduction to the model.

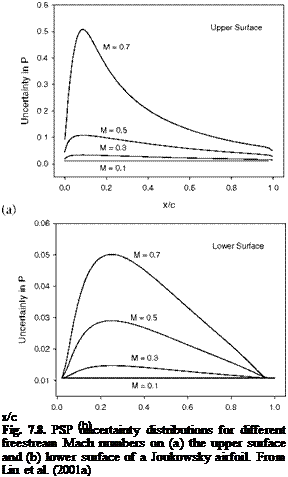
The total uncertainty in pressure is estimated by substituting all the estimated elemental errors into Eq. (7.3). Figure 7.8 shows the pressure uncertainty distributions on the upper and lower surfaces of the airfoil for different freestream Mach numbers. It is indicated that the temperature effect of PSP dominates the uncertainty of PSP measurements on an adiabatic wall. The uncertainty becomes larger and larger as the Mach number increases because the adiabatic wall temperature increases. The local pressure uncertainty on the upper surface is as high as 50% at one location for Mach 0.7, which is caused by a local surface temperature change of about 6oC.

In order to compare the PSP uncertainty with the pressure variation on the airfoil, a maximum relative pressure variation on the airfoil is defined as

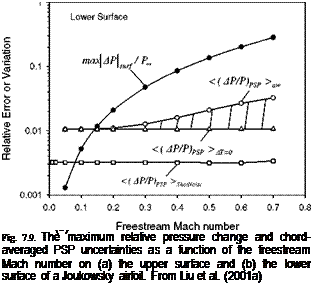
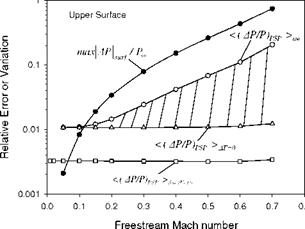
maxMSur/p™ = 0.5YMI ma^ACp. Figure 7.9 shows the maximum relative pressure variation max^psurf/p^ along with the chord-averaged PSP uncertainty < (Ap/p)PSP >aw on the adiabatic airfoil at the Mach numbers of 0.05­0.7. The uncertainty < (Ap/p)PSP >AT=0 without the temperature effect is also plotted in Fig. 7.10, which is mainly dominated by the a priori PSP calibration error AB/B = 1% in this case. The curves max|dpsurf/p™ , < (dp/p)PSP >aw and

< (Ap/p)PSP >AT=0 intersect near Mach 0.1. When the PSP uncertainty exceeds the maximum pressure variation on the airfoil, the pressure distribution on the airfoil cannot be quantitatively measured by PSP. As shown in Fig. 7.9, because a temperature change on a non-adiabatic wall is smaller, the PSP uncertainty for a real wind tunnel model generally falls into the shadowed region confined by

<(Ap/p)psp > aw and <(Ap/p)PSP > AT=0.

The PSP uncertainty associated with the photon shot noise

< (Ap/p)PSP >ShotNoise is also plotted in Fig. 7.9. The intersection between

max^pLrf/p™ and <(Ap/p)PSP >SholNoise gives the limiting low Mach number
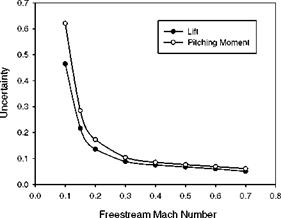
(~ 0.06 ) for PSP measurements in this case. The uncertainties in the lift (FL) and pitching moment (Mc) are also calculated from the PSP uncertainty distribution on the surface. Figure 7.10 shows the uncertainties in the lift and pitching moment relative to the leading edge for the Joukowsky airfoil over a range of the Mach numbers when the angle of attack is 4o. The uncertainties in the lift and moment decrease monotonously as the Mach number increases since the absolute values of the lift and moment rapidly increase with the Mach number.

Pressure Uncertainty Analysis for Subsonic Airfoil Flows

Pressure Uncertainty Analysis for Subsonic Airfoil Flows

(a)


Pressure Uncertainty Analysis for Subsonic Airfoil Flows

Pressure Uncertainty Analysis for Subsonic Airfoil Flows

Pressure Uncertainty Analysis for Subsonic Airfoil Flows

Fig. 7.10. Uncertainties in the lift and pitching moment of a Joukowsky airfoil as a function of the freestream Mach number. From Liu et al. (2001a)

Uncertainties of Integrated Forces and Moments

Uncertainties of Integrated Forces and Moments Подпись: 1/2 Подпись: (7.9)

The uncertainties of the integrated aerodynamic forces and moments can be estimated based on their definitions. For example, the uncertainty in the lift is

where n is the unit normal vector of a surface panel, AS is the area of the surface panel, and lL is the unit vector of the lift. The correlation between the pressure differences at the panel ‘i’ and panel ‘j’ is simply modeled by <ApiApj >= 8^ <Apt ><Apj >, where the Kronecker delta is Stj = 1 for

Подпись: JFL/FL Uncertainties of Integrated Forces and Moments Подпись: 1/2 Подпись: (7.10)

i = j and 8tj = 0 for i a j. Thus, the uncertainty in the lift can be estimated based on the PSP uncertainty at all the surface panels, i. e.,

Similarly, the uncertainties in the pressure-induced drag and pichting moment are estimated by

Allowable Upper Bounds of Elemental Errors

In the design of PSP experiments, we need to give the allowable upper bounds of the elemental errors for the required pressure accuracy. This is an optimization problem subject to certain constraints. In matrix notations, Eq. (7.3) is expressed as ap = aTA a, where the notations are defined as ap = var(p)/p2, Atj = St Sjptj, and ai = [var( ) ]1//2 /£7 . For required pressure uncertainty ap, we look for a vector aup to maximize an objective function H = WT a, where W is the weighting vector. The vector aup gives the upper bounds of the elemental errors for a given pressure uncertainty aP. The use of the Lagrange

multiplier method requires H = WT a + X (ap – aT A a) to be maximal, where Я is the Lagrange multiplier. The solution to this optimization problem gives the upper bounds

= A – JW

( wta -1 W )1/2 ^P. (.)

For the uncorrelated variables with ptj = 0 (i Ф j), Eq. (7.6) reduces to

Подпись: (°i)up = S-2Wt ap S( X-1/2

Подпись: (7.7)-2W2

V k 7

When the weighting factors Wi equal the absolute values of the sensitivity coefficients I St |, the upper bounds can be expressed in a very simple form

(°i)Up /*p = NP1/2S] -1, (i = 1,2,■■■ ,NV ) (7.8)

where NV is the total number of the variables or the elemental error sources. The relation Eq. (7.8) clearly indicates that the allowable upper bounds of the elemental uncertainties are inversely proportional to the sensitivity coefficients and the square root of the total number of the elemental error sources. Figure 7.6 shows a distribution of the upper bounds of 15 variables for PSP Bath Ruth + silica-gel in GE RTV 118 at p/pref = 0.8 and T = 293 K. Clearly, the

allowable upper bound for temperature is much lower than others, and therefore the temperature effct of PSP must be tightly controlled to achieve the required pressure accuracy.

Other Error Sources and Limitations

Other error sources include the self-illumination and induction effect; there are limitations in the time response and spatial resolution of PSP. The self­illumination is a phenomenon that the luminescent emission from one part of a model surface reflects to another surface, thus distorting the observed luminescent intensity at a point by superposing all the rays reflected from other points. It often occurs on surfaces of neighbor components of a complex model (Ruyten 1997a, 1997b, 2001a; Le Sant 2001b). The self-illumination effect on calculation of pressure and temperature are discussed in Section 5.3. Another problem is the ‘induction effect’ observed as an increase in the luminescent emission during the first few minutes of illumination for certain paints; the photochemical process behind it was explained by Uibel et al. (1993) and Gouterman (1997). In PSP measurements in unsteady flows, the limiting time response of PSP, which is
mainly determined by oxygen diffusion process across a PSP layer (see Chapter 8), imposes an additional restriction on the accuracy of PSP measurements. The spatial resolution of PSP is limited by oxygen diffusion in the lateral direction along a paint surface. Considering a pressure jump across a point on a surface (a normal shock wave), Mosharov et al (1997) gave a solution of the diffusion equation describing a distribution of the oxygen concentration in a PSP layer near the pressure jump point. According to this solution, the limiting spatial resolution is about five times of the paint layer thickness.

Paint Intrusiveness

A thin PSP coating may slightly modify the overall shape of a model and produces local surface roughness and topological patterns. These unwanted changes in model geometry may alter flows over a model and affect the integrated aerodynamic forces (Engler et al. 1991; Sellers 1998a). Hence, this paint intrusiveness to flow should be considered as an error source in PSP measurements. The effects of a paint coating on pressure and skin friction are directly associated with locally changed flow structures and propagation of the induced perturbations in flow; these local effects may collectively alter the integrated aerodynamic forces. When a local paint thickness variation is much smaller than the boundary layer displacement thickness, a thin coating does not alter the inviscid outer flow. Instead of directly altering the outer flow, a rough coating may indirectly result in a local pressure change by thickening the boundary layer; coating roughness may reduce the momentum of the boundary layer to cause early flow separation at certain positions. Therefore, the effective aerodynamic shape of a model is changed and as a result the pressure distribution on the model is modified; this effect is mostly appreciable near the trailing edge due to the substantial development of the boundary layer on the surface. Vanhoutte et al. (2000) observed an increment in the trailing edge pressure coefficient relative to the unpainted model, which was consistent with an increase in the boundary layer thickness at the trailing edge. For certain models such as high-lift models, a coating may change the gap between the main wing and slat or flap when the gap is small; thus, the pressure distribution on the model is locally influenced. In addition, a coating may influence laminar separation bubbles near the leading edge at low Reynolds numbers and high angles-of-attack. The perturbations induced by a rough coating near the leading edge may enhance mixing that entrains the high-momentum fluid from the outer flow into the separated region. The perturbations could be amplified by several hydrodynamic instability mechanisms such as the Kelvin-Helmholtz instability in the shear layer between the outer flow and separated region and the cross-flow instability near the attachment line on a swept wing. Consequently, the coating causes the laminar separation bubbles to be suppressed. Vanhoutte et al. (2000) reported this effect that led to a reduction in drag.

Schairer et al. (1998a, 2002) observed that a rough coating on the slats slightly decreased the stall angle of a high-lift wing. Also, they found that the empirical criteria for ‘hydraulic smoothness’ and ‘admissible roughness’ based on 2D data by Schichting (1979) were not sufficient to provide a satisfactory explanation for their observation. Indeed, in 3D complex flows on the high-lift model, the effect of the coating on the cross-flow instability and its interactions with the boundary layer and other shear layers such wakes and jets are not well understood. Schairer et al. (1998a, 2002) and Mebarki et al. (1999) found that a rough coating moved a shock wave upstream and the pressure distribution was shifted near the shock location. This change might be caused by an interaction between the shock and the incoming boundary layer affected by the coating. In an attached flow at high Reynolds numbers, a rough coating increases skin friction by triggering premature laminar-turbulent transition and increasing the turbulent intensity in a turbulent boundary layer (Mebarki et al. 1999; Vanhoutte et al. 2000). An increase in drag due to a rough coating was observed in airfoil tests in high subsonic flows (Vanhoutte et al. 2000). In fact, premature transition by coating roughness has been often observed in TSP transition detection experiments (see Chapter 10). Amer et al. (2001, 2003) reported that a very smooth coating on the upper surface of a delta wing model at Mach 0.2 and a semi-span arrow-wing model at Mach 2.4 did not significantly change the drag coefficients of these models. Generally speaking, the effect of a coating on aerodynamic forces highly depends on flows over a specific model configuration; there is no universal conclusion on this effect.

Spectral Variability and Filter Leakage

The uncertainty in Пf/nfref is mainly attributed to the spectral variability of

illumination lights and spectral leaking of optical filters. Possolo and Maier (1998) observed the spectral variability between flashes of a xenon lamp; the uncertainties in the absolute pressure and pressure coefficient due to the flash spectral variability were 0.05 psi and 0.01, respectively. If optical filters are not selected appropriately, a small portion of photons from the excitation light and ambient light may reach a detector through the filters, producing an additional output to the luminescent signal.

7.1.3. Pressure Mapping Errors

The uncertainty in pressure mapping is related to the data reduction procedure in which PSP data in images are mapped onto a surface grid of a model in the object space. It is contributed from the errors in camera resection/calibration and mapping onto a surface grid of a presumed rigid body. The camera resection/calibration error is represented by the standard deviations ax and a y of the calculated target coordinates from the measured target coordinates in the image plane. Typically, a good camera resection/calibration method gives the standard deviation of about 0.04 pixels in the image plane. For a given PSP image, the pressure variance induced by the camera resection/calibration error is

var(p) ~ (dp/дx) aУ + (p/дy) a2y.

The pressure mapping onto a presumably non-deformed model surface grid leads to another deformation-related error because a model may undergo a considerable deformation generated by aerodynamic loads in wind tunnel tests. When a point on a model surface moves by AX = X’ – X in the object space, the pressure variance induced by mapping onto a presumed rigid body grid without

correcting the model deformation is var(p) = | (Vp )surf • (AX )f, where (Vp )surf is the pressure gradient on the surface and (AX )sulf is the component of the

displacement vector AX projected on the surface in the object space. To eliminate this error, a deformed surface grid should be generated for PSP mapping based on optical model deformation measurements under the same testing conditions (Liu et al. 1999).

Calibration Errors

The uncertainties in determining the Stern-Volmer coefficients A(T) and B(T) are calibration errors. In a priori PSP calibration in a pressure chamber, the uncertainty is represented by the standard deviation of data collected in replication tests. Because tests in a pressure chamber are well controlled, a priori calibration results usually show a small precision error. However, a significant bias error is found when a priori calibration results are directly used for data reduction in wind tunnel tests due to unknown surface temperature distribution and uncontrollable testing environmental factors. In contrast, in-situ calibration utilizes pressure tap data over a model surface to determine the Stern-Volmer coefficients. Because in-situ calibration correlates the local luminescent intensity with the pressure tap data, it can reduce the bias errors associated with the temperature effect and other sources, achieving a better agreement with the pressure tap data. The in-situ calibration uncertainty, which is usually represented as a fitting error, will be specially discussed in Section 7.3.

7.1.2. Temporal Variations in Luminescence and Illumination

For PSP measurements in steady flows, a temporal change in the luminescent intensity mainly results from photodegradation and sedimentation of dusts and oil droplets on a model surface. The photodegradation of PSP may occur when there is a considerable exposure of PSP to the strong excitation light between the wind- off and wind-on measurements. Dusts and oil droplets in air sediment on a model surface during wind-tunnel runs; the resulting dust/oil layer absorbs both the excitation light and luminescent emission on the surface and thus causes a decrease of the luminescent intensity. The uncertainty in Dt(At) due to the photodegradation and sedimentation can be collectively characterized by the variance var[Dt(At)] ~ [(dV/dt)(At)/V]2. Similarly, the uncertainty in

Dq0(At), which is produced by an unstable excitation light source, is described by var[Dq0(At)] « [(dqo /dt)(At)/qonf ]2.

Temperature Effect

Since the luminescent intensity of PSP is intrinsically temperature-dependent, a temperature change on a model during a wind tunnel run results in a significant bias error in PSP measurements if the temperature effect is not corrected. In addition, temperature influences the total uncertainty of PSP measurements through the sensitivity coefficients of the variables in the error propagation equation. Hence, the surface temperature on a model must be known in order to correct the temperature effect of PSP. In general, the surface temperature distribution can be measured experimentally using TSP or IR camera and determined numerically by solving the motion and energy equations of flows coupled with the heat conduction equation for a model. For a compressible boundary layer on an adiabatic wall, the adiabatic wall temperature Taw can be estimated using a simple relation

TaJT0 = [1 + r( y – 1)M2 /2][1 + (y-1)M2/2]-1, where r is the recovery factor for the boundary layer, T0 is the total temperature, M is the local Mach number, and у is the specific heat ratio.