Category Principles of Helicopter Aerodynamics Second Edition

Rigid or Undistorted Wake

The rigid or undistorted vortex wake model is one in which the trailed vortices are represented by skewed helical filaments. The position of the vortex filaments is defined geometrically based on the flight conditions and momentum theory considerations. There are no self – or mutual-interactions, between vortex filaments. If we assume that the induced
velocity field in the wake is uniform (i. e., the induced velocity does not vary with time or location), then an exact analytical solution may be obtained for Eq. 10.53 as a special case. Making this assumption is equivalent to assuming a uniform streamwise velocity and a mean inflow, A; = constant throughout the flow, that is

Подпись: (10.68)V = QRfii + QR(X[)k.

Under these assumptions, the PDE governing the wake geometry relative to the TPP (see Eq. 10.50) can be written as

Rigid or Undistorted Wake(10.69)

where іf/w is the wake age and fb is the azimuth angle of the blade at which the vortex filament was generated, also recognizing that the position vector r has now been nondimensionalized by R. Equation 10.69 is a linear, first-order, hyperbolic, PDE. The two required boundary conditions in the fb and directions are given by

Подпись: (10.70) (10.71) fb-r(fb, fw) = Hfb + 2л-, fw), fw’ r(fb, 0) = rv cos fbi + rv sin fbh

where rv is the radial release point of the trailed vortex filament from the blade (rv — 1 at the tip). The analytical solution to Eq. 10.69 can be obtained using separation of variables – see Hildebrand (1976). The solution of the PDE is defined by the characteristic curve of the equation, which can be determined from the intersection of the two surfaces found by integrating the following ODEs:

From Eqs. 10.72 and 10.73, the two surfaces are given by fb = fw + c and r = Vfw/ QR + C2, respectively, where c and c2 are constants of integration. From these solutions, ci — fb — fw and C2 = r — Vfw/Q. The intersection of the two surfaces results in an equation relating the two constants such that C2 = f{c) =» r — Vfw/QR = f(fb — fw)- Invoking the boundary condition at (rw — 0 results in r = rv cos xf/b і + rv sin xj/b j, and so the exact solution can be written as

r{fb, fw) = (ttfw + rv cos (fb – fw)) * + rv sin (ifrb – fw) ] + A ifw k. (10.74)

Подпись: = *tip = cos(fb - fw) + flfw, = y'tip = sin(fb - fw), ~ = z'tip = ^ifw = -lifw tan XTPP- Rigid or Undistorted Wake

Notice that the periodic boundary condition in the yrb direction is also satisfied because cos(27r + j/b) = cos fb and sinfln + фь) = sin^- Equation 10.74 defines a skewed, undistorted helix, which is known as the rigid or undistorted vortex wake topology, which has already been introduced. If only tip vortices are assumed (rv = 1), then the solution for the tip-vortex geometry relative to the rotor TPP can be described by the simple parametric equations

Rigid or Undistorted Wake Подпись: (10.79)
Подпись: (10.78)

where using the simple momentum theory in forward flight

and where к is an induced power factor. Notice that there is no contraction assumed in the rigid vortex wake. However, if it is found necessary to model this effect, the tip vortices can be assumed to originate at a point just inboard of the tip, say rv = 0.97. Also, note that with the rigid wake equations, as p 0 the wake geometry reduces to a helix, but as has been described previously, this is an unsatisfactory model of the wake in hover.

A rigid wake geometry is plotted in Fig. 10.33 for forward flight at д = 0.15 and is compared to predictions made by a FVM (see Section 10.7.6). Notice that the predictions are substantially different. Nevertheless, the simplicity of the rigid wake model will give the primary effects of the skewness of the wake on the inflow distribution over the rotor disk and may be attractive for applications where the full details of the rotor wake are not required, such as for integrated rotor performance predictions. (See also the results of the rotor wake boundary shown previously in Fig. 10.10).

Prescribed Vortex Wake Models for Forward Flight Vortex Ring Model

One simple way to approximate the trailed wake vorticity from the rotor is to used a series of stacked vortex rings or a vortex tube – see Coleman et al. (1945), Castles & De Leeuw (1954), and Young (1974). The advantage of using vortex rings is that an exact (analytic) solution for the induced velocity can be obtained. In the vortex ring (tube) model, one ring represents the trailed wake system generated by one blade during one rotor revolution. The positioning of the rings is defined on the basis of simple momentum theory.

Prescribed Vortex Wake Models for Forward Flight Vortex Ring Model

The induced velocity from one disingularized vortex ring of strength

Подпись: (10.67)R(R — r cos в) dO

(R2 — 2Rr cos 0 + z2 + r2)3/2

[see, for example, Lewis (1991)]. This equation can be integrated analytically using elliptic integrals of the first and second type. Alternatively, it can be integrated using Gaussian quadrature (see Question 10.1). Notice that for points not on the vortex segment itself, the cut-off distance, 80, equals zero. However, for points on the ring vortex a logarithmic singularity occurs, and so 80 must be nonzero. Although the value of 80 can be approximated in terms of the vortex core radius and an exponential function of the kinetic energy in the vortex core [see Widnall (1972)] in a practical sense a cut-off distance of 80 ~ 10 ~4 can be assumed without substantial error.

From this basic result for one ring, the net induced velocity at any point in the flow field can be obtained by summing the effects of all the rings representing the wake. It has been found from the vortex ring (tube) model that the longitudinal distribution of inflow in the rotor TPP is approximately linear, which is in good agreement with experiments – see Coleman et ai. (1945). Also, it has been found that the longitudinal coefficient kx m the linear inflow model can be approximated using kx = tan(x/2), which is a result discussed previously in Section 3.5.2.

Kocurek & Tangier’s Prescribed Wake Model

Kocurek & Tangier (1976) have derived a prescribed wake model similar to that of Landgrebe using the same set of generalized equations for the tip vortex trajectories, but with different coefficients based on another series of subscale rotor experiments. This model attempts to include the number of blades as well as the blade lift distribution (through the twist rate) in the modeling of the axial settling rates. The generalized equation for k is

*, = в + C (JzQ, (10.65)

where В — —0.0007296>tw and C = — 2.3O2O60tw. The other coefficients are: m = 1.0 — 0.25е°’О4О&м and n = 0.5 — O. O1720tw. The equation for k2 is

k2 = -(CT ~ CTo)1/2, where CTo = bn(-B/C)l/m. (Ю.66)

The radial contraction rate parameter X is given by X = 4.0*/Ct, with A = 0.78, as in Landgrebe’s model. No inner vortex sheet is used in the Kocurek & Tangier model.

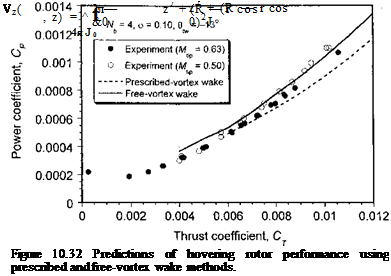
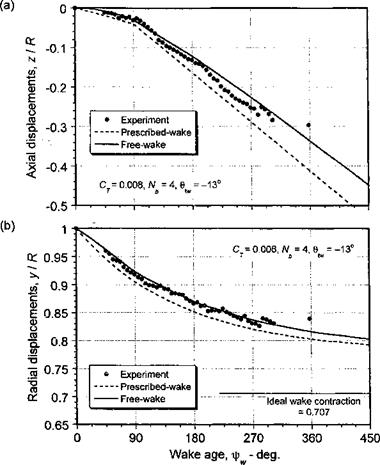
An example showing the expected quality of the predicted wake geometry and hover performance that can be made using a prescribed wake model is shown in Figs. 10.31 and 10.32. It is found that in this case the prescribed wake tends to slightly overpredict both the axial displacements and the radial contraction of the tip vortices. Results from a FVM are

Kocurek & Tangier’s Prescribed Wake Model

Figure 10.31 Comparison of prescribed and free-vortex wake methods with experimental measurements of the tip vortex locations in hover, (a) Axial displacements, (b) Radial displacements. Four-bladed rotor; Ct = 0.008.

also shown in Fig. 10.31 and 10.32. Notice that the FVM gives slightly better predictions of both the wake geometry and the hovering performance of the rotor albeit at a greater computational expense.

Prescribed Wake Models for Hovering Flight

For hovering flight, generalized prescribed vortex wake models have been devel­oped to enable predictions of the inflow through the disk, but without the expense and uncertainties associated with explicitly calculating the force-free positions of the wake. These models prescribe the locations of the rotor tip vortices (and sometimes also the in­ner vortex sheet) as functions of wake age bw on the basis of experimental observations. For hovering flight, generalized prescribed vortex wake models have been developed by Landgrebe (1969, 1971, 1972), Gilmore & Gartshore (1972), Kocureck & Tangier (1976), and Kocureck & Berkowitz (1982).

Landgrebe’s Prescribed Wake Model

Подпись: .Landgrebe (1971, 1972) studied experimentally about seventy subscale helicopter rotor configurations with different combinations of number of blades, rotor solidity, blade

twist, and blade aspect ratio. On the basis of these experiments, Landgrebe’s model describes the tip vortex geometry by the equations

Подпись:(10.56)

and

Подпись: (10.57)— = A + (T — Alexnf—

R ‘ r ‘

Notice that the vertical displacements are linear with respect to wake age (i. e., they convect axially at a constant velocity), which is consistent with all experiments. At the first blade passage when fu, = 2Tt/Nb, it has been shown previously in Fig. 10.6 that there is a sudden change in the axial convection velocity. This is reflected in the change of the coefficient from k to k2 in the equations describing the axial displacements. The axial settling rates are modeled by the empirical equations

Подпись: (10.58) (10.59) *, = -0.25(Cr/a +0.0016>tw),

k2 = -(1.41 + О. О1410№)УСг/2 « -(1 + O. O10tw)/CV,

Prescribed Wake Models for Hovering Flight

where the blade twist 0tw is measured in units of degrees. The radial contraction of the wake is smooth and asymptotic. The empirically derived coefficients for the radial contraction are given by A = 0.78 and Л = 0.145 + 21 Cj. Notice that while the theoretical contraction ratio of a rotor wake in hover is 0.707 (see results in Section 2.2.3), in practice the contraction ratio is found experimentally to be consistently closer to 0.78. The vortex sheet trailed by the inner parts of the blade vary linearly with r. The outer end of the sheet (r = 1) is represented by the equations

whereas the inner end of the sheet is represented by

Подпись: 0Подпись: forO < ifw < 2n/Nb,Prescribed Wake Models for Hovering Flight(10.61)

The locations of intermediate parts of the sheet are determined by linear interpolation. The empirical coefficients of the sheet coordinates are described by

Подпись:Ku=i = —2.2л/Ст/2,

Подпись:(10.63)

(10.64)

Prescribed Wake Models for Hovering Flight

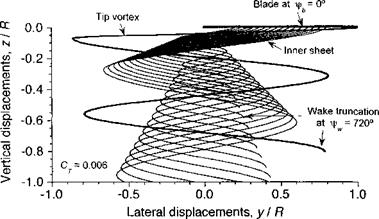
Figure 10.30 Representative prescribed hovering wake based on Landgrebe’s model. Nh = 2; СУ = 0.006; 0tw = 0°.

A representative wake geometry in hovering flight based on Landgrebe’s model is shown in Fig. 10.30. The wake for two revolutions of the rotor are shown to convey the relative differences in the convection rates of the sheet versus that of the tip vortex. Notice that the outer edge of the inner sheet convects axially downward at a rate that is approximately twice that of the tip vortex, a result alluded to previously in Section 10.3.2. In the hover state, it is found that the inclusion of the vortex sheet is usually necessary to enable good predictions of induced inflow and rotor performance.

Biot-Savart Law

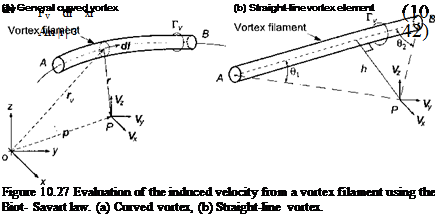
Fundamental to all vortex models is the requirement to compute the induced ve­locity at a point contributed by a vortex filament in the rotor wake. This can be calculated through the application of the Biot-Savart law – see Batchelor (1967). The incremental values of induced velocity, dv, at any point P a distance r from the segment dl of a vortex

Biot-Savart Law

filament of strength Г„ can be written in general form as

Подпись: V, V> Vz Biot-Savart Law Подпись: ex ey Подпись: (10.43)

which is shown schematically in Fig. 10.27. The total velocity at point P is then obtained by integration along the lengths of the vortex filaments. In application, curved wake filaments would normally be discretized into a number of collocation points that are connected by straight-line vortex segments because the velocity induced by a straight-line vortex segment is then readily integrable. The velocity at a point P induced by a single, straight-line vortex element extending from one point A to another point В [see Fig. 10.27(b)] can be expressed in the form

Biot-Savart Law

whereBiot-Savart Law

Biot-Savart Law Biot-Savart Law

Vortex Segmentation

To help reduce the number of numerical operations associated with vortex meth­ods, the complexity of the real rotor wake can be reduced into various simplified forms. A common approximation is to treat only the trailed vortex filaments, that is, the filaments that are initially trailed perpendicular to the blade span (see Fig. 8.3). These contributions to the vorticity field arise because of the spanwise gradients in the distribution of circulation load­ing on the blades. The time-dependent aerodynamic loading results in shed wake vorticity, and to save tracking all the shed elements in the wake this effect can be approximated by means of one of the unsteady aerodynamic models considered in Chapter 8. Even with the trailed wake system alone, the problem of calculating the induced velocity field is still one of high numerical cost. However, experiments have shown the dominant structures in the rotor wake to be the tip vortices, and so a common level of modeling approximation is to consider just these tip vortices alone. Correlation studies with experimental measurements of the rotor inflow and blade loads have shown that this is a good level of approximation and does not sacrifice much physical accuracy in the problem, especially in forward flight, for a substantial reduction in computational effort.

For some vortex wake schemes, the discretization into straight-line vortex segments can result in round-off errors that may be a source of numerical problems, especially if the segments are relatively large. However, the overall errors associated with this form of discretization are usually small because the radius of curvature of the rotor wake is generally large, except perhaps in the roll-up regions at the lateral edges of the wake. Yet it is still important to formally determine the accuracy of this approach to modeling the vortex wake and to establish thresholds of discretization that will provide good accuracy for the induced velocity field while still containing computational costs.

The discretization of curved vortex filaments into straight lines will result in an induced velocity calculation that is, at best, second-order accurate, a problem examined in detail by Bhagwat & Leishman (2001b) and Gupta & Leishman (2004). This result can be seen from Fig. 10.28, which shows a plot of the L2-norm (rms) of the error in the reconstruction of the induced velocity using straight-line segmentation for a vortex ring, a singly-infinite helix with a helical pitch p and a skewed helix with a skew angle f. The induced velocity for a vortex ring was calculated using the exact solution (see Section 10.7.5) and the solution for the finest numerical discretization is comparable up to seven decimal places. The error in the induced velocity for the helical vortex was calculated with respect to the finest discretization because there is no exact solution for the induced velocity from a helix. It is apparent that the order of accuracy of the reconstructed velocity field does not depend on the helical pitch and both the skewed and unskewed helix follow the quadratic trend for A0 < 2.5°, indicating second-order accuracy. This gives high confidence in the straight-line segmentation approach for the general modeling of helicopter rotor wakes.

1

Подпись:Подпись:Подпись: 2:1 slope = 2nd-order accuracyПодпись: Vortex ring (exact solution) Vortex ring (finest discretization) Helix, p = б.І Helix, p = 1.0Подпись:Biot-Savart Law0.1

Подпись: 0.01 0.001 E о 0.0001

10le 10’7 10’8

0.01 0.1 1 10 " 100
Angular discretization, Дір (deg.)

Figure 10.28 L2-norm for the relative error in the induced axial velocity in the z = 0 plane of a vortex ring, unskewed and skewed helical vortex (skew angle /3 = 30°) with helical pitch p = 0.1.

10.7.1 Governing Equations for the Convecting Vortex Wake

A description of the vorticity field in the rotor wake is governed by the 3-D, incompressible Navier-Stokes equations, which in a Lagrangian form can be written as

~ = (a) • V)V + . (10.49)

strain diffusion

This equation defines the change of vorticity of a fluid element moving with the flow in terms of the instantaneous value of vorticity, со, and the local velocity field V. The term on the left-hand side of Eq. 10.49 represents advection (convection), with the two terms on the right-hand side being a strain or “stretching” term and viscous diffusion term, respectively. In many practical problems, it can be justified that viscous phenomena will be confined to much smaller length scales compared to potential flow phenomena. Therefore, vortex methods use discrete line vortices to represent concentrated lines of vorticity. Under these conditions, Helmholtz’s second law states that the vortex lines move as material lines at the local velocity, V)OC. In the discretized problem, this convection criteria is applied to all of the collocation points that have been specified along the lengths of all the vortex lines (see Fig. 10.27 previously). If we consider a single element of a trailed vortex filament, the fundamental equation describing the transport of a point on the filament is

= Vioc(r, t), r(t = 0) = r0, (10.50)

dt

where r = r(t) = r(xfrw, xfb) is the position vector of a point on the filament at a time (or wake age ij/w) that was trailed from the blade when it was at an azimuth angle xj/b – The term? o is simply an initial condition. This equation is the fundamental equation for the free-vortex wake method or the free-vortex method (FVM). (See Section 14.4 for the fundamental principles behind the derivation of Eq. 10.50.)

Because the wake position vector r is both a function of fb and fw then the derivative on the left-hand side of Eq. 10.50 can be expanded to give

Подпись:Подпись: (10.52)dr(fb, fw) _ dr / dfw Jkr^ / dfb

dt dfw dt J dfb V dt

This equation can be simplified by noting that the time derivatives are

dfw _ dfb _ й dt dt

Therefore, in blade fixed coordinates the fundamental equation describing the position vector of the vortex filament is

Подпись: (10.53)dr

dfw

This is a first-order, quasi-linear, hyperbolic, partial differential equation (PDE). The homo­geneous portion of the equation (the left-hand side) is the linear wave equation. However, the right-hand side is, in general, a nonlinear function mainly because of the induced ef­fects resulting from the complete wake geometry. By assuming that every vortex filament is convected through the flow field at the local velocity, a PDE governing the geometry of a single element of the vortex filament can be written as

Подпись: dr(fb, fw) dr(fb, fw) dfb dfw ” + ^ ^indl?(fb, fw), Hfj, fw)].

j=1

(10.54)

Notice that the summation is carried out over the total number of trailed vortex filaments, Nv, that contribute to the induced velocity field at any given point. For tip vortices alone then Nv = Nb.

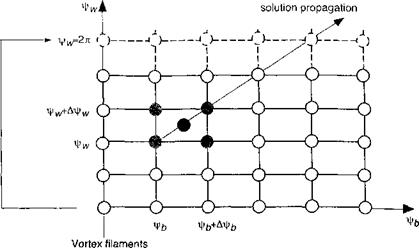
To solve Eq. 10.54 using a numerical scheme, it must be spatially and temporally dis­cretized. This results in a set of simultaneous ODEs. A computational domain can be defined as a discretized grid in time (fb) and space (fw), as shown in Fig. 10.29. Based on such discretizations, the partial differentials in the governing PDE can be approxi­mated using several different types of finite-difference schemes. For example, Crouse & Leishman (1993) have used a “three-point central difference” approximation of the left – hand-side derivatives of Eq. 10.54 about point (fb — Afb/2, fw — Afw/2) using points (‘fb — Afb, fw — Afw) and (i, к), as shown in Fig. 10.29. Bagai & Leishman (1995a, b; 1996) have used a “five-point central difference” scheme, where the derivatives were eval­uated at the point (fb — Afb/2, fw — Afw/2) about points {fb, fwX (fb — Afb, k), (i, fw — Afw) and (fb — Afb, fw — A fw) in the discretized computational domain, as also shown in Fig. 10.29.

The induced velocity, Vin(j, in Eq. 10.54 can be determined using the Biot-Savart law (Eq. 10.27) with

л r-Vf,. v-v, , ч1 1 f Tvdfwj x (r(fb, fw)-r(fj, fw))

Vind [r(fb, fw), r(fj, fw)J = — / ——— pr-.—- ——– zq—– -—r3—— ,

4?r J I r(fb, fw) – r(fj, fw) I3

(10.55)

where r(fb, fw) is the point in the flow field influenced by the yth vortex at location r(fj, fw) that has strength Г», The geometry of each element of a discretized vortex

Biot-Savart Law

Enforcement of periodicity in a

relaxation

scheme

Direction of

attached to blades

at г|)£=0

Figure 10.29 Discretized computational domain for the free-vortex wake problem.

filament is governed by one of these equations, and the velocity term on the right-hand side couples the equations together. This means that the equations for all of the filaments must be solved simultaneously, and this is a primary expense of the FVM.

Notice that the singular nature of the Biot-Savart law can be avoided by replacing the induced velocity field of the individual vortices with a model with a desingularized core, as discussed previously. Remember that this may also include a core growth (vorticity diffusion) model. The results for the wake geometry and induced velocity field thus obtained are probably qualitatively accurate no matter what vortex model is used. Yet, the quantitative errors associated with the wake model can only be determined though correlation studies with experiments documenting both the wake geometry and the induced velocity field, and caution should always be employed.

Vortex Models of the Rotor Wake

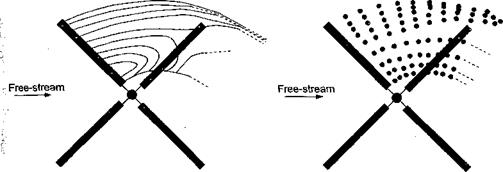
In vortex wake models, the convection of the tip vortices (and other concentrated vorticity) is explicitly tracked through the flow field relative to the rotor. Vortex diffusion and convection are, however, treated as separate steps. The underlying principle is that of Helmholtz’s law [see Lamb (1932) or Saffman (1992)], which embodies the principle of vorticity transport. Typically, the vortical wake is modeled by vortex lines[40] that are dis­cretized into the form of a regular lattice with straight elements [see Clark & Leiper (1970), Sadler (1971a, b), and Scully (1975)] or continuous curved vortex lines [see Quackenbush et al. (1988) and Wachspress et al. (2003)] or vortex “blobs” [see Lee & Na (1995, 1998)]. Schematics of these representations are shown in Fig. 10.26, where the wake from only one blade is shown for clarity. For most applications, the vortex wake model will be coupled to either a lifting-line or lifting-surface representation of the rotor blades (see Section 14.9). This defines the initial strengths and locations of the wake vortices relative to the rotor and forms boundary conditions for the remainder of the “far” vortex wake.

The main advantage of vortex methods, whether the approach be comprised of straight line vortex filaments, curved filaments, or vortex blobs, is that once the positions and strengths of the wake vorticity are obtained, then the induced velocity field at the rotor (or elsewhere, as required) can be computed by the use of the Biot-Savart law, followed by numerical integration over all of the filaments. The process lends itself readily to the computer. However, the main disadvantage of vortex methods is one of relatively high computational expense because many vortex elements are required to represent the wake of a helicopter rotor. While the evaluation of the Biot-Savart integral is trivial for a single vortex element, it is the very large number of elements required to model the entire rotor wake that determines the expense because a typical vortex filament may be discretized into several hundred or thousands of individual segments. For some applications in rotor analyses, it is the relatively high cost of vortex methods that limits their routine use. These methods are, however, still many orders of magnitude less expensive than finite-difference solutions based on the Euler or Navier-Stokes equations; see McCroskey (1995) and Section 14.2.1.

The principal differences among all of the various discretized vortex wake models that have been developed for helicopter applications are the assumptions and methods employed for the solution of the equations used to describe the transport of the wake vorticity. In prescribed vortex-wake models, the difficulties inherent in trying to explicitly solve these equations directly are avoided by either specifying the locations of the wake filaments a prion or by assuming an approximate velocity field near the rotor. Usually with the latter method, a simple velocity field (such as uniform or linear) can be prescribed that allows an analytical solution for the wake geometry. Alternatively, when specifying the wake geometry directly,

(a) Traditional vortex lattice model with straight-line (b) Modified vortex lattice model with straight-

elements representing trailed and shed circulation line segements and roll-up of tip vortex

Vortex Models of the Rotor Wake

(c) Constant strength vorticity segments (d) Vortex ‘blob’ representation of

representing trailed and shed circulation trailed and shed circulation

Vortex Models of the Rotor Wake

Figure 10.26 Representation of the vortex wake trailed behind a rotor blade. Notice: The wake from only one blade is shown for clarity, (a) Straight-line filaments, (b) Straight filaments with a prescribed roll-up model, (c) Constant vorticity curved vortex filaments, (d) Vortex blobs.

approximate functional relations can be derived from a combination of momentum theory and flow visualization experiments. In so-called “free” vortex wake methods, the solution for the wake is obtained from first principles. This form of solution recognizes that because parts of the vortices in the wake may interact with themselves (a self-induced effect) or with other vortices (a mutually induced effect) or with the blades themselves (BVI) the overall behavior of the wake cannot easily be generalized or prescribed in functional form and a numerical solutions must be sought. The development of numerical methods for this problem is considered in Section 10.7.6.

Flow Rotation Effects on Turbulence Inside Vortices

The forgoing analysis presents a somewhat oversimplified model of the charac­teristics of blade tip vortices, although these models are still found to give good average approximations to their behavior. When taken to a deeper level, however, the structure of the tip vortices is known to have regions of both laminar and turbulent flow separated by a re­gion of transitional flow. Such concepts of the vortex structure stem from early experimental observations made by Hoffman & Joubert (1963) and Tung et al. (1983).

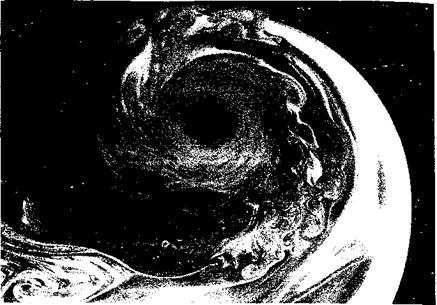
For example, flow visualization performed on a tip vortex emanating from a rotating blade is shown in Fig. 10.24. It can be seen that the flow is predominantly laminar near the core region, which is marked by a region of smooth flow where there are no interactions between adjacent fluid layers. This is followed by a transitional region that has eddies of different sizes. Outside of this there is a more highly turbulent region – see also Fig. 10.4. This multi-region vortex structure concept differs from the descriptions assumed by the previously mentioned mathematical models in that it is neither completely laminar like

Flow Rotation Effects on Turbulence Inside Vortices

Figure 10.24 A representative smoke flow visualization image of a tip vortex emanating from a rotor blade showing three distinct regions: (1) Laminar region, (2) Transitional region, and (3) Turbulent region. Source: University of Maryland.

the Lamb-Oseen model nor completely turbulent like Squire’s or Iversen’s model. Recent high-resolution velocity measurements made using LDV [see Martin et al. (2001), Martin & Leishman (2002), and Ramasamy & Leishman (2003)] also continue to support the idea of a multi-region laminar and turbulent structure of the tip vortex.

The extent of these three regions of the vortex are affected by the vortex Reynolds number, Rev. In particular, the effects of flow rotation on the development of turbulence present inside the vortex has been hypothesized to play an important role in determining the structure of a vortex – see Hoffman & Joubert (1963), Cotel & Breidenthal (1999), and Holzapfel et al. (2001). Rayleigh’s centrifugal instability theory [see Rayleigh (1880)], which uses a buoyancy force concept, suggests that the vortex will never develop turbulence provided that the product of velocity and radial distance increases with the increase in radial coordinate. Only a few vortex models [e. g., Donaldson (1971) and Baldwin et al. (1973)] have been developed that recognize this concept. However, the various properties of the vortex flow predicted using these models, such as the core growth and the velocity profiles, did not correlate well with experimental results available at that time.

Bradshaw (1983) developed an analogy between rotating flows and stratified fluids. His analysis is based on the theory that flow rotation causes the higher speed fluid to prefer the outside of the vortex while conserving angular momentum, even if the density is assumed constant throughout the vortex. Using energy principles, an expression was developed for the local strength of the analogous stratification expressed as an equivalent gradient Richardson number, Ri. This number comes directly from the turbulent kinetic energy budget equation [see Bradshaw (1983) and Holzapfel et al. (2001)] and is basically a ratio of the turbulence produced or consumed inside the vortex as a result of buoyancy (centrifugal effects) to the turbulence produced by shearing in the flow. It can also be thought of as the ratio of potential to kinetic energy in a stratified flow.

Подпись: (2V0 B(V9r) v Г2 Подпись: B(Ve/r) V 3r ) Подпись: (10.41)

Bradshaw’s Richardson number involves the evaluation of the swirl velocity gradients in the vortex flow. Holzapfel et al. (2001) corrected Bradshaw’s original definition, for which the revised expression is given by

Cotel & Breidenthal (1999) and Cotel (2002) used this stratification concept and have de­termined a threshold value for the Richardson number that is a function of vortex Reynolds number. This analysis is based on a nondimensional parameter called a “persistence pa­rameter,” which is defined as the ratio of rotational to translational (convection) speed of the vortex. If the persistence parameter is high, which is the case for most helicopter rotor wakes, the threshold value of the Richardson number was determined experimentally to be ReT. This means that the tip vortex will be laminar up to a radial distance where the local gradient Richardson number falls below this threshold value. Any turbulence present inside this boundary will be either relaminarized or suppressed; even substantial eddies will not be able to penetrate this vortex boundary.

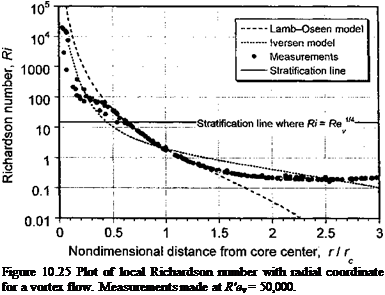
The local gradient Richardson number has been calculated using the measurements from Ramasamy & Leishman (2003) and is shown in Fig. 10.25, along with the Lamb-Oseen and Iversen vortex models. The local Richardson number variation for both the vortex models (and the measurements) is seen to approach infinity at the center of the vortex. As the radial distance from the center of the vortex increases, the Richardson number quickly reduces in value and falls below the assumed stratification threshold (i. e., for values of Ri above the stratification threshold only laminar flow is possible). In this region, diffusion at a molecular level will be the only means to transport the momentum contained in the vortex flow.

Подпись: Figure 10.25 Plot of local Richardson number with radial coordinate for a vortex flow. Measurements made at R'ev = 50,000.

This concept helps explain the persistence of lift generated tip vortices, in general, to relatively old wake ages. When Ri is below the stratification threshold, flow turbulence can develop. This argument serves to augment the hypothesis of a multi-region vortex where

the flow is always laminar well inside the core region, the flow which then progressively transitions to turbulence through and outside the tip vortex core. This mechanism certainly affects the induced velocity field, especially closer to its axis, and the effects of flow turbu­lence must be considered carefully if higher fidelity vortex models are to be developed for helicopter rotor applications. Such models must delineate the effects of vortex Reynolds number so that the models can be applied to a wide range of rotor scales and operating conditions.

Correlation of Rotor Tip Vortex Data

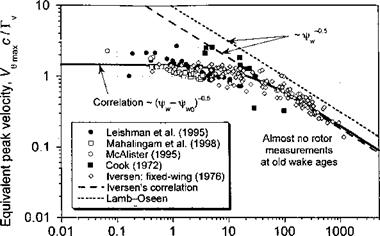
Figure 10.23 shows results derived from the tip vortex measurements in terms of an equivalent maximum nondimensional tangential velocity as a function of equivalent

nonuimensionai downstream distance irom tne up oi me oiaue. rouowmg an approacn similar to Iversen (1976), we can write the nondimensional velocity and distance (in terms of vortex or “wake” age) as

Подпись: Figure 10.23 shows tip vortex measurements for subscale helicopter rotors that have been published by Leishman et al. (1995), Mahalingam & Komerath (1998), and McAlister et al. (1995). Also shown are measurements made by Cook (1972) when using a full-scale rotor. When the results are plotted in this manner, the data emphasize a strong correlation. The decreasing trend in the core swirl velocity, which is also observed in the fixed-wing case [see Iversen (1976)], confirms that the tip vortices diffuse logarithmically with increasing wake age. The measured data show the trend Vg^Xd + 2.197)5 = 2.782. Iversen reports a correlation region after a nondimensional distance of 50, where the data show the trend Vo^df'2 = 5.8. This decreasing trend in the peak swirl velocity results from viscous diffusion. For constant net vortex circulation, the nondimensional peak velocity is inversely proportional to the core radius, and the distance d is proportional to the wake age (i.e., а г"1 and d a fw). This is consistent with the experimental measurements shown previously in Fig. 10.22, where the core radius initially increases as the square root of wake age (i.e., rc ос s/Ww)- The theoretical Lamb result given previously for the viscous core growth can be written in terms of vortex age as Подпись: r.Correlation of Rotor Tip Vortex Data

Correlation of Rotor Tip Vortex Data

(10.34)

(10.35)

(10.36)

Substituting V0max = rv(l – e “)/2nrc, and using Eqs. 10.34 and 10.35, gives

Correlation of Rotor Tip Vortex Data(10.37)

As shown previously, the Lamb-Oseen result can be modified empirically to include an average effective (turbulent) viscosity coefficient, 8, that is, Eq. 10.37 can be written as

Correlation of Rotor Tip Vortex Data(10.38)

Comparing this with Iversen’s results in Fig. 10.23, we see that Iversen’s correlation is equivalent to including an effective turbulent viscosity coefficient that is proportional to the vortex Reynolds number, Tv/v. The peak velocity trend shown in Fig. 10.23 corresponds to the core growth trend

Correlation of Rotor Tip Vortex Data(10.39)

The ordinate shift, if/WQ, results in a effective nonzero core radius, ro, at the tip vortex origin where x(fw = 0C and, therefore, a finite velocity at d = 0. However, in the other two models (i. e,, Lamb-Oseen and Squire models) the swirl velocity is singular at the origin of the tip vortex and unrealistically high at small distances (wake ages). However, at large downstream distances (wake ages), all three curves show the same qualitative trend, that is the velocity is inversely related to л/t (i. e., Vemax a or equivalently, the core radius increases in

proportion to л/t (i. e., rc OC fH2).

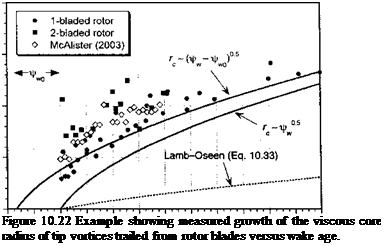
The viscous core growth trend as a function of wake age as derived from the above correlation trend has been plotted in Figure 10.22, along with the Lamb (laminar) result and a Lamb-type trend with a higher (constant) effective turbulent viscosity. Again, the differences between the two curves are obvious at early equivalent wake ages. At later wake ages, the two curves have a qualitatively similar behavior. At large wake ages, they will be almost coincident, that is

Correlation of Rotor Tip Vortex Data(10.40)

Vorticity Diffusion Effects and Vortex Core Growth

The vortex core dimension is an important parameter that can be used to help define the structure and evolution of tip vortices. Half of the distance between the two velocity peaks shown in Fig. 10.18 can be considered as the average (nominal) viscous core radius. This region is where most (but not all) of the vorticity in the tip vortex is concentrated. This core quantity is plotted as a fraction of blade chord, c, in Fig. 10.22 as a function of wake age, Jrw. It is apparent that there is a fairly rapid but asymptotic-like growth in the core. The blade passage event at i/’b = — 2зт/Nb temporarily alters the growth trend, and a

slight decrease in core size is usually observed. This is fundamentally a vortex stretching problem. This stretching effect is more evident for a two-bladed rotor (or for a rotor with higher number of blades) because the tip vortex does not have time to convect very far through the flow and is subsequently much closer to the following blade. After the blade passage, the viscous core continues to grow with a similar rate. The difficulties in measuring the vortex properities at older wake ages is compounded by the tendency for the flow to become aperiodic (see Section 10.5.1).

Подпись:0.2

о

3 0.15

тз со

£

о 0.1

га с о со

<5 0.05 Е Ъ с о

2 0

-180 0 180 360 540 720 900

Wake аде, – deg.

A simple quantitative model of the growth in vortex core radius with time can be based on Lamb’s result for laminar flows – see Lamb (1932), Chigier & Corsiglia (1971), and Ogawa (1993). This result shows that without external velocity gradients (which can cause stretching and so will affect the core development) the core radius varies with the square root of age according to rc(t) — *j4avt. Starting from the Lamb-Oseen swirl velocity profile model in Eq. 10.9 then a change of variable to x — r(4vt)~l//2 gives the swirl velocity in the vortex according to

Vr0(x) = ‘;—- —f=[1 – exp(-x2)]. (10.31)

2nx^/4vt

Now, by definition, the core radius, rc corresponds to the value of r when Vq reaches a maximum, so differentiating the latter equation with respect to x gives

Подпись: dVe dx Подпись:11 , 9 ‘ —9 3 9 exp(-xz) – f 2exp(-x )

у/. yZ

= db^[(l+2xI)ex*-x2)~l]’ (1032)

which must be zero for a maximum. This gives the solution x = 1.1209, and so the core radius grows according to the relation

rc(t) = 1.1209/4vt = *j4avt, (10.33)

where a = 1.25643. See also Question 10.6.

In practice, because of turbulence generation, the actual diffusion of vorticity contained in the vortex is known to be much quicker than using Eq. 10.33 (i. e., with molecular diffusion only being allowed by this model). It can be expected that the tip vortex initially exhibits a predominantly laminar behavior; thereafter the vortex progressively becomes turbulent. The tendency toward turbulence generation must be related to the vortex Reynolds number, Rev = Tt)/v, among other factors such as rotational stratification effects, which are discussed later in Section 10.6.5. The rate of development of the turbulent structures near the core will alter the effective diffusion rate of vorticity from within the vortex.

These effects, albeit very complicated on a fundamental level, can be incorporated into a model core growth equation using an average “turbulent” viscosity coefficient [see Dosanjh et al. (1962), Squire (1965), Ogawa (1993) and Bhagwat & Leishman (2000a, 2002)], where now the assumption is that rc{t) = f4ctEvt. The coefficient S takes into account the more rapid core growth based on an average increased rate of vorticity diffusion as a result of turbulence generation and is a coefficient that must be deduced from vortex core structure measurements. Squire (1965) has postulated that the effective (turbulent) viscosity coefficient, 5, should be a function of the circulation strength (circulation) of the trailed tip vortex, Г„. Because, in practice, the strength (circulation) of the vortex is conserved and is found to remain nominally constant as the vortex ages in the flow [see Dosanjh et al.

(1962) , Mahalingam & Komerath (1998), and Bhagwat & Leishman (2000a, 2002)] it is reasonable to assume a constant value of S. However, this hypothesis can only be verified through experimental correlation. In addition, because it is known that the vortex is already in some stage of decay immediately after its formation, it can be hypothesized that the growth curve can be originated at a virtual time, say to, so that rc(t) = s/4aSv(t — to) – see Squire (1965) and results in Fig.-10.22.

Equivalent downstream distance, ip Г / Qc2 f(Re )

W V V

Figure 10.23 General correlation of rotor tip vortex measurements in terms of nondimen – sional maximum tangential velocities and nondimensional downstream distance.

Models for the Tip Vortex

Models for the Tip Vortex

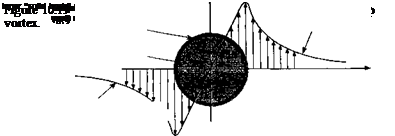
With this general picture of the tip vortex induced velocity field in mind, a model of the tip vortex can now be hypothesized. Tip vortex models used in rotor wake simulations are typically specified in terms of a 2-D tangential (swirl) velocity profile. The other velocity components (the axial and radial) are small and are usually neglected in most applications. This, however, may not be a justifiable assumption at young wake ages. A schematic of a typical distribution of swirl velocity is shown in Fig. 10.19. The inner part of the vortex (the core region) rotates almost as a solid body, whereas the outer part behaves almost as a potential flow. The core radius, rc, is defined as the radial location where Vq is a maximum (i. e., at the core radius r = r/rc = 1). This boundary demarcates the inner (almost purely rotational) flow field from the outer (potential) flow.

Models for the Tip Vortex

The simplest model of a vortex with a finite core is the Rankine vortex [see Lamb (1932)], where the swirl velocity is given by

the Lamb vortex model (Eq. 10.9) can be written as a function of nondimensional radial distance r — r/rc as

Models for the Tip Vortex

Models for the Tip Vortex

(10.14)

Models for the Tip Vortex

Using a series expansion for the exponential term and ignoring higher order terms, it can be shown that

(10.15)

Because of the assumption of a columnar vortex, the axial and radial components derived by Vatistas et al. (1991) do not strictly apply to trailed vortices. However, a general result for the axial (and radial) components of the velocity for trailed vortices can also be deduced starting from the assumption of Eq. 10.11 and the appropriate form of the governing Navier – Stokes equations applied to a trailing vortex,^ In the first instance, it is reasonable to assume that the induced velocities are dependent only on r and z (i. e., the vortex is assumed to be axisymmetric). The governing Navier-Stokes equations in cylindrical coordinates for incompressible flow are written as

continuity:

Подпись: 3 Dr. Mahendra Bhagwat is responsible for this analysis. (10.16)

Models for the Tip Vortex Подпись: V2Vr - Подпись: av, dve dve^vrve dr dz dz r

r m

It should be noted that the 0- and г-momentum equations indicate that the swirl and axial velocities have small gradients along the z axis, and are not independent of z. This is consis­tent with various experimental observations that viscous diffusion is a gradual process and, therefore, the velocity gradients along the time-like z axis are small. It is also observed that the peak axial velocities decrease rapidly at early wake ages, whereas the peak swirl veloc­ities decrease more gradually (~N/z) (i-e., the swirl velocity gradients are small compared to the axial velocity gradients). Using this information, the в – and ^-momentum equations can be written as

Подпись: (10.28)dVe, a V, ,

—-=0[O(c3)] and —i = 0 [0(e2)],

dz dz

Models for the Tip Vortex Подпись: (10.29)

and the 0(e2) terms in the ^-momentum equation cancel each other, that is,

The required boundary conditions given by Newman (1959) can be obtained by assuming that the vortex is generated as a “free” vortex, that is, a potential vortex of strength at z = 0, and it diffuses until at large distances the vortex induced velocities become zero. These boundary conditions can be formalized as

1. At z = 0, Ve = Fv/2nr and Vz, Vr = 0. Note that there is a singularity at r = 0.

2. For г > 0, Vg, Vz, Vr 0 for larger.

3. As z —> oo, Ve, Vz, Vr -* 0 for all r.

The governing equations have now been reduced to only two equations (i. e., Eqs. 10.24 and 10.29) but are in terms of three components of velocity, for which there can exist no unique solution. However, with the assumption of the Vatistas swirl velocity model m Eq. 10.11, the axial and radial velocities can be found using Eqs. 10.24 and 10.29. These

Models for the Tip Vortex Подпись: and Подпись: (10.30)

components are found to be

where A is a constant related to drag, as mentioned previously.

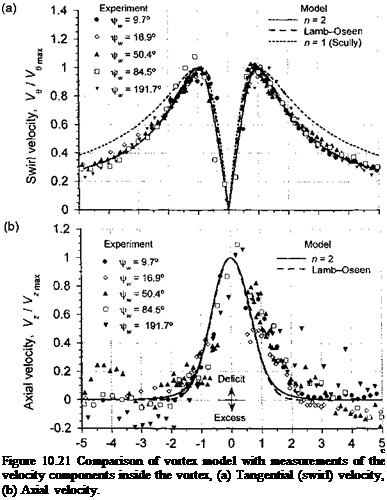
Подпись: C Figure 10.21 Comparison of vortex model with measurements of the velocity components inside the vortex, (a) Tangential (swirl) velocity, (b) Axial velocity.

The results from the above analysis of the vortex problem have been compared with some of the experimental measurements shown previously in Fig. 10.18. The time-averaged convection velocity of the tip vortex through the rotor wake has been removed, which puts the measurements into a frame of reference moving with the vortex core. Figure 10.21(a) shows the measured swirl velocities nondimensionalized with respect to the peak velocity and the radial distance with the estimated core radius. The measurements show a good correlation with the Lamb-Oseen and n = 2 swirl velocity models, and they also confirm

Distance from vortex center, r! r

the self-similar nature of the velocity field surrounding the tip vortex. Some deviations may be attributed to the presence of extraneous wake vorticity from the inboard part of the blade and other blades that are present in the measurement grid. The commonly used n = 1 or Scully (1975) vortex model seems to be a less accurate descriptor of the velocity field, at least in this case. Figure 10.21(b) shows corresponding comparisons for the nondimensional axial velocities. Again, the Lamb-Oseen and n = 2 model are found to give good agreement with the measured velocities. Like the swirl velocity, the axial velocity profiles also exhibit a self-similarity, though perhaps not as strongly. The fluctuations in the measured axial velocities are probably a result of small asymmetries in the tip vortices. However, the generally good agreement with the measurements suggests the validity of the assumptions inherent in this very basic analysis of the trailed vortex problem.