Category Principles of Helicopter Aerodynamics Second Edition

Velocity Field

Understanding the velocity field near the tip vortex, the vortex strength (circula­tion), viscous core radius, as well as how these properties change as the vortex ages, is still a goal of ongoing research. The earliest reported measurements of helicopter rotor tip vortices were performed using hot-wire anemometry (HWA) – see Simons et al. (1966), Cook (1972), Caradonna & Tung (1981), and Tung et al. (1983). However, HWA is limited by spatial resolution, and probe proximity concerns make measurements difficult at early wake ages near the blade tips. Laser Doppler velocimetry (LDV) is an attractive alternative because of the nonintrusive nature of the measurements (apart from seeding) and can al­leviate many limitations posed by HWA, such as the physical size of the probe relative to the vortex dimensions, probe interference effects, and wire attrition. However, amongst the main constraints of LDV are optical access, the need to uniformly seed the flow, the need for good periodicity of the flow to allow statistical phase averaging, and a requirement for coincident measurements on all three-components of velocity.

Scully & Sullivan (1972), Sullivan (1973), and Landgrebe & Johnson (1974) have re­ported some of the first uses of LDV systems to study rotor flows. Thomson et al. (1988) and Mahalingam & Komerath (1998) have made detailed LDV measurements of rotor tip vortices using a 1-D LDV system. A 2-D LDV system was developed by Biggers & Orloff (1975) to investigate some aspects of the wake generated by a two-bladed rotor – see also Biggers et al. (1977a, b). Hoad (1983) has developed a 2-D LDV system with large stand-off distances – see also Elliott et al. (1988) and Althoff et al. (1988). However, 1-D and 2-D LDV systems tend to suffer from reduced spatial resolution because of the elongated mea­surement volumes, especially with large stand-off distances, and are not always well suited for measuring the small spatial scales and steep velocity gradients found inside vortices. Three-dimensional phase-resolved LDV measurements in rotor wakes, however, have not been possible until recently – see Seelhorst et al. (1994, 1996), McAlister et al. (1995), Leishman et al. (1995), McAlister (1996), Han et al. (1997), and Martin et al. (2001). 3-D systems offer much better spatial resolution if aligned accurately and especially when they are operated in coincident mode, that is, the three component measurements are required to be all statistically correlated.

Representative LDV measurements of the tip vortex induced velocity field are shown in Fig. 10.18 for several wake ages (jrw). The tangential component of velocity has been nondimensionalized by the rotor tip speed, and the distance from the rotational axis has been nondimensionalized by the rotor radius, R. As described previously in Section 2.2.1, the blade tip vortices lie on the boundary of a contracting jet like wake, and the measurements shown in Fig. 10.18 were made on this wake boundary. Inside the wake boundary, note that the slipstream velocity is approximately constant. For increasing fw, the tip vortex convects downward below the rotor and radially inward, and so the velocity signatures shown in
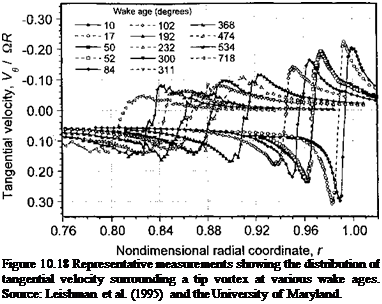
Подпись: Figure 10.18 Representative measurements showing the distribution of tangential velocity surrounding a tip vortex at various wake ages. Source: Leishman et al. (1995) and the University of Maryland.

Fig. 10.18 move to the left on the graphs. The results show the basic characteristics of viscous diffusion: vorticity contained in the vortex core diffuses radially outward with time, thereby reducing the peak swirl velocities. The distance between the two velocity peaks shown in Fig. 10.18 can be considered the viscous core diameter.

Detailed Structure of the Tip Vortices

The roll-up of the tip vortex in terms of its strength, velocity distribution, and location defines the initial conditions for the subsequent behavior of the rotor wake. Tip vortex formation is a complex problem involving high velocities with shear, flow separation, pressure equalization, and turbulence production. On most helicopters, which will have rectangular or mildly tapered blade tips, experimental evidence shows that a single vortex is fully formed at the trailing edge of the blade tip, as in Fig. 10.17, which is a shadowgraph of the flow near the tip of the blade. The tip region is enveloped with a region of high vorticity, which rolls up quickly into a dominant vortex. Because rotor blades have very large pressure differences over their tip region, the resulting tip vortices have high circulation, high swirl velocities, and relatively small viscous cores.

Most vortex wake models used for rotor loads, performance, and acoustics will have some kind of semi-empirical representation of the tip vortex characteristics. Because tip vortex properties are not as well documented as they should be for helicopter rotors, the required parameters to formulate a suitable model of the vortex are often interpreted or extrapolated from those measured in fixed-wing studies – see Rorke et al. (1972) and Rorke & Moffitt (1977). However, because of the sustained proximity of the blades to the tip vortices, the mutual interactions between the vortices, and the stretching of the filaments as they are convected in the nonuniform flow, there is questionable validity in simply extrapolating fixed-wing results to the rotor case. Another complication is that the blade tip shape is known to affect the strength and location of the blade tip vortex as it is trailed off into the wake, and these effects are even less poorly understood. For some tip shapes, multiple vortices may be produced, although one of these is usually stronger and tends to dominate the flow.

Even for rectangular tips, the overall roll-up of the tip vortex in terms of its strength and initial location behind the blade is found to be difficult to predict. Based on classical centroid of vorticity approaches, which are used in some forms of rotor analysis, the computed vortex

Detailed Structure of the Tip Vortices

Figure 10.17 Roll-up of the tip vortex occurs rapidly and is fully formed just downstream of the trailing edge of the blade. Source: University of Maryland.

Detailed Structure of the Tip Vortices
release locations generally tend to be predicted radially much further inward toward the hub than are observed from flow visualization experiments. Using fundamental vortex dynamics, Rule & Bliss (1998) have highlighted the complexity of modeling the problem. Modem first-principles finite-difference methods, such as those discussed by McCroskey (1995) and Tang & Baeder (1999), have achieved better success in predicting the exact point of origination of the tip vortex. However, for many methods, numerical diffusion and dispersion tends to produce significant errors in the subsequent vortex behavior, overpredicting the growth of the viscous core to the point that these methods cannot yet be used to confidently model the rotor wake and its induced velocity field – see Section 14.10.2.

Vortex Perturbations and Instabilities

Подпись: Besides the more random types of aperiodicity found in rotor wakes, other deter-ministic types of perturbations and instabilities of the tip vortices have been observed. One common type is the smooth sinuous wave type observed by Landgrebe (1971), Sullivan (1973), and others and analyzed theoretically by Levy & Forsdyke (1928), Widnall (1972),

Gupta & Loewy (1973, 1974), and Bhagwat & Leishman (2000b). An example of a short sinuous (or Kelvin) wave is shown in Fig. 10.15(a). These types of disturbances are often neutrally stable, but can become pronounced in amplitude at older wake ages. Long wave disturbances or instabilities can sometimes result in pairing and looping of adjacent vortex filaments and can often be a source of some aperiodicity in the flow – see the experiments by Tangier et al. (1973) and Martin et al. (1999) and analysis by Gupta & Loewy (1973, 1974) and Bhagwat & Leishman (2000b). In some cases, vortex pairing may lead to a complicated aperiodic wake formation but at a subharmonic of the rotor frequency – see Leishman & Bagai (1998). Based on various experimental observations, the onset of vortex

disturbances and wake instabilities is affected by the number of blades, rotor thrust (disk loading), and overall operating conditions. Forward flight experiments with helicopter ro­tors in wind tunnels have shown that the tip vortices appear generally free from the regular sinuous perturbations so often noted in hovering rotor wakes, although such effects cannot be discounted unilaterally.

Vortex Perturbations and Instabilities

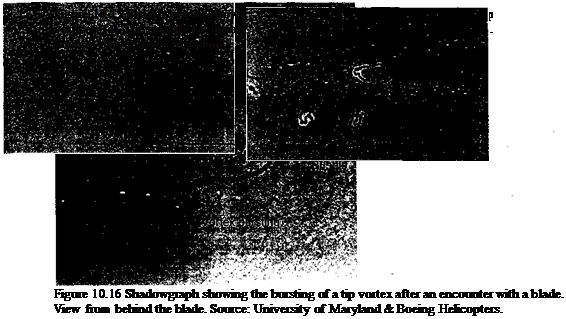
Another type of perturbation sometimes found in rotor wakes, both in hover and forward flight, is referred to as the “cork-screw” or helical type, with examples being shown in Figs. 10.15(b) and 10.16. Here, the vortex filament tightly twists around on itself forming a very pronounced helix. These helical type perturbations appear to be common in the wakes of highly loaded propellers or tilt-rotors [see Norman & Light (1987)] rather than helicopter rotors, but they have been observed on both. In some cases, the disturbance travels along the vortex filament. In other cases, it is damped out, and the vortex returns to its regular

(periodic) form. Occasionally, the disturbance may cause the vortex to become unstable, and it may break down or burst. An example of this latter phenomenon is shown in Fig. 10.16, where vortex bursting clearly originates from the formation of a helical disturbance formed on the vortex just downstream of the blade.

Other Characteristics of Rotor Wakes

10.5.1 Periodicity versus Aperiodicity

In most cases, the rotor wake is deterministic, and the tip vortices generated by each blade will follow smooth curved and almost helical or epicycloidal paths. Also, under ideal circumstances, their spatial locations relative to the rotor will be periodic at the rotor rotational frequency. However, various types of aperiodic behavior of rotor wakes have been noticed in experiments. Aperiodicity can be defined as the random variations in the spatial locations of the vortex filaments from a mean position at a given wake age. In fixed – wing terminology, this phenomena is referred to as vortex wandering or meandering – see Devenport et al. (1996) and Leishman (1998). If aperiodicity occurs above some threshold, then measurements based on the assumption of a periodic flow will be biased because the small random displacements of the vortices essentially average out the flow field properties at a fixed measurement point.

For helicopter rotors, the available experimental evidence suggests that wake aperiodicity is a characteristic that is, in part, related to the nature of the rotor operating state; in hover the phenomenon is more likely to show than in forward flight. For example, measurements of the tip vortex locations in hover that are reconstructed on the basis of a series of images of the wake made at different wake ages may take the appearance of significant scatter, or even two possible geometries. Such a behavior can be traced to aperiodic flow effects and has been observed in several rotor experiments, including those of Landgrebe (1972), Norman & Light (1987), Bagai & Leishman (1992b), and Leishman (1998). Most of the available experimental evidence with rotors shows that aperiodicity is pronounced only at older wake ages (older than one or two complete rotor revolutions), at low thrust coefficients (where the slipstream convection velocities are low and the tip vortices remain close to the rotor plane), or after the first blade passage. At a minimum, appropriate allowance can be made when quoting measurement uncertainties and when comparing with computations of the wake topology. From a purely scientific perspective, the challenge is to understand whether the observed aperiodic behavior of rotor wakes is an inherent physical characteristic or if their source lies in small external flow disturbances that are produced within the ground test facility. However, the fact that rotor wakes disturbances occur under very controlled laboratory conditions suggests that they would also be expected to occur under the normal turbulence levels found in the atmosphere, especially closer to the ground.

Blade—Vortex Interactions (BVIs)

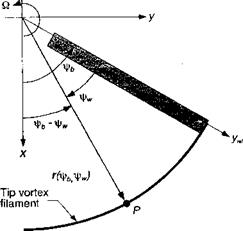
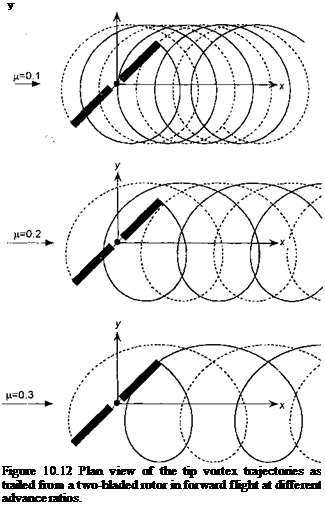
It will be apparent from the forgoing discussion that one of the distinctive features of rotor wakes in forward flight is the preponderance of potentially close interactions of blades and tip vortices, which are called blade-vortex interactions or BVIs. When viewed from above [i. e., see Fig. 10.8(a)] the trajectories formed by the tip vortices trace out closely epicycloidal forms. If the wake is assumed to be undistorted in the x-y (TPP) plane (a justifiable assumption near the rotor disk based on the example shown in Fig. 10.8), then the tip vortex trajectories are described geometrically by the parametric equations

Подпись: (10.1)Подпись: (10.2)= x’ti = cos(fb – fw) +

A

= >’tiP = sin(V9> – fw),

where is the position of the blade when the vortex was formed, and is the age of the vortex element relative to that blade (see Fig. 10.11). It has been assumed that no wake contraction occurs in the radial dimension.

Examples of the wake topology when viewed from above the rotor are shown for three advance ratios in Fig. 10.12, with results for a two-bladed rotor being shown for simplicity. It will be apparent that BVIs can occur at many different locations over the rotor disk and also with different orientations between the blade axis and the vortex axis. If BVI occurs on the advancing side of the rotor disk, the blade and vortex axis can be nearly parallel. It has been described in Chapter 8 how these conditions promote (at least locally) highly

Blade—Vortex Interactions (BVIs)

Figure 10.11 Definition of the position of an element in the vortex wake.


Blade—Vortex Interactions (BVIs)

unsteady airloads on the blades, which can also be accompanied by significant obtrusive noise with strongly focused directivity – see Schmitz (1991).

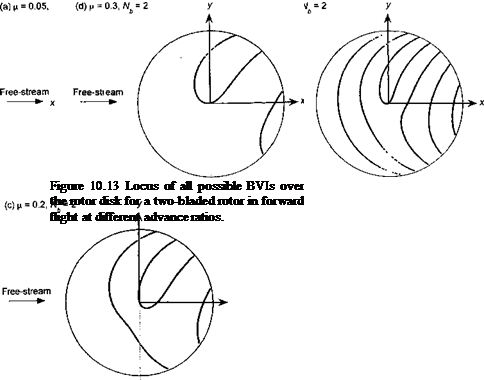
For a rotor with Nb blades, and assuming an undistorted wake, the locus of all the potential В Vis can be determined if the equations

r cos (j/b – A) = cos(^ – + ktfw (10.3)

and


r sin cjrb — A) = sin(V^ – fw) (10.4)

are simultaneously satisfied for r (on the blade) and frb, where A = 2n(i — 1 )/Nb, і = 1,2,…, Nb with Nb as the number of blades and ifrw is the age of the vortex (wake age) relative to the blade from which it originated. It can be shown that for the blade positions


— cos A sin^u, — A) ± sin Ayjцїф-і — sin2Cirw — A)


Blade—Vortex Interactions (BVIs)

(Ю.5)


Blade—Vortex Interactions (BVIs)

and note that this is a multi-valued solution. We are only interested in the real parts (i. e., /х2і/^ — sin2(^w — Д) > 0) with particular attention to the signs of the angle and multiple values of the arcsine. The corresponding value of r is obtained from

Подпись: (10.6)sin(^fc – fw)

sinCV’fc – A)

where we are only interested in the disk itself (r < 1). Finally, the x, у locations of the ВVI intersection points over the disk are obtained from

x = r cos(фь — A) and у = r sin(xf/ь — Л). (10.7)

By solving for J/b and r for numerical values of yfrw > 0, we can determine all the locations of the potential BVI intersection points. (See also Questions 10.3 and 10.4.)

Blade—Vortex Interactions (BVIs)

Figure 10.13 shows these locations for a two-bladed rotor (AV== 2) operating in forward flight at four advance ratios. Again, it should be appreciated that this calculation assumes that all the vortices lie in the TPP. For any one flight condition they do not, but these figures give an indication of all the possible intersection locations. Notice that the largest number of potential BVIs occur in low speed forward flight. As forward speed increases, their number is reduced considerably. However, even though the number of potential interactions may decrease, it is their intensity and also the trace Mach number of the interaction that determines the potential noise and directivity of noise associated with а В VI – see Lowson (1996) and Leishman (1999), as well as Section 8.19.

Despite its importance to helicopter noise and vibration, clear experimental studies of the parallel BVI problem are relatively rare. Good, albeit idealized, quantitative measure­ments of blade vortex interactions and collisions are described by Horner et al. (1994) and Kitaplioglu & Caradonna (1994). Contributions to visualizing the problem have been achieved with the use of smoke [see Mercker & Pengel (1992) and Lorber et al. (1994)] and using strobed shadowgraphy [see Swanson (1993)].

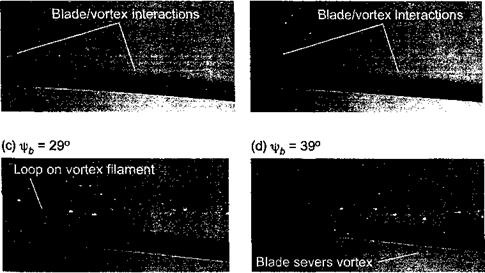
The other type of BVI occurs when the blade and vortex axes are almost perpendicular, which is mainly over the front and rear of the disk. While the former type tends to produce the largest unsteady airloads and noise generation, the latter tends to result in more highly 3-D airloads and broadband noise – see Schmitz (1991). Figure 10.14 shows a sequence of flow visualization images obtained with wide-field shadowgraphy, which detail the blades encountering a perpendicular type of BVI over the leading edge of the rotor disk during low-speed forward flight. We see that as the older wake vortices move downstream (to the right) they move up and over the top of the following blades (see also Fig. 10.13). A disturbance is produced on the older vortices as following blades pass underneath. After the blade passes, the tip vortices return to their original undisturbed shape. For progressively greater wake ages, the vortices are convected further downstream and the blade intersects and severs the vortex filament. This can result in an instability or transition bifurcation that is characterized by a large growth in the viscous core dimensions. This is known as “vortex bursting,” although the proper explanation of this phenomenon perhaps remains somewhat controversial. However, an increase in the effective core size and/or diffusion rate of the tip vortex produced by bursting is inevitable and will affect the intensity of other potential interactions with blades. This is one type of rotor wake problem that is poorly understood and difficult to model.

(а)Ц)„ = 12° (b) ^ = 23°

Blade—Vortex Interactions (BVIs)

Figure 10.14 A series of shadowgraph flow visualization images showing perpendicu­lar В Vis over the front of the rotor disk in forward flight, (a) xj/ь = 12°. (b) fb = 23°. (c) xj/b = 29°. (d) іkb = 39°. Free-stream flow is from left to right. Source: University of Maryland.

Wake Boundaries

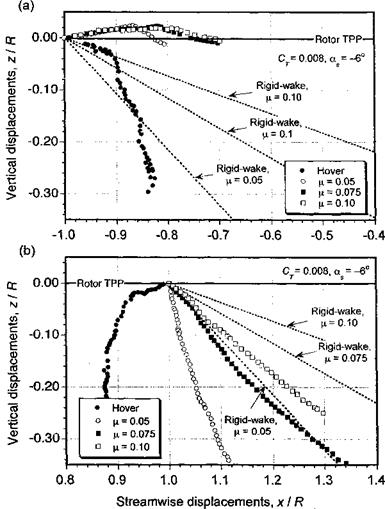
An understanding of the position of the rotor wake boundaries in forward flight can give much useful information to the rotor analyst. Leishman & Bagai (1991) and Bagai & Leishman (1992b) have examined the positions of the tip vortices generated by an isolated rotor and also a rotor with an airframe. The flow visualization results were obtained using shadowgraphy. The measured wake boundaries are plotted in Fig. 10.10 for hover and in forward flight at three advance ratios. Also shown are the positions of the wake that can be predicted on the basis of momentum theoiy considerations alone (i. e., a rigid-wake; see later in Section 10.7.5). Clearly, the correlation with the measured displacements is poor, and the results confirm what can already be deduced from Fig. 10.8, namely that there are considerable mutually induced effects between vortex filaments inside the rotor wake at lower advance ratios. This leads to a powerful longitudinal (and also a lateral) asymmetry

Wake Boundaries

Figure 10.1G Tip vortex displacements in an x-z plane at the longitudinal centerline of an isolated rotor. Four-bladed rotor, CT = 0.008, forward shaft tilt angle of 3° in forward flight, (a) Front of rotor disk, (b) Rear of rotor disk. Data source: Leishman & Bagai (1991).

of the wake that cannot be predicted on the basis of momentum theory alone. Notice from Fig. 10.10(a) that the vortices at the leading edge of the disk are initially convected above the blades and the rotor TPP within the first 90° of wake age, compared to the rear of the disk [see Fig. 10.10(b)], where the wake vortices are convected quickly away from the rotor. This is because of a small region of upwash velocity at the leading edge of the disk and a strong longitudinal inflow gradient, which has its source in the skewness of the wake (see also the discussion in Section 3.5.2).

Characteristics of the Rotor Wake in Forward Flight

As in hover, a helicopter rotor wake in forward flight is found to be dominated by the blade tip vortices. However, because of the free-stream (edgewise) component of velocity at the rotor plane in forward flight, the wake is now convected behind as well as below the rotor and it takes on a more complicated (nonaxisymmetric) form. The rotor wake geometry in forward flight is found to be sensitive to the rotor thrust, advance ratio, tip path plane (TPP) AoA, the presence of other rotors (such as a tail rotor, or another main rotor as in tandem or coaxial configurations), and rotor-airframe interference effects. While much is now known about the general features of rotor wakes in forward flight, much more is still to be learned about the details of the flow, especially before mathematical models of the rotor wake can be adequately validated.

There are a variety of techniques that can be used to visualize rotor wakes in forward flight, and some of these have been discussed previously in reference to hovering wake studies. Other techniques have included cavitation from the blade tips in a water tunnel, such as used by Larin (1973, 1974). Lehman (1968) and Landgrebe & Bellinger (1971) have used bubbles to trace out the tip vortices trailed from a rotor in a towing tank. Jenks et al. (1987) have used stratified layers of dye in a towing tank to observe some aspects of the wake roll-up. In a wind tunnel, smoke injection from the blade tips can provide good evidence of the epicycloidal tip vortex trajectories – see Muller (1990a, b). Laser sheet smoke flow visualization, such as used by Ghee & Elliott (1995), is generally con­sidered one of the more accurate ways of documenting the spatial locations of the tip vortices.

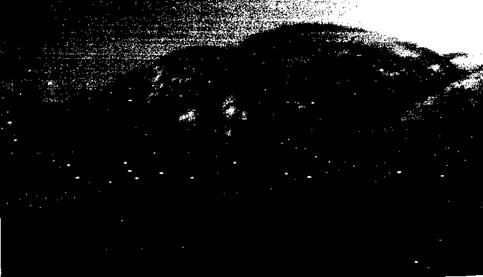
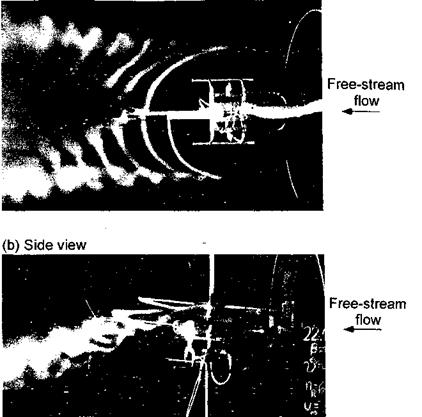
Characteristics of the Rotor Wake in Forward FlightAn example documenting the general features of a helicopter rotor wake in forward flight is shown in Fig. 10.8, where smoke trailed from the blade tips was used to mark the vortex locations. It will be apparent from the top view (x-y plane) that the tip vortices are initially laid down as a series of interlocking epicycloids. Mutual interactions between the individual filaments results in some distortion of the vortex positions, but mostly in the z direction normal to the plane of the rotor (see side view). This distortion is particularly strong at low advance ratios, where the tip vortices are closest together. Notice from Fig. 10.8(a) that along the lateral edges of the wake the individual tip vortices begin to roll up into vortex bundles or “super vortices,” as mentioned previously. Another example of this phenomenon is shown in Fig. 10.9. Notice also in Fig. 10.8 that the effects of the tail rotor can be seen as an expanding turbulent wake embedded inside the main rotor wake.
(a) Top view


Figure 10.8 Identification of the tip vortex locations in a two-bladed rotor wake during operation in forward flight by ejecting smoke out of the blade tips, (a) Plan view (jt-y plane), (b) Side view (x-z plane). Free-stream flow is from right to left. Source: Courtesy of Reinert Muller.


Characteristics of the Rotor Wake in Forward Flight

Figure 10.9 The roll up of the rotor wake into two “super vortices” can be seen behind the rotor of small tip-jet driven helicopter. Source: Courtesy of Advanced Technologies Inc.


Characteristics of the Rotor Wake in Forward Flight

Wake Geometry in Hover

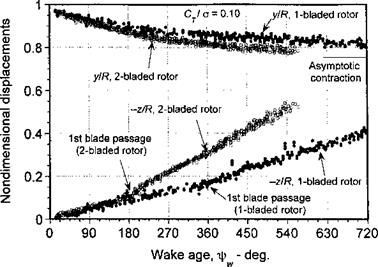
Flow visualization images such as those shown in Fig. 10.5 can also be used to derive quantitative information by digitizing the locations of the seed void and the shear layer associated with the vortex sheet. Figure 10.6 shows the axial (z/R) and radial (y/R) displacements of the tip vortices as generated by one – and two-bladed hovering rotors operating at the same nominal blade loading coefficients; the total thrust of the two-bladed rotor is approximately twice that of the one-bladed rotor. The characteristics of the tip vortex geometry shown here are representative of the results that would be obtained with any lightly loaded hovering rotor. Up to the first blade passage, which occurs at a wake

Q/ ЛЛ (7. іp ІІлл numKat* rvf fUa fin irnrfi пар 1*417

/Jt^b VYVjLlwlw Л*Ь 10 tnv auiuuvi vrx uiauv^oy, uiv up vuiut’V/o gvuw’iaivu ujf

Wake Geometry in Hover

either of the rotors convect axially only relatively slowly. However, the effective axial (slipstream) velocity (gradient of displacement curve) is noted to increase abruptly after the first blade passage. Here, the tip vortex lies close to and radially inboard of the following blade and so is subjected to an increase in downwash velocity from both the blade and its associated tip vortex. During this process, the radial position of the tip vortices contracts progressively. While the higher thrust of the two-bladed rotor leads to a slightly more rapid wake contraction, the asymptotic values are approximately the same with y/R ~ 0.78.

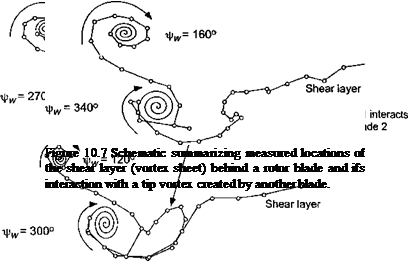
The interdependence of the flows between the vortex sheet and the tip vortex requires further discussion. The process is shown quantitatively in Fig. 10.7, where the displacements of the sheet have been digitized from flow visualization images such as those of Fig. 10.5. Initially, the vortex sheet is trailed along the entire length of the blade, with a concentrated tip vortex at the outboard edge. Both the tip vortex and the sheet then convect axially downward

Подпись:Подпись:Подпись:Подпись:Wake Geometry in Hover

Wake Geometry in Hover Wake Geometry in Hover
Wake Geometry in Hover

Digitized points on shear layer / from flow visualization

below the rotor. The visualization images suggest that the distribution of induced velocity through the rotor is highest near the blade tip and lowest near the root. Therefore, the sheet convects more rapidly below the tip region of the blade (about twice the rate) and so it becomes more progressively inclined to the rotor plane. The high swirl velocities induced by the tip vortex cause a further distortion to the sheet, and it is apparent that the outboard edge of the sheet interacts with the tip vortex generated by another blade. This complex interaction between elements of the wakes generated by different lifting surfaces is fundamentally different from that found on fixed (nonrotating) wings and illustrates another level of complexity in the understanding and modeling of helicopter rotor wakes. Free-vortex methods generally capture the effects of the vortex roll-up relatively well. However, modem CFD methods, such as those discussed by Raddatz & Pahlke (1994) and Tang & Baeder

(1999) , have not yet allowed the details of the vortex sheet and the tip vortex to be fully resolved because of rapid artificial numerical diffusion associated with the characteristics of the finite-difference schemes – see Section 14.2.2.

. Characteristics of the Rotor Wake in Hover

10.3.1 General Features

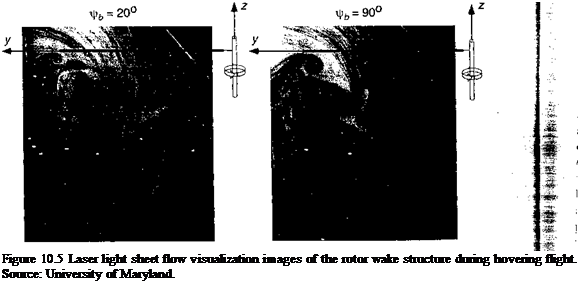
In hovering flight a helicopter rotor wake is radially axisymmetric (at least in principle) and somewhat easier to study by means of flow visualization because only one view at successive blade positions (azimuth angles) is necessary to obtain a complete 3-D understanding of the wake topology. Figure 10.5 shows representative flow visualization images in the wake of a two-bladed rotor operating in hover. In this case, a fine mist of submicron atomized oil particles was illuminated with a thin laser light sheet that was positioned in a radial plane extending through the rotational axis of the rotor. The sheet was pulsed at a frequency of one flash per rotor revolution, so as to create an instantaneous illumination of the wake – see Martin et al. (1999) for further details. The results in Fig. 10.5 are for two blade azimuth positions.

Подпись: Figure 10.5 Laser light sheet flow visualization images of the rotor wake structure during hovering flight. Source: University of Maryland.

Notice the existence of two major flow features in Fig. 10.5. First, the blade tip vortex cores are identified by the dark seed voids. Wherever the local velocities are high enough to cause centrifugal forces on the seed particles, they will spiral radially outward. The particles will reach a radial equilibrium only when the centrifugal and pressure forces are in balance. The resulting voids can be larger than the actual viscous core size of the tip vortex – see Leishman (1996). Second, there is a shear layer trailed behind the blade, which is apparent in Fig. 10.5 by a discontinuity in the streaklines. This shear layer is formed by merging of the boundary layers from the upper and lower surfaces of the blade, which contain both negative and positive vorticity. This shear layer is often referred to as a vortex

. Characteristics of the Rotor Wake in Hover

Figure 10.6 Tip vortex displacements of one – and two-bladed rotors operating in hover. Cr/cr & 0.1. Data source: Leishman (1998) and the University. of Maryland.

. Characteristics of the Rotor Wake in Hover
Подпись:sheet.2 The sheet has a strength that is related to the spanwise gradient of lift (circulation) over the blade. Initially, the vortex sheet is seen to extend over the entire blade span. There­after, both the sheet and the tip vortex are convected below the rotor disk. The significant inward (radial) contraction of the tip vortices below the rotor is clearly evident. Both the tip vortex and the inner sheet are typically found to be visible for about two rotor revolu­tions, after which details of the individual flow structures become harder to discern. This is because of diffusion of the seed particles, as well as because the wake further downstream becomes aperiodic as it ultimately transitions into a turbulent jet.

Density Gradient Methods

A fundamental requirement for the successful application of density gradient meth­ods of flow visualization such as schlieren or shadowgraphy is that the flow contain regions with significant density inhomogeneities. Because the refractive index of air is directly proportional to its density, planes with density variations in the flow field cause incident light rays normal to these planes to be refracted. Using a cutoff or other device, the angular deflection of the light rays gives a schlieren effect. If the rays are directly cast onto a pro­jection screen, this will result in a shadowgram or shadowgraph. While shock waves and acoustic waves are readily visualized with density gradient techniques, it is not always ap­preciated that the flow near rotor tip vortices will also produce large enough compressibility effects. However, to achieve such effects with subscale rotors, the tip speeds must be at or close to full-scale values, and the rotor must be operated at relatively high rotor thrust and blade loading coefficients to generate strong vortices. General overviews of density gradient techniques of flow visualization are given by Holder & North (1963) and Merzkirch (1981).

Walters & Skujins (1972), Tangier et al. (1973), Tangier (1977), and Moedersheim et al. (1994) have used strobed schlieren techniques to observe the tip vortices generated by subscale rotors. An example of Tangier’s work is shown in Fig. 10.3, where the tip

Density Gradient Methods

Figure 10.3 Strobed schlieren visualization of part of the wake formed by a subscale rotor during hovering flight. Source: Tangier (1977) and courtesy of James Tangier.

Density Gradient Methods
Подпись: View along vortex axis

Figure 10.4 Visualization of a tip vortex filament inside a rotor wake by means of wide – field shadowgraphy. Source: University of Maryland.

vortices can be clearly seen. .Tangier (1977) also shows that various 3-D acoustic wave phenomena generated by the rotor can be rendered visible with schlieren. A limitation with schlieren, however, is the small field of view because of the need to use high-quality, aberration-free, focusing mirrors. Direct shadowgraphy uses no mirrors and so allows a much larger field and angle of view. However, because of the relatively weak density gradients found in rotor vortices, a shadowgraph screen must be made of a high-efficiency retroreflective material to give sufficient contrast to allow the image to be recorded on photographic film – see Moedersheim et al. (1994) and Winbum et al. (1996). Parthasarthy et al. (1985), Norman & Light (1987), Light et al. (1990), Bagai & Leishman (1992a, b), Swanson (1993), and Lorber et al. (1994) have successfully used strobed shadowgraphy to study tip vortex formation, blade vortex interactions, and rotor wake-airframe interaction phenomena. By taking advantage of the axial symmetry of the wake in hover, shadowgraphy can also allow the quantitative displacements of the tip vortices relative to the rotor to be obtained as a function of wake age – see Norman & Light (1987) and Bagai & Leishman (1992b).

Figure 10.4 shows an example of a strobed shadowgraph detailing the flow immediately surrounding a tip vortex. This image was captured using a modified wide field-of-view shadowgraph system, incorporating a beam splitter arrangement – see Bagai & Leishman (1992a). This simple adaptation of the basic wide-field shadowgraph technique allows on – axis viewing and maximizes the efficiency of the retroreflective projection screen – see Winbum et al. (1996). While the resulting image is, in fact, a 2-D rendering of a curved 3-D vortex filament, the light rays at the right of the image are almost parallel to the vortex axis. A dark circular nucleus surrounded by a circular ring or “halo” is formed at the center of the image, where the light rays have been refracted away from the vortex axis. The dimensions