Category Principles of Helicopter Aerodynamics Second Edition

Engine Fuel Consumption

For many performance problems, such as the calculation of range and endurance, a knowledge of the engine fuel bum is required. From the power required curves the fuel consumption can be estimated for a given type of engine. Engine performance data are often expressed in terms of a specific fuel consumption SFC (in units of lb hp-1hr_1 or kg kW-1hr-1) versus shaft power (in units of hp or kW). These curves are a function of atmospheric conditions, so a series of curves are required for different altitudes and operating temperatures. For a normally aspirated (nonsupercharged) reciprocating (piston) engine, the power curves vary almost linearly with density ratio, a. One common approximation is
where jf*ait is the power available at altitude and Pmsl is the power available at mean sea level conditions. The value of the density ratio a and the temperature ratio 9 can be found from the equations describing the properties of the standard atmosphere given in Section 5.2. For a turboshaft engine the power output decreases almost linearly with density altitude so that a good approximation is

P„, « (1 – Kh„) к pMSL f і J, (5.61)

where £ is a constant that depends on the particular engine and 8 is the pressure ratio at that altitude.

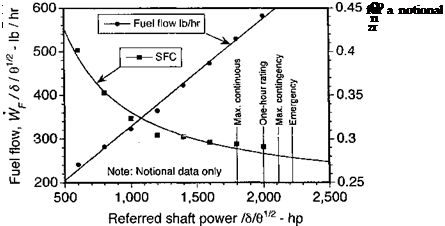
Normalizing both the power and the SFC by 891/2 is found to give a single unique relationship for a turboshaft engine [see Stepniewski & Keys (1984)]. Notional results for a turboshaft engine in the 2,000 hp class are given in Fig. 5.15. Notice that the SFC is a function of power output but quickly approaches a nearly constant value as the engine reaches its maximum continuous rated power output. Clearly the engine operates more efficiently under these conditions.

Engine Fuel Consumption Подпись: (5.62)

Because helicopters will operate with the engines operating at close to their rated power for much of the flight, a first level approximation is to assume that the SFC remains inde­pendent of power output. Of course, a better approximation is to calculate the actual fuel flow rate from the SFC curve for the engine. By multiplying the SFC by the power output it will be apparent that the fuel flow rate WF is a linear function of power output (Fig. 5.15). This relationship can be generalized as.

where the coefficients AE and BF depend on the characteristics of a particular engine.
Engine Fuel Consumption

The result in Eq. 5.62 can be easily incorporated into the performance analysis of the helicopter. It is also a useful result when examining engine selection and trading off fuel burn versus number of engines. Clearly a greater number of engines is desirable for safety of flight considerations, but more engines will also affect net fuel bum. This is apparent

Engine Fuel Consumption Подпись: AE + BE Engine Fuel Consumption Подпись: (5.63)

when considering a helicopter with NE engines that must produce a net power P for flight, then each engine will produce a power of P /NE. This means that the fuel burn (fuel flow) will be

which on comparing with Eq. 5.62 shows that the fuel flow will always be greater by a factor of approximately (1 — Ne)Ae for a multi-engine installation. Therefore, the design will normally use the fewest number of engines that is consistent with safety of flight and other considerations. ]Vlodern helicopters in the medium – to heavy-weight category will use either two or three engines, although smaller helicopters will generally use only one engine to constrain empty aircraft weight and reduce operational costs.

Effect of Density Altitude

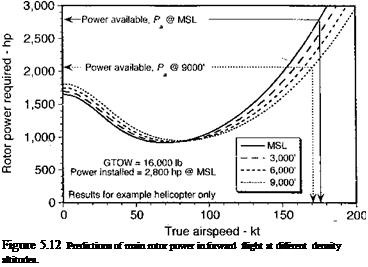
As discussed at the beginning of this chapter, an important operational consideration is the effect of altitude on overall helicopter performance. As shown in Fig. 5.12, increasing density altitude increases the power required in hover and at lower airspeeds. At higher airspeeds, the result of lower air density results in a smaller power requirement because of the reduction in parasitic drag. However, a higher density altitude will also affect the

«„пііпкіл a n їй сю :л Л1____________ псп?

engine avauaui^. rva suuwu in at 7,uva/ it inc puwci avauauic is auuui z, jtо

less than that available at MSL conditions, resulting in a large decrease in the excess power available at any airspeed relative to that at MSL.

5.5.2 Lift-to-Drag Ratios

The lift-to-drag ratio (L/D) of the helicopter or just the rotor alone can also be calculated from the power required curves. This is useful for comparison of the forward flight efficiency with another rotor, another helicopter, or a fixed-wing aircraft. Because the rotor provides both propulsive and lifting forces, the lift force is T cos orTPP. The effective drag can be calculated from the power expended (i. e., D = P/Vqq). For the rotor alone the power is P = Pi + Pq, and for the complete helicopter P = Р,- + Pq + Pp + Ptr – Therefore, for the rotor alone the lift-to-drag ratio is

Подпись:

Подпись: Figure 5.12 Predictions of main rotor power in forward flight at different density altitudes.

L _ T cos (Xppp ^ WVoo D ~ (Pi + PqVVoo ** Рі + Pq’

For the complete helicopter the lift-to-drag ratio is

— = T cosa^ ~ WV°° (5 56>

D (Pi + Po + Pp + Pm)/Voo ~ Pi + Po + P/

Representative results for the lift-to-drag ratio for the example helicopter in forward flight are shown in Fig. 5.13. It is apparent that the L/D increases rapidly as induced power requirements decrease, reaches a maximum, then drops off as the parasitic power

requirements rapidly increase. The maximum lift-to-drag ratio of the rotor is about 6, which is typical of most modem helicopters and is also typical of a low aspect ratio fixed wing. The maximum lift-to-drag ratio of the complete helicopter is about 4.5, which gives some idea as to the considerable effect of the airframe drag in the overall cmise efficiency of the helicopter. A typical L/D ratio for a fixed-wing aircraft of the same gross weight will be about 3-4 times this value. Note that the maximum lift-to-drag ratio for this example occurs at about 100 kts, which will be the airspeed to fly for maximum range. The lift-to-drag ratio of the rotor and helicopter will also be a function of the density altitude at which it is flying.

5.5.3 Climb Performance

The general power equation can be used to estimate the climb velocity, Vc, that is possible at any given airspeed. Rearranging Eq. 5.53 in dimensional form in terms of Vc leads to

Подпись: T

Effect of Density Altitude Effect of Density Altitude

(5.57)

Подпись: r _ P — flevel C - T Effect of Density Altitude Подпись: (5.58)

It is realistic to assume that for low rates of climb or descent the rotor induced power, Pi, the profile power, P0, and the airframe drag, D, remain nominally constant. In this case we can easily solve for the climb velocity to get

Note that Pievei is simply the net power required to maintain level flight conditions at the same forward speed. If the installed power available is Pa (which may vary with flight condition) then it will be seen that the power available to climb varies with forward flight

Effect of Density Altitude

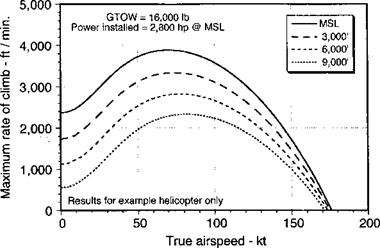
Figure 5.14 Maximum possible rate of climb as a function of airspeed for different density altitudes.

speed. The climb velocity can then be obtained from

= Pa-W + Po + Pp + Pm) = ДР

C J, ’ V У

where A P is the excess power available at that combination of airspeed and altitude.

Calculations of the maximum rate of climb as a function of flight speed and density altitude are shown in Fig. 5.14 for the example helicopter. These curves mimic the excess power available curves because the climb (or descent) velocity is determined simply by the excess (or decrease) in power required, A P, relative to steady level flight conditions. This excess is determined also by the power available from the engine (see next). Pilots often call the tendency of the helicopter to climb when translating from the hover condition as “translational lift.” However, the term is a misnomer because the helicopter climbs because of the excess power available and not because of any extra rotor lift. As shown by Fig. 5.14, the rate of climb performance is substantially affected by density altitude.

Performance Analysis

5.5.1 Effect of Gross Weight

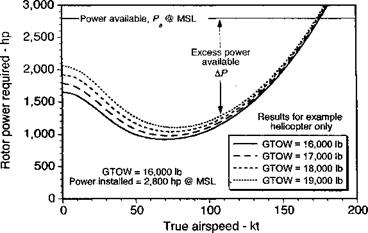
Clearly the power required in forward flight will be a function of helicopter weight. Because a relatively small weight fraction of fuel is carried relative to total weight, it is convenient to represent the performance results in terms of gross take of weight (GTOW). Representative results showing the effect of GTOW on the rotor power required are given in Fig. 5.11 for the example helicopter at mean sea level (MSL) conditions. Note that with increasing GTOW, the excess power available becomes progressively less, but it is particularly affected at lower airspeed where the induced power requirement constitutes a greater fraction of the total power. In this case, the power available at MSL is 2,800 hp and for a turboshaft engine this stays relatively constant with airspeed. The airspeed obtained at intersection of the power required curve with the power available curve gives the maximum level flight speed; however, the maximum speed may be limited by the onset of power creep from compressibility effects or high blade loads associated with rotor stall before this point is reached.

Performance Analysis

Figure 5.11 Predictions of main rotor power in forward flight at different gross takeoff weights.

Total Power

In light of the forgoing, the total power coefficient for the helicopter in forward flight can be written in the form

Cp = Cq = —j=====.-—— ( + Kii )+- J li +XcCw + CpTR. (5.53)

The tail rotor power must always be added to obtain a proper estimate of total helicopter power requirements. For larger values of /x, then X <$C /x, so that Glauert’s formula allows Eq. 5.53 to be simplified to

Cp Ш Cq = if + 8 (1 + KhL ) + 2 ( A ) M + XcCw + Cp™’ (5’54)

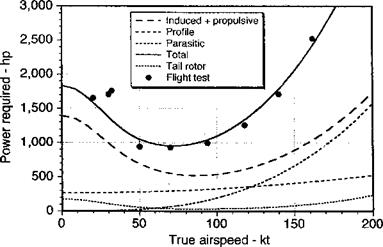
Representative results of net power required for the example helicopter in straight-and – level flight is shown in Fig. 5.10. A gross takeoff weight of 16,000 lb (7,256 kg) and an operating altitude of5,200 ft (1,585 m) has been assumed. The rotor disk AoA was calculated at each airspeed to satisfy the horizontal force equilibrium (see Fig. 2.23), which, although not a complete trim calculation, provides reasonably acceptable results. An analysis of the predicted components of the total rotor power are also shown, including that of the tail rotor. The equivalent flat-plate area, /, of the helicopter is 23.0 ft2 (2.137 m2). For both the main and tail rotors, it is assumed that к = 1.15 and Q0 = 0.008. The distance between the main and tail rotor shafts, xTR, is 32.5 ft (9.9 m).

Note from Fig. 5.10 that the induced and propulsive part of the power initially decreases with increasing airspeed but increases again as the disk is progressively tilted forward to meet greater propulsion requirements. This is because the rotor must do increasing work to overcome rotor profile and airframe parasitic losses. It is not sufficient to assume induced losses are only a result of lift generation, so induced losses decrease rapidly with airspeed to a point and then start to increase again as losses associated with propulsive forces. Unless

Total Power

Figure 5.10 Predictions of main rotor power in forward flight. Data source: Ballin (1987).

the problem is being solved for a free-flight trim (solving for the TPP to obtain vertical horizontal equilibrium of the helicopter) then the power curves do not represent a real flight condition. It can be seen that the power required for high-speed forward flight increases dramatically at higher airspeeds because the parasitic losses are proportional to p?. The rate of power growth is even higher when reverse flow and compressibility losses on the rotor are considered. However, the airframe drag makes a major contribution to the total power required in high-speed flight, and much can be done to expand the flight envelope by designing a more streamlined airframe. Unfortunately, because of various design constraints, this is not always an easy process. However, as discussed in Section 6.6.1, noticeable reductions in overall parasitic drag can be made by fairing-in the rotor hub to the fuselage, particularly by using streamlining downstream of the hub.

Tail Rotor Povser

Подпись: TTR Подпись: (Pi + P0 + Pp) £2 XTR Подпись: (5.52)

The power required by the tail rotor typically varies between 3 and 5% of the main rotor power in normal flight, and up to 20% of the main rotor power at the extremes of the flight envelope. It is calculated in a similar way to the main rotor power, with the thrust required being set equal to the value necessary to balance the main rotor torque reaction on the fuselage. The use of vertical tail surfaces to produce a side force in forward flight can help to reduce the power fraction required for the tail rotor, albeit at the expense of some increase in parasitic and induced drag. If the distance from the main rotor shaft to the tail rotor shaft is xtr, the tail rotor thrust required will be

where Q is the angular velocity of the main rotor. This assumes that there is no off-loading of the tail rotor by the fin. The interference between the main rotor and the tail rotor, and between the tail rotor and the vertical fin, is usually neglected in preliminary analysis. However, the effects of the main rotor wake may be accounted for by an increase in the induced power factor, к, to take into account the generally higher nonuniform inflow at the tail rotor location. The loss of tail rotor efficiency because of the vertical fin can be approximately accounted for by results discussed in Section 6.9.4. Although the tail rotor power consumption is relatively low, interference effects may increase the power required by up to 20%, depending on the tail rotor and fin configuration.

The tail rotor power required is initially high in hover, but quickly decreases as airspeed builds up and the main rotor torque requirements decrease. In high-speed forward flight, the tail rotor power required increases again as the main rotor torque increases to overcome parasitic drag. However, this can be offset to some extent by an aerodynamic side force that is produced on a vertical fin, such as by using a fixed incidence or using a cambered airfoil section. Because of the relatively low amount of power consumed by the tail rotor, for first estimates of performance the power required can be expressed as a fraction of the total main rotor power, with a good estimate being 5%.

Parasitic Power

The parasitic power, Pp, is a power loss as a result of viscous shear effects and flow separation (pressure drag) on the airframe, rotor hub, and so on. Because helicopter airframes are much less aerodynamic than their fixed-wing counterparts (for the same weights), this source of drag can be very significant. We can write the parasitic power as

/ л

Pp = (дрО«г Є„Л Voo, (5.47)

where SVef is some reference area and Cof is the drag coefficient based on this reference area. In nondimensional form, this becomes

с”4(т)^ = :К£И (548)

where A is the rotor disk area and / (= CDfSTef) is known as the equivalent wetted area or equivalent flat-plate area. This parameter accounts for the drag of the hub, fuselage, landing gear, and so on, in aggregate. The concept of equivalent wetted area comes from noting that while the drag coefficient can be written in the conventional way as

Подпись: (5.49)Df

‘f ipV&Srt’

Parasitic Power Подпись: (5.50)

where Sref is a reference area, the definition of SKf may not be unique. Thus an equivalent wetted area is used, which is defined as

This avoids any confusion that may arise through the definition of ST&f. It is found that values of / range from about 10 ft2 (0.93 m2) on smaller helicopters to as much as 50 ft2 (4.65 m2) on large utility helicopter designs. The concept of equivalent flat-plate area is discussed further in Section 6.6.1.

Another approach represents the parasitic drag of the helicopter relative to a value mea­sured at a reference speed of 100 units (ft/s, kts, etc.) at sea level conditions. The drag at any airspeed and altitude is then calculated using

( V 2

D = Dm{m)a’ (5-51)

where о — p/po as given by Eq. 5.11 or Eq. 5.12.

5.4.3 Climb Power

The climb power is equal to the time rate of increase of potential energy. If the potential energy is denoted as E, then E = Wh. The rate of increase of potential energy is Wh = TVC = WVC, where W is~the aircraft weight and Vc is the climb velocity. The climb power coefficient can be written as Cpc = kcCw- The effect of the fuselage vertical drag is normally taken into account when estimating the climb power, and this is discussed further in Section 6.6.2.

Reverse Flow

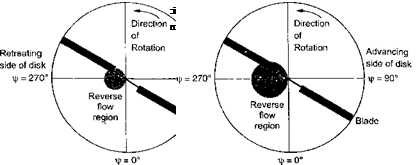
At higher rotor advance ratios, a considerable amount of reverse flow will exist on the retreating side of the rotor disk, that is, the blade sections operate with the trailing edge into the relative wind. This reverse flow region on the rotor disk is illustrated by Fig. 5.9. The locus of the region where Uj — 0 means that

UT = 0 = QR(r + fjismf), (5.41)

which has the simple solution r = —д sin j/. Therefore, the region of reverse flow where Ut < 0 covers a circular region of the disk of diameter д, with the circle centered at
(r, Jr) = (p/2, 270°). In this reverse flow region the sign of both Ut and the sectional drag contribution to the rotor drag changes (see Section 7.11.6), and so this must be accounted for in the radial and azimuthal integration to find the rotor power and drag coefficients. For a conventional helicopter the maximum feasible advance ratio is about 0.5, which means that the inboard 50% of the retreating blade operates in reverse flow. Autogiros, however, may operate at much higher p – see Chapter 12.

The effects of reverse flow can be included by changing the sign of the drag in the region defined by r = —p sin Jr on the retreating side of the disk. This may be treated by writing the integral in the profile power equation as the sum of two parts, that is

р2л /*1

Cp0 = —2— / / (r + p sin if )3dr d Jr

4tt Jo Jq

Reverse Flow

Reverse Flow

— 2л p —/X sin yj/

I (r + psinir)3dr djr, (5.42)

Jo

where the first integral has been previously evaluated in Eq. 5.28 and the second integral is the increment that accounts for the proper sign on the drag inside the reverse flow region (see Question 5.4). If the drag coefficient is assumed to be unchanged in the reverse flow region, then after integration the profile power coefficient becomes

Cp0 = —^ Л + 3p2 – f • (5.43)

This result is a fairly common approximation that can be used in a rotor performance analysis

o«H T7trr ^ cimerarfn itr iruli/lift/ to ллаЯ frv uk/міі n П Л Flrxiiklinrr fko Hrorr nmnt

uuu x ig. no vanunj io guuu iu auuui fob — j,-r. lyvuuun^ uiv uiug wwinvivuv

Подпись: CH Подпись: vCdp 8 Подпись: 2/A + -p' Подпись: (5.44)

in the reverse flow region (see results in Section 7.11.6) will increase the coefficient of the p4 term to 3/4. The equivalent rotor drag force coefficient corresponding to Eq. 5.43 is

when including reverse flow. When radial flow is included then

Подпись: (5.45)cPo = 2|*( i+V)

and with radial and reverse flow then

Cpa = (1 + V + • (5.46)

Harris (1966) and Johnson (1980) summarize how various other assumptions affect the profile power, including the effects of reverse flow and modified drag coefficients in yawed and reverse flow. The validity of some of these assumptions, however, are questionable at higher advance ratios and larger advancing tip Mach numbers and do not necessarily lead to more accurate models of the profile power. For example, because the blade stalls in the reverse flow region, the assumption that Cj = Cd0 (or even Cd = constant) is clearly invalid there (see Section 7.11.6). Generally, however, the effects of the various other assumptions are small, except for radial flow and drag effects in yawed flow, which Johnson (1980) suggests must be included to give an accurate calculation of rotor power. In this case numerical evaluation of the blade element integral is required. But the main advantage of this numerical approach is that more realistic models of the airfoil drag as a function of angle of attack (AoA), including stall, dynamic stall, yawed and radial flow, and compressibility effects can be included into the rotor performance predictions.

Compressibility Losses and Tip Relief

Compressibility Losses and Tip Relief Подпись: Ґ ЛГЛ/ A 1 Л  9 U A}^LlMdd)~ Подпись: ЮГ iKf i,90 > ividd for Ml,90 < Mdd-, Подпись: (5.30)

Gessow & Crim (1956) have estimated the additional effects of compressibility on the overall rotor profile power requirements when the tip of the advancing blade approaches and exceeds the drag divergence Mach number Mdd of the airfoil sections. Their results were obtained using blade element theory combined with 2-D airfoil section characteristics. By fitting a curve to their results, Johnson (1980) suggests that the extra rotor profile power with compressibility effects can be approximated by

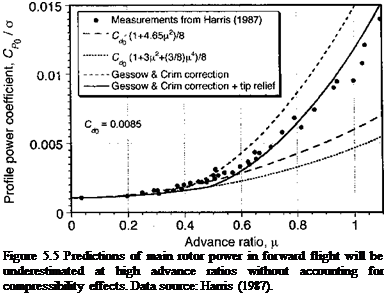
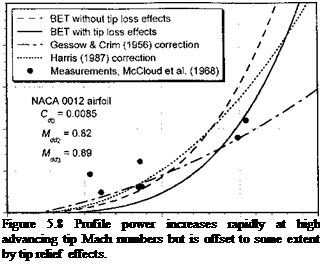
where A Mdd is the amount the advancing blade tip Mach number exceeds the drag diver­gence Mach number of the airfoil section, that is, A Mdd — Mi,90 — Mdd, where Mi,90 is the tip value at r = 1 and 1jr = 90°. Values for Mdd must be obtained from tests on 2-D airfoils (see Chapter 7). Generally, it is found that the drag on an airfoil remains nominally constant and independent of Mach number until Mdd is reached. The result of the Gessow & Crim correction to the profile power is shown in Fig. 5.5 when added to Eq. 5.29, where it is apparent that this model overpredicts the profile power. However, by making allowance for so-called tip relief effects (see next) by increasing the effective drag divergence Mach number of sections near the tip, the agreement with the measured results is better. See also Norman & Sultany (1965).

Similar techniques can be developed to account separately for the effects of stall on rotor

nmx/pr — fTiictafcnn Яг ЛЛЧ/^rc ГОД£Л friictafcnn Яг Гтрсспш япН Amp. r flQSS’l

fSXSTTWA UVV ^ A TAJ WA ^ уЛ/ 1 ^/5 WW WWUWWTT • ‘ /9 XAAAAWA

While these techniques are by no means exact, they allow a relatively simple estimate of compressibility and blade stall effects on rotor performance predictions and so are suitable for preliminary design purposes.

Подпись: Figure 5.5 Predictions of main rotor power in forward flight will be underestimated at high advance ratios without accounting for compressibility effects. Data source: Harris (1987).

Harris (1987) suggests another approximation for the profile power increase from com­pressibility effects with blades of different thickness-to-chord ratios (t/с). The result is

based on transonic similarity rules by using

Подпись: (5.31)Подпись: (5.32)ACPo _ 0.3 (1 + fi)5/2 0t/cf /2 (M + l)2 for Mli90 > Мм

Compressibility Losses and Tip Relief

for Mі 90 < Mdd,

where

(Mli90)2 – 1

1.79(Mij90)4/3(r/c)2/3

A more detailed analysis of compressibility effects on the rotor must represent the actual nonlinear airfoil characteristics as functions of Mach number through stall at each blade element, including 3-D effects, followed by integrating numerically to find the effects on rotor thrust and power. Some allowance for an effect known as tip-relief should normally be included in any such power calculation. Tip relief accounts for the relaxation of com­pressibility effects at the edge of a lifting surface of finite span, and approximations for the effect can also be developed based on transonic similarity rules. The effect was first noted in experiments on propellers, which showed that losses in propulsion efficiency did not occur until the tip Mach numbers well exceeded the drag divergence Mach number of the blade tip sections estimated from 2-D considerations. One practical analysis of tip-relief effects is given by Prouty (1971, 1986), although several approximations are involved. See also LeNard (1972) and LeNard & Boehler (1973).

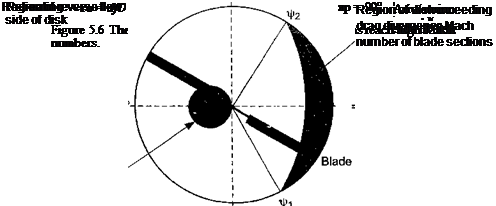
The region of the rotor disk affected by compressibility effects is shown in Fig. 5.6 and can be defined by finding where the incident Mach number of the flow that is normal to the leading of the blade exceeds the drag divergence Mach number Mdd• For an unswept blade the incident Mach number is

Подпись: (5.33)Mr^ = MsiR (r + li sin }r),

where MqR is the hover tip Mach number. This means that the region of the disk affected by compressibility effects is defined by

Подпись: (5.34)M^R (r – f д sin fr) > Mdd or that r + д sin xfr > —————

Compressibility Losses and Tip Relief

Mqr

Подпись: -1 Compressibility Losses and Tip Relief Подпись: (5.35)

The azimuth angle for the onset of drag divergence (fi) can be obtained by setting r = 1 so that

The symmetry of the problem suggests that the tip section leaves the drag divergence zone at xj/2 — 180° — f і. The parts of the blade in the drag divergence region can be found using

Подпись:Подпись: (5.37)гм = ~ MsiniAj

Подпись: 1 rv2 4-7Г Jtjf. Jr, Подпись:The increment in profile power associated with this region on the disk will be АС г 1 г*2 rl

Jrdd

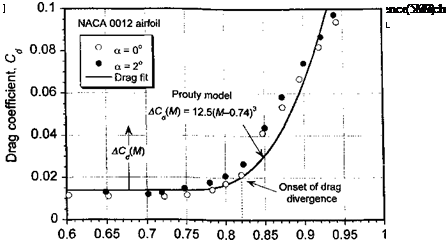
where ACd is the extra drag on the blade section when it exceeds the drag divergence Mach number Mdd• For the NACA 0012 airfoil, Prouty (1986) suggests that this be approximated by

[ 12.5(M — 0.74)3 for M > 0.74

ACd(M) = (5.38)

10 otherwise.

For lower Mach numbers the drag stays fairly constant (see also Fig. 7.43). As shown in Fig. 5.7, this model gives good agreement with 2-D drag measurements.

Compressibility Losses and Tip Relief

Tip relief effects can be accounted for in the blade element theory (BET) using an effective local Mach number Meff at each blade element in the tip region that exceeds the drag divergence Mach number, that is, Mr ^ > Mdd. One method suggested by Prouty (1986) is to define the effective Mach number as

Section Mach number, M

0. 005

Подпись:СЛ

0 0>

^ 0.004

5

0. 003

(D

1

CL

E

8 0.002

E 0

0. 001

о

0

0. 8 0.85 0.9 0.95 1

Advancing blade tip Mach number, M gg

where Mddi is the 2-D value of the drag divergence Mach number (i. e., from the data in Fig. 5.7) and Mdd3 is the 3-D value with tip relief. In most cases it is found from finite wing measurements that Mddb exceeds Mddi by 10-15%. The parameter ARbiade is the aspect ratio of the blade (i. e., R/c). Equation 5.39 is used in Eq. 5.37 to compute the relieving effects of the 3-D flow about the extreme tip of the blade.

~ ____ тт: „ с о u: л_____ ^ л _________________ ~ _

1 lie lCSUllS 111 rig. J. O S11UW 11ШІ ill lllgn ilUViUlWlllg up IVlilWll UUUIUCIS uic piunic puwci

increases rapidly, although it is offset to some extent by tip relief effects. It would appear that the corrections suggested by Gessow & Crim (Eq. 5.30) and Harris (Eq. 5.31) give reasonable results bearing in mind the relative simplicity of these equations. Notice that Mdd is also a function of AoA of the airfoil section (see Chapter 7) and the thrust on the rotor. The relationship between Mdd and the rotor mean lift coefficient can be approximated empirically – see Stepniewski & Keys (1984) and Prouty (1986). The effects of a swept tip serve to further modify these results, but can be accounted for approximately by using an incident Mach number that is normal to the leading edge of the blade. In such a case the incident Mach number is

Mr<f — Mqr (г + д sin V0 cos A, (5.40)

where A is the local sweep angle. See also Section 6.4.6 on swept tips.

Forward Flight Performance

For a helicopter in forward flight, the total power required at the rotor, P, can be expressed by the equation

P = Pi + P0 + Pp + Pc, (5.17)

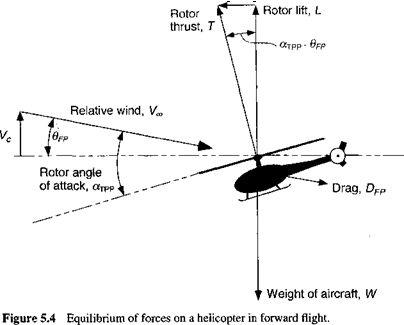
where P, is the induced power, Po is the profile power required to overcome viscous losses at the rotor, Pp is the parasitic power required to overcome the drag of the helicopter, and Pc is the climb power required to increase the gravitational potential of the helicopter. Consider the equilibrium of forces on a single rotor helicopter in a climbing forward flight situation, as shown in Fig. 5.4. In the figure 6pp is the flight path angle, so that for small angles the climb velocity, Vc = Vqqврр. For small angles, satisfying vertical equilibrium gives the equation

Подпись:Подпись: (5.19)

Forward Flight Performance

T cos(ofxpp — ®fp) — W ^ T.

Satisfying horizontal equilibrium leads to T sin(ofxpp — Opp) = Dpp cos 6pp.

Assuming Dfp is independent of the angle of climb, then this latter equation simplifies to

Подпись: (5.20)

Forward Flight Performance

T (атрр — @fp) = D.

Rearranging and solving for the disk AoA, orTPP, gives

огтрр = Opp + —. (5.21)

Vv

Подпись: TV,oo«TPP = WVoo Подпись: 0Fp +

Now, consider the power to undertake a climb (and also to propel the helicopter forward). This part of the power is

The term WVC is known as the climb power, Pc. The term DVqq is known as the parasitic power, Pp, because this is energy lost to viscous effects.

5.4.1 Induced Power

It is already known from the simple 1-D momentum theory described in Chapter 2 that the induced power of the rotor, P,, can be approximated as

Pi — kT Vi. (5.23)

If the forward velocity is sufficiently high, say pc > 0.1, then the induced velocity can be approximated by the asymptotic result predicted by Glauert’s “high-speed” flight formula

given by Eq. 2.114. Therefore, the power equation can be written more simply as

Подпись: P =Forward Flight Performance(5.24)

where к is the now familiar empirical correction to account for a multitude of aerodynamic phenomena, mainly those resulting from tip losses and nonuniform inflow. The value of к cannot necessarily be assumed independent of advance ratio, but the use of a mean value between 1.15 and 1.25 is usually sufficiently accurate for preliminary predictions of rotor power requirements. The previous equation shows the origin of the constituent terms that comprise the basic power requirements of the helicopter in forward flight. Note that in coefficient form the induced power can be written as

Forward Flight Performance(5.25)

5.4.2 Blade Profile Power

Glauert (1926) and Bennett (1940) were among the first to formally establish estimates of profile power using the blade element theory. The profile power coefficient with a uniform blade chord is

Forward Flight Performance(5.26)

where U is the resultant velocity at the element and Cj0 is the profile drag coefficient of the airfoils that make up the rotor blades. The inclusion of the radial component of the velocity at the blade element means U2 = Uj + U, where Ur — QR/л cos fi. Neglecting the radial flow component Ur such that U — Ur = QR(r + /x sin if) gives

Forward Flight Performance(5.27)

Подпись: = -^(1+3/x2).

Expanding and integrating gives

(5.28)

Forward Flight Performance

The results from the analysis of Glauert (1926) and Bennett (1940) show that the profile drag can be approximated as

where the numerical value of К varies from 4.5 in hover to 5 at /x = 0.5, depending on the various assumptions and/or approximations that are made. In practice, usually average values of К are used that are independent of advance ratio. Bennett (1940) used an av­erage value of К = 4.65, while Stepniewski (1973) suggests К — 4.7. Either value will be acceptable for basic performance studies at the advance ratios typical of conventional helicopters, that is, for /x < 0.5. At higher advance ratios, experimental evidence suggests that profile power grows more quickly than given by Eq. 5.29, as shown in Fig. 5.5. This is a result of radial and reverse flow, as well as compressibility effects on the rotor.

Hovering and Axial Climb Performance

It has already been shown in Chapter 3 that the rotor power required in hover can be estimated from the equation

Подпись:

Подпись: Figure 5.1 Example showing the power required to hover versus helicopter weight for various density altitudes.

kW3/2 о /crCdQ ( 1 W3/1

P=Pi + P„ = ^== + pA(QRf ) ^==,

V^/O/i о / PM / у/Ip A

Hovering and Axial Climb Performance Подпись: (5.14)

or in nondimensional form simply as

where Cw(~ Cp) is the weight coefficient, к is the induced power factor of the rotor, C^0 is the average profile drag coefficient of the blade sections, and FM is the figure of merit of the rotor.

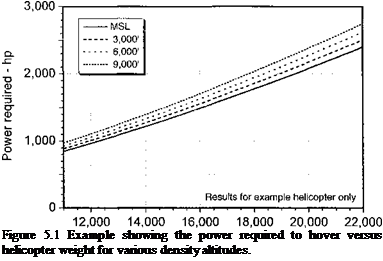
Note from Eq. 5.13 that the hover power required is a function of aircraft gross weight and ambient density. The basic effect of density altitude on hovering performance is illustrated in Fig. 5.1. The results are for a representative helicopter closely resembling the UH-60, for which the basic parameters of this aircraft are given in Table 5.2. The empty weight of

Table 5.2. Parameters for Example Helicopter

Parameter

Symbol

Main Rotor

Tail Rotor

Radius (ft)

R

27.0

5.5

Chord (ft)

c

1.7

0.80

Solidity

о

0.082

0.19

Number of blades

Nb

4

4

Tip speed (ft s”1)

Q, R

725

685

Induced power factor

к

1.15

1.15

Profile drag coefficient

cd0

0.008

0.008

1,500

Подпись:D.

sz

Ф

M 1,000

CO

>

(0

0)

5

о

Cl

(о 500

oo

0

16,0 17, the aircraft is 11,000 lb (5,000 kg). Notice from Fig. 5.1 that as much as 20% greater power will be required to hover at a density altitude of 9,000 ft versus that required at sea level conditions. The induced power factor к or figure of merit FM is not substantially affected by density altitude. While the power required to hover increases with increasing density altitude, the engine power available also decreases – see Section 5.5.5. For a reciprocating engine a reasonable approximation can be found by multiplying the power available at mean sea level (MSL) by the density ratio found at that altitude relative to MSL with a nonstandard temperature correction. For a turboshaft engine the power output at altitude follows a more complicated relationship but is approximately proportional to the atmospheric pressure ratio with a nonstandard temperature correction.

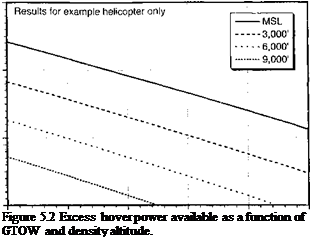
Representative results for the example helicopter that show the decrease in excess power with aircraft gross weight for various density altitudes are given in Fig 5.2. At any given altitude the decrease in excess power is almost proportional to the extra aircraft weight. The excess power available with altitude ultimately becomes zero, and this defines the hover ceiling. For a maximum GTOW of 20,000 lb (9,100 kg) the hover ceiling for the example helicopter is about 7,000 ft (« 2,100 m), which means that the aircraft cannot hover above this altitude at this weight. The helicopter, however, will be able to fly at considerably higher altitudes with some forward speed – see Section 5.5.9.

The power required for any vertical rate of climb, Vc, can be estimated by solving for the induced velocity using the momentum theory result given previously in Chapter 2, namely

Vi V – / / 2 K.

— =———— b J І —— ) + 1 ~ 1——— — for low rates of climb, p. tb)

vh 2vh)j2vhJ 2vh

where vh is the hover induced velocity. The maximum rate of climb is then obtained by solving for Vc using

^h– +1^1 + for low rates of climb, (5.16)

Ph 2 Vhf2vh) 2vh

where ДР is the excess power available over and above that required for hover. Note that the climb velocity does not depend on excess rotor thrust but on an excess of power. It will
be apparent that for low to moderate rates of climb AP ^ TVJ2, or that Vc ~ 2ДР/ W in axial (vertical) flight. Because of increased inflow through the rotor disk, higher values of collective pitch will be required in a climb. Normally it is convention in performance work for the rate of climb to be expressed in terms of feet per minute, mainly because the rate of climb indicator in the aircraft will be calibrated this way. See also Section 6.6.2 for further discussion on climb performance.

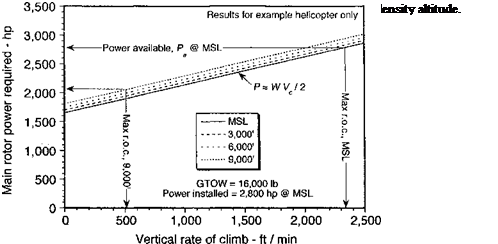
Representative results for the maximum possible climb velocity for the example heli­copter at a GTOW = 16,000 lb (7,256 kg) are shown in Fig. 5.3. Notice the significant decrease in the maximum possible climb velocity with increasing density altitude. High values of density altitude can be encountered during “hot and high” operations, and it is important for the pilot to recognize that a potentially serious performance degradation may occur under these conditions.