Category Principles of Helicopter Aerodynamics Second Edition

Inflow Model of Mangier & Squire

Подпись: A Pm ОС Гт Подпись: m — 1,3, Подпись: (3.180)

Another inflow model that has found some use in rotor analyses is that developed by Mangier (1948), Squire (1948), and Mangier & Squire (1950). The method uses the incompressible, linearized, Euler equations to relate the pressure field across the disk to an inflow. The solutions conveniently satisfy Laplace’s equation, so that the effects of different forms of loading can be combined by superposition. This theory is partially summarized by Bramwell (1976) and Stepniewski & Keys (1984). Mangier & Squire assume that the loading on the rotor disk can be expressed as a linear combination of two fundamental forms: Type-1, which is an elliptical loading, and Type-3, which is a loading that vanishes at the edges and center of the disk. The pressure loading can be written as

Inflow Model of Mangier & Squire Inflow Model of Mangier & Squire Подпись: (3.181)

with r being the distance from the rotational axis. These two pressure distributions corre­spond to extreme forms of the disk loading, which in the real case will typically comprise a

For Type-1 disk loading, the inflow is exactly linear for a = 0 and is only a weak function of a. Type-3 disk loading gives a more nonuniform distribution of inflow, with zero at the center of the disk. Both forms of the assumed disk loading give a lateral distribution of inflow that is symmetric with respect to the longitudinal axis of the rotor. Bramwell (1976) uses Glauert’s high-speed approximation to the inflow and replaces the leading 2Cr//x term in Eq. 3.181 by 4A0, where A.0 is the mean inflow from momentum theory. This implies that the Mangier & Squire theory is valid through hover, but clearly it is not because it violates the high-speed assumptions made in the original work that u, « V^. Therefore, the theory should be used only for advance ratios greater than about 0.1.

When applying Mangier & Squire’s theory, it can be assumed that the loading on the rotor is described by a linear combination of the Type-1 and Type-3 loadings, that is,

Ap = w^Api + ісзДрз, w i+i(;2=l – (3.188)

This is the main disadvantage of theory, which requires the aerodynamic loading on the rotor to be known or assumed a priori. Based on downwash measurements behind a rotor, Fail & Eyre (1954) show that the downwash behind the advancing side of the rotor corresponds to Type-1 loading, whereas from behind the retreating blade the downwash corresponds closely to Type-3 loading. It would seem, however, that at high rotor advance ratios, say greater than 0.5, the onset of reverse flow and retreating blade stall begin to invalidate these loading assumptions – see Ormiston (2004).

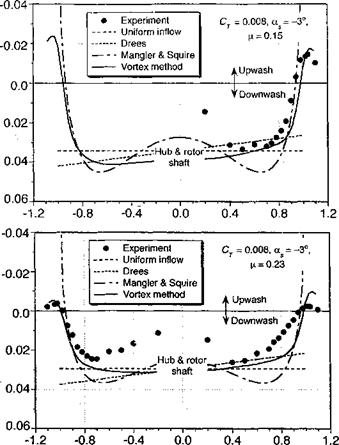
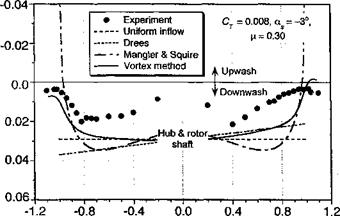
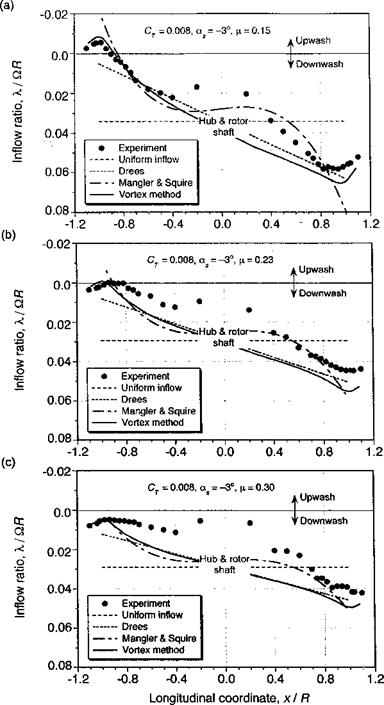
The results from the various inflow models described above are compared with inflow measurements over the rotor disk in Fig. 3.29. These data are taken from Elliott et al. (1988), which were measured one chord above the rotor plane using a LDV system. Because this experiment used both a rotor and a fuselage, the measured results cannot be considered entirely representative of an isolated rotor. The rotor was trimmed such that the TPP was perpendicular to the rotor shaft, with a forward shaft tilt, of —3° (disk AoA of 3°). Figure 3.29 shows that the inflow along the longitudinal axis of the rotor is reasonably well described by linear inflow models such as that of Drees, or with the Type-1 loading in the Mangier & Squire model. The main discrepancies are at the leading and trailing edges of the disk, and also near the rotor hub.

Using a simple average of Type-1 and Type-3 loadings (w = шз = 0.5), Mangier & Squire’s theory gives a somewhat better description of the longitudinal inflow, especially over the back of the rotor. Strictly speaking the coefficients of the Mangier & Squire theory are obtained by solving for the rotor loading (Ap) at the given trim state by means of the BET. Vortex theory (described in Section 10.7) does much better at the leading and trailing edges of the disk and agrees with the linear inflow model over the remainder of the disk. The somewhat larger discrepancies found between all of the theories and the measurements with increasing advance ratio are almost certainly a result of perturbations to the velocity field caused by the rotor hub and also the fuselage below the rotor. Because the mean rotor inflow decreases slightly with increasing advance ratio and the fuselage perturbations increase, the net effect is that a larger fraction of the total inflow is affected by the presence of the fuselage (see Section 11.2.1). Such effects are not easy to calculate but at least must be carefully recognized as a contributing factor to most rotor inflow measurements. The lateral distribution of inflow across the disk is found to be relatively uniform compared to the longitudinal variation but decreases rapidly near the edges of the disk. Outside the edges of the disk, there is an upwash velocity. Drees’s model is not unrealistic, but Mangier & Squire ’s theory gives a much better description of the inflow near the edges of the disk and agrees closely with the results from vortex theory. Again, the influence of the fuselage and rotor hub are responsible for some of the discrepancies seen between theory and experiment.

Inflow Model of Mangier & Squire

Inflow Model of Mangier & Squire

Figure 3.29 Measured variations in the longitudinal and lateral time-averaged inflow across the disk in forward flight compared to inflow models. Measurements made one chord above TPP. (a) Longitudinal inflow at /x = 0.15. (b) Longitudinal inflow at /x = 0.23. (c) Longitudinal inflow at д = 0.30. (d) Lateral inflow at /г = 0.15. (e) Lateral inflow at /X = 0.23. (f) Lateral inflow at fx = 0.30. Data source: Elliott et al. (1988).


(d)


CC

,<;

о

4-»

cc

u.

5

о

c


(e)


cc

<3


g

t5


Inflow Model of Mangier &amp;amp; Squire

(f)


cc

(3

o~

"to

5

о

4—

c


Figure 3.29 (Continued)


Inflow Model of Mangier &amp;amp; SquireInflow Model of Mangier &amp;amp; Squire

Lateral coordinate, yl R

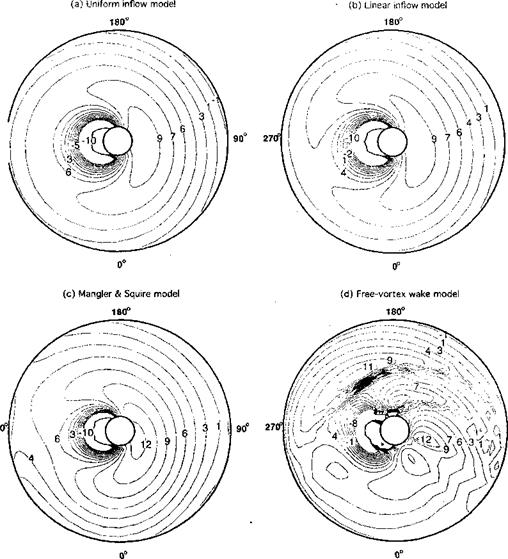
Examples of the predicted Ao A over the rotor disk in forward flight are shown in Fig. 3.30 using four levels of inflow modeling, ranging from uniform inflow to a free-vortex wake prediction (see Chapter 10). In all cases, the rotor was trimmed (see Section 4.14) to meet the same thrust requirement and to ensure that the rotor tip path plane was at the same orientation. Notice in each case the highly nonuniform AoA over the rotor disk. While there are some differences in the AoA distribution when going from a uniform to a linear inflow model, it is the Mangier & Squire model that first begins to pick up the larger nonuniformities in AoA on the retreating side of the disk. Even here, however, the differences are not large

Inflow Model of Mangier &amp;amp; Squire

Figure 3.30 Predictions of the AoA over the rotor disk in forward flight using four levels of inflow modeling, (a) Uniform inflow model, (b) Linear inflow model, (c) Mangier & Squire inflow model, (d) Free-vortex wake model. CT = 0.008, д = 0.25, as = 8°. Calculations courtesy of Shreyas Ananthan.

compared to linear inflow assumptions. The reverse flow region (see Fig. 5.9) is evident here. The free-vortex model resolves the individual tip vortices in the wake, which in this case appear as ridges of tightly packed AoA contours in the second and third quadrants of the disk (see later in Fig. 10.13). It is here that the fidelity of vortex wake models start to come into their own for blade airloads predictions, despite their much higher computational cost.

Ormiston (1972) describes a more general inflow formulation in the spirit of Mangier & Squire’s approach, where the rotor loading and inflow are solved more consistently. For a simple uniform bound circulation distribution on the blades, the inflow results appear substantially similar to those obtained with Mangier & Squire’s theory. See also Ormiston (2004). Other more recent developments of the actuator disk inflow model are described by Peters et al. (1987) and Peters & He (1989, 1995). In this theory, the acceleration potential and inflow distribution are expressed in the form of an infinite series of shape functions. When these are substituted into the incompressible, linearized Euler equations, a set of first-order ordinary differential equations are obtained. An aerodynamic loading model is required to solve the equations, which is based on a standard blade element approach. These more recent inflow methods are still in a state of ongoing development (see Section 10.9) but have been shown to give improvements in predictive capability for many rotor problems, especially those involving rotor aeroelasticity. An advantage is that they avoid the need to explicitly model the complicated nature of the true vortex wake and so are computationally less demanding than say, methods based on vortex theory.

Linear Inflow Models

A remarkable in-flight experiment to measure the time-averaged-induced velocity over the rotor disk in forward flight was made by Brotherhood & Stewart (1949). Based on measurements of the angular displacements of smoke streamers introduced upstream of the rotor, the longitudinal inflow variation was determined to be approximately linear. Some interesting aspects of the vortical wake can also be seen in the experiments [see also photo in Bramwell (1976), p. 131]. Similar results documenting the approximately linear longitudinal variation in the inflow were deduced by Heyson & Katsoff (1957). Since then, many experiments have confirmed the complicated nature of the inflow. During the transition from hover into level forward flight, that is, within the range 0.0 < д < 0.1, the induced velocity in the plane of the rotor is the most nonuniform, it being strongly affected by the presence of discrete tip vortices that sweep downstream near the rotor plane. In higher speed forward flight (pt > 0.15), the time-averaged longitudinal inflow becomes more linear and can be approximately represented by the variation

Linear Inflow Models(3.175)

which is a form first suggested by Glauert (1926) – see Fig. 3.27. The coefficient Xq is the mean (average) induced velocity at the center of the rotor as given by the standard
(uniform) momentum theory where

X,- =k0 = — CL.——- . (3.176)

2^/Wx?

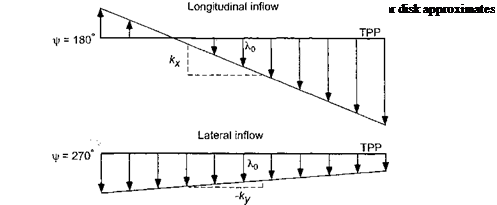
Glauert suggested that kx = 1.2, so that there is a small upwash at the leading edge of the rotor and an increase in downwash relative to the average value all along the trailing edge. This, of course, is similar to the chordwise downwash variation generated by a fixed-wing. A variation of Giauert’s result is to consider both a longitudinal and lateral variation in the inflow. In this case

Linear Inflow Models

Linear Inflow Models

1 +kx— + ky^~ ) = Ao (1 кxr cos J/ – f kyr sin fr) . (3.177)

Here kx and ky can be viewed as weighting factors and represent the deviation of the inflow from the uniform value predicted by the simple momentum theory. From experiments with trimmed rotors, it is generally found that the inflow is heavily biased toward the rear of the disk and weakly biased toward the retreating side.

Various attempts have been made to directly calculate kx (and ky). One estimate can be found using an adaptation of linear momentum theory, as described by Payne (1959) and Johnson (1980) (see also Question 3.14). Weighting factors can also be estimated using rigid cylindrical vortex wake theories – see Coleman et al. (1945) and Johnson (1980) for a summary. One approximation for kx used by Coleman et al. (1945) is

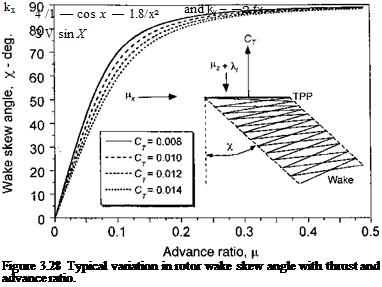
kx = tan ( ^ I, where the утке skew angle is x = tan-1 ( ——— |, (3.178)

2 / Дг+Хі/

and where )xx and iz are advance ratios defined parallel and perpendicular to the rotor disk (see Section 2.14.4 and Fig. 3.28). It is apparent that the skew angle increases rapidly with advance ratio, and for д > 0.2 the wake is relatively flat. Notice that for high-speed forward flight, kx approaches unity according to the above expression and does not represent the small region of upwash that is usually measured at the leading edge of the disk. Another parsimonious linear inflow model frequently employed in basic rotor analyses is attributed

Linear Inflow Models Подпись: (3.179)

to Drees (1949). In this model, the coefficients of the linear part of the inflow are obtained from another variation of vortex theory – see Johnson (1980) for a good summary. The inflow coefficients are given by

Drees’s model gives kx = 0 for ц, = 0, a maximum value of 1.11 at /л ^ 0.2, and Jcx slowly decreases thereafter. Like all of the other linear inflow models, Drees’s model is easy to implement in rotor analyses and gives a reasonably good description of the rotor inflow. Various other authors have suggested values for the coefficients in the Glauert model, which are summarized in Table 3.1. Payne (1959) suggests a value for kx based on the numerical results of Castles & De Leeuw (1954), which approaches 4/3 at high advance ratios, and in light of the experimental evidence appears to be one of the better representations of the longitudinal inflow distribution. Overall, the Drees (1949), Payne (1959), and Pitt & Peters (1981) models are found to give the best representation of the inflow gradient as functions of the wake skew angle and the advance ratio when compared to the experimental evidence.

Table 3.1. Various Estimated Values of First Harmonic Inflow

Author(s)

kx

ky

Coleman et al. (1945)

tan(x/2)

0

Drees (1949)

(4/3)(l — cos x — 1.8/x2)/ sin x

—2fi

Payne(1959)

(4/3)[/хД/(1.2 + АбА)]

0

White & Blake (1979)

V2sinx

0

Pitt & Peters (1981)

(15л-/23)1ап(х/2)

0

Howlett (1981)

. sin2 X

0

Blade Element Analysis in Forward Flight

For a helicopter, the rotor must provide both a lifting force (in opposition to the aircraft weight) and a propulsive force (to overcome the rotor and airframe drag) in forward flight. In – forward flight, the rotor moves almost edgewise through the air, and the blade sections must encounter a periodic variation in local velocity (Fig. 2.1). This gives rise to a number of complications in the aerodynamics of the rotor, including the effects of blade flapping, significant compressibility effects, unsteady effects, nonlinear aerodynamics, and the possibility of stall, reverse flow, and so on, and the complex induced velocity from the rotor wake (see Chapter 10). All these effects are difficult to model. However, using the BET with certain simplifying assumptions, the leading terms of the rotor aerodynamic forces can be obtained – see Chapter 4. These solutions are very instructive and also provide closed form expressions that can be used for validation or as “sanity checks” when analyzing the results from more comprehensive mathematical models of the rotor aerodynamics. The use of such checks is considered good engineering practice.

3.5.1 Determining Blade Forces

Подпись: U — Jm + Ui Подпись: U і Подпись: (3.162)

The same blade element assumptions and approximations previously used for the axisymmetric flight case can also be considered as valid in forward flight. As before, the velocity at the blade element with a pitch angle в is decomposed into an out-of-plane (perpendicular) velocity component, UP, and a tangential (in-plane) component, Up, per­pendicular to the leading edge of the blade, both relative to the rotor disk plane, as shown previously in Fig. 3.1. The resultant velocity is

because Up is generally small relative to Up over most of the blade. The relative inflow angle (or induced angle of attack) at the blade section is

Подпись:(UP Up

ф — tan 1 ( — ] ^ — for small angles.

Therefore, the aerodynamic AoA of the blade element is given by

a = в — ф. (3.164)

The resultant incremental lift dL per unit span on the blade element is given by

dL = ^pU2cCi dy = ^pUpcCia(6 — ф) dy

Подпись: (3.165)= ipt/|cCZa ^0 – dy = іpcCia{0U} – UPUT) dy

and the incremental drag is

dD = – pU2cCd dy, (3.166)

which act perpendicular and parallel to the resultant flow velocity at the section, respectively. Resolving these forces perpendicular and parallel to the rotor disk gives

1

dFz = dL cosф — dDsintj) ~ dL = – pcCia(9Uj — UpUj) dy (3.167)

and

dFx — dL sin ф + dDcoscf) & (f)dL + dD

= pcCi. (eUpUT – Uj + ^tutJ dy – (3-168)

In forward flight the blade element velocity components are periodic at the rotor rotational frequency. As for the hover case, there is an in-plane velocity component because of blade rotation about the rotor shaft, but now there is a further free-stream (translational) part such that

Ur(y, Ф) = &У + Voo sin ф = Qy + [jlQR sin ф. (3.169)

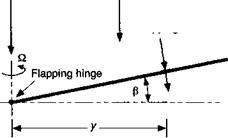
The out-of-plane component consists of three parts. The first is a component comprising the inflow velocity, as in the hover case. The other two components result from perturbations in velocity at the blade element that are produced by blade motion (i. e., flapping). With reference to Fig. 3.26, a perturbation in velocity yfi is produced as a result of the blade flapping velocity about a hinge, with another perturbation (xQRfi cos ф produced because of blade flapping displacements (coning). The origin of blade flapping is considered in detail in Chapter 4. Therefore, the velocity perpendicular to the disk can be written as

Up(y, ф) = (Ac + Xi)QR + у$(ф) + p,£lRPty)cos ф. (3.170)

Also, there is a radial velocity component parallel to the span axis of the blade and this is given by

ІІіі(ф) = /jlQR cos ф. (3.171)

In the BET the aerodynamic effects resulting from this radial velocity are neglected. This is in accordance with the independence principle of sweep, which states that the aerodynamics result only because of the velocity components and AoA perpendicular to the leading edge

Подпись: Climb velocity, Vc Induced velocity, vj (y, ^)Подпись: Figure 3.26 Perturbation velocities on the blade resulting from blade flapping velocity and rotor coning.Blade Element Analysis in Forward FlightFlapping rate induced velocity, у 6

^Direction of positive flapping

cosi|)

In-plane radial velocity, iQR cos-ф

of the blade (see discussion in Chapter 9). However, the effects of the radial velocity component along the blade may need to be considered when estimating the rotor drag.

In nondimensional form, the three preceding equations can be written as

Blade Element Analysis in Forward FlightBlade Element Analysis in Forward Flight(3.172)

(3.173)

(3.174)

3.5.2 Definition of the Approximate Induced Velocity Field

Besides accounting for the effects of blade pitch and flapping motion, the blade element method in forward flight requires an estimate of the induced velocity field, which is no longer axisymmetric. This is not known a priori because it is based on a knowledge of the rotor wake (Chapter 10), which in turn depends on the rotor thrust, the blade flapping and overall trim state (i. e., blade collective and cyclic pitch angles), and the distribution of airloads over the blades. The effects of the individual tip vortices tend to produce a highly nonuniform inflow over the rotor disk, and the calculation of these effects is a formidable undertaking. Nevertheless, the performance of the rotor can be analyzed with the aid of simpler models that represent the basic effects on the inflow resulting from the rotor wake. These models are called “inflow” models and can be formulated on the basis of experimental results or more advanced vortex theories. Because of their simplicity, inflow models have found great utility in many problems in helicopter rotor aerodynamics, aeroelasticity, and flight dynamics.

Weighted Solidities of Tapered Blades

Подпись: 3 f or2 dr = 3 f (<xo + or)r2 dr = 3 Jo Jo Weighted Solidities of Tapered Blades

The equivalent solidities for rotors with taper or other planform variation can now be computed. One must be cautious, however, in that the rotor planforms must not be too radically different. This is because the definition of weighted solidity, although based on the blade planform, has a hidden assumption in that the Q distribution over the blade is assumed to be nominally constant. If this is not the case, then the definition breaks down. Consider a linearly tapered blade that can be described by o(r) = oq + or, where oq and oj are constants. The thrust weighted solidity is given by

= cr0 + – cri = solidity at 3/4 (75%) blade radius.

The corresponding power-torque weighted solidity is given by

4 / err[17] dr = 4 / (сто + <Уг)гъ dr

Weighted Solidities of Tapered Blades

Jo Jo

= ao + – ai = solidity at 4/5 (80%) blade radius.

Similar results can be obtained for blades with taper extending only over part of the span (see Question 3.12). In this case, the integral for the equivalent weighted solidity must be split into two parts, where the inboard portion of the blade has a constant chord cr from the root to a point r = rі (i. e., where a = ar) and then a linear taper from Г] to the tip at r = 1 where the chord is ct (i. e., a = ^^£77) (r — 1) + a,). Then for this blade the equivalent thrust weighted solidity is given by

Подпись: ae = (ar - <jt)r +Подпись: + ort.Weighted Solidities of Tapered Blades(3.157)

3.4.6 Mean Lift Coefficient

Another parameter that is useful in rotor analyses is the mean lift coefficient, Cl. The mean lift coefficient3 is defined to give the same thrust coefficient as

Подпись:Подпись: (3.159)Ct = f ar2ci dr

when the entire blade is assumed to be operating at Q = Cl – Thus,

CT = і f crr2CL dr = }-Cl f err2 dr = aCL 2 Jo 2 Jо o

Подпись: CL =6 Подпись: Cr о Подпись: = C[aa. Подпись: (3.160)

or simply that the mean lift coefficient is

Therefore, the quantity Cl/Ci0 can be viewed as a mean AoA of the blades, a. Because the values of blade loading coefficient, Cj jcs, for a contemporary helicopter rotor will vary between 0.08 and 0.12, it is found that Cl is the range 0.5 to 0.8, and so a for hovering flight will vary from about 5 to 8 degrees. Remember that, like the weighted solidity factors, the mean lift coefficient is derived on the basis of uniform Q. In practice, however, for any rotor an estimate of the mean lift coefficient remains a good overall indicator of the average working state of the blades.

Weighted Solidities of Tapered Blades Подпись: , з cdo 1 к H = 4 CL Xh Подпись: (3.161)

Based on the simple corrected momentum theory developed in Chapter 3, notice that the figure of merit can be written in terms of Cl as

which simply confirms what is known all along, in that the use of airfoils with a high average lift-to-drag ratio is required for good hover performance (see also Question 3.7).

Weighted Solidity of the Optimum Rotor

With the optimum taper distribution, the profile power coefficient can be estab­lished. However, to do this properly we must compare the results at the same weighted solidity. In terms of thrust weighted solidity, cre, the optimum planform leads to

oe = 3 J or1 dr — 3 J ^-^-^r2 dr =-atip. (3.154)

Weighted Solidity of the Optimum Rotor Подпись: (3.155)

The profile power coefficient at the same weighted solidity is now

which is about 11% lower than for a rotor with rectangular blades. The figure of merit for the optimum rotor becomes

Подпись: C

Weighted Solidity of the Optimum Rotor Подпись: (3.156)

3/2

which is a good 2-5% higher than for a rectangular rotor with ideal twist, and this difference can translate into substantial payload gains (see Question 6.8).

Power-Torque Weighted Solidity

Power-Torque Weighted Solidity

The rotor power or torque coefficient can be written as

Assuming constant C(i and uniform inflow then the equivalent power-torque weighted solidity is

Подпись: оe =Подпись:Power-Torque Weighted Solidity(3.152)

The torque weighted solidity is analogous to the activity factor used in propeller design. It is also used in wind turbine design but rarely in helicopter design. Again, McVeigh & McHugh (1982) suggest a modification to the weighted solidity if swept tip blades are used so that

ae — 4 f o(r)r3 cos2 A(r) dr. (3.153)

Jo

Mean Wing Chords

For a fixed (nonrotating) wing, the lift L on the wing of area S and total lift coefficient Ci is given by

Mean Wing Chords(3.142)

where Ci is the local section lift coefficient, c is the local chord, and s is the semi-span – see Houghton & Carpenter (1993). We note that the wing area can be written as
where c is known as the standard mean chord or the geometric mean chord. Using this definition then

Mean Wing Chords(3.144)

If an ideal, elliptically loaded wing with elliptical chord is assumed, then Q is constant along the wing, and so Q = Cl. This gives

Mean Wing Chords(3.145)

which is the usual definition of mean chord used for fixed wings.

3.4.1 Thrust Weighted Solidity

Now consider the rotor case. The rotor-thrust coefficient can be written as

Mean Wing Chords(3.146)

Assuming constant Q, as in the case of the fixed wing, gives

Mean Wing Chords(3.147)

Подпись: Jo or the equivalent chord is Подпись: ae = 3 I o(r)r2 dr
Подпись: (3.148)

Therefore, based on this assumption the equivalent thrust weighted solidity is

Mean Wing Chords(3.149)

This parameter takes into account the primary aerodynamic effect of varying planform, weighting the effects at the tip more heavily than stations further inboard. McVeigh & McHugh (1982) suggest a modification to the weighted solidity definition to take account of tip sweep. In this case, Eq. 3.148 is modified to read

Mean Wing Chords(3.150)

where cr is now measured perpendicular to the local 1/4-chord line and A is the local s weep angle of the 1/4-chord from the blade reference axis. The proper validity of this latter expression, however, has not been confirmed.

Equivalent Blade Chords and Weighted Solidity

For blades that are nonrectangular in planform the local solidity cr(r) varies along the blade span. In this case, to find the thrust coefficient we must use

Equivalent Blade Chords and Weighted Solidity(3.140)

where the local solidity of the blade appears inside the integral sign. Because the chord varies along the blade span, then the rotor solidity must be written as

Equivalent Blade Chords and Weighted Solidity(3.141)

Equivalent Blade Chords and Weighted Solidity

As discussed by Gessow & Myers (1952), the purpose of weighted solidities is to help compare the performance of several rotors that may have different blade planforms, for example, rotors with different amounts of taper. The main idea is to generate an equivalent rectangular rotor blade that takes into account the fundamental aerodynamic effects of varying blade chord. The concept, however, is not applicable strictly when applied to other than simple planform shapes. The weighted solidity concept is similar to the mean geometric and aerodynamic chords used in fixed-wing analysis, where an equivalent rectangular wing is derived. In helicopter analyses, two forms of weighted solidities may be used, namely, thrust weighted solidity and power (or torque) weighted solidity. Before defining these quantities, it is instructive to recall the concepts of mean chords used in fixed-wing analyses.

Compressibility Corrections to Rotor Performance

Compressibility Corrections to Rotor Performance Подпись: (3.132)

The assumption that the lift-curve-slope of the blade airfoil sections and the drag coefficients are independent of Mach number is questionable. To examine the effects of compressibility on Cj, consider a correction to the lift-curve-slope of each blade element according to Glauert’s rule in which

We see that as Mtjp -> 0 then К -> 1 and the incompressible result given previously in Eq. 3.64 is obtained. If it assumed that an averaged compressible lift-curve-slope can be used for the entire rotor then

Подпись: (3.139)QJ Af=0.1

уі-^Мар)2’

where re is an effective radius. It can be shown that re = 1 /л/2 = 0.707 when Mtip —> 0, increasing to a value of re = 0.75 for A/tip = 0.8. This is in close agreement with Payne

(1959) , who suggests using an effective lift-curve-slope at 70% radius, which is probably accurate enough for Mtip < 0.6. Peters & Ormiston (1975) suggest using the value of the lift-curve-slope at 75% radius, which is realistic for the normal operational tip Mach numbers of most helicopters. Generally, the effects of compressibility will increase the rotor thrust coefficient by about 10% for a given collective pitch setting. However, tip relief effects (a 3-D effect) tends to reduce these compressibility effects somewhat (see discussion in Section 5.4.3).

Compressibility effects become more important for helicopter rotors when they are operated in forward flight, and especially where the advancing blade tip Mach numbers approach transonic conditions. In forward flight conditions, the idea of a mean lift-curve – slope corrected for compressibility becomes less applicable, and compressibility corrections must be included inside the thrust integral and for other quantities – that is, compressibility modeling must be considered separately at each blade element, and the net effect is obtained by numerical integration. This is the essence of the approach used in nearly all forms of modern helicopter analysis.

Further Comparisons of BEMT with Experiment

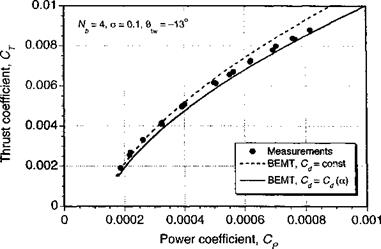
Results showing predictions made by the complete BEMT with measured thrust and power data for a hovering rotor are given in Fig. 3.23 for a four-bladed rotor of solidity

0. 1 and with — 13 degrees of linear blade twist. Compared to the modified momentum theory, now only a model for the profile drag losses must be assumed; all the induced losses resulting from nonuniform inflow and Prandtl tip losses are now calculated directly from the more complete BEMT method. Figure 3.23 shows that with the assumption that Cd — constant, the more complete BEMT underpredicts the power, and consequently it will

Further Comparisons of BEMT with Experiment

Figure 3.23 Comparison of the BEMT with and without higher-order profile drag terms versus measured thrust and power data (performance polar) for a four-bladed hovering rotor. Data source: Bagai & Leishman (1992).

Подпись:0.01

к 0.008

О

§ 0.006 іВ о

" 0.004

СО

ІЗ

г—

Ь 0.002

о

Power coefficient, Ср

tend to overpredict the figure of merit. The addition of the higher-order drag terms using Eq. 3.115 rectifies this, and the agreement with the measured data is much better.

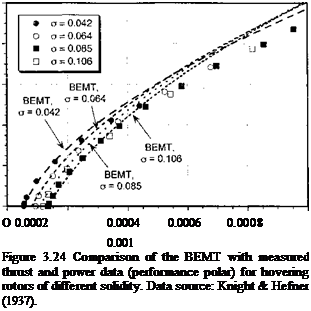
Figure 3.24 shows a comparison of the complete BEMT with the measurements of thrust and power for a hovering rotor made by Knight & Hefner (1937). Again, the higher – order drag curve using Eq. 3.115 gives good agreement with the measurements. The only discrepancy is at higher values of Cj (> 0.005) where the rotor begins to stall and Eq. 3.115 is insufficient to model the drag behavior. There are also some additional effects of elastic blade twist here, which tend to twist the blade nose-down at the higher blade pitch angles and so aerodynamically offload the tip region.

Measurements of thrust and power in the axial climb condition are relatively rare. Flight test results have been given by Gustafson & Gessow (1945) and others, although it is difficult to estimate fuselage vertical drag and also to separate wake distortion effects resulting from the fuselage from the measured rotor thrust and shaft power in flight tests. These factors make comparisons of flight test results with the BEMT relatively difficult. Such issues are reviewed by Harris (1987), but as Prouty (1986) and others have shown, reasonable climb performance estimation can be expected from the momentum theory if appropriate empirical corrections are taken into account.

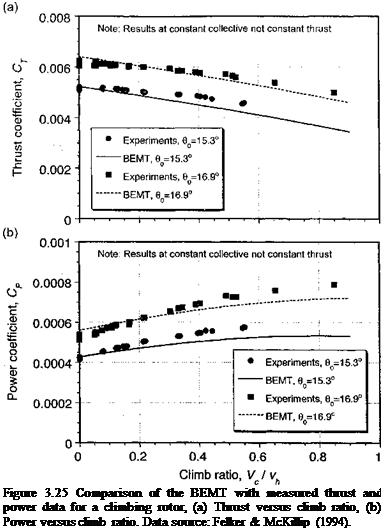
Felker & McKillip (1994) have measured isolated rotor performance on subscale rotors tested on a track facility. The thrusting rotor was mounted horizontally on a carriage and moved at constant velocity in still air, thereby simulating a steady climb. The thrust and power were measured with a balance system for constant collective pitch at several axial climb velocities. The measured thrust and power coefficient as a function of climb velocity, kc/Xh or Vc/Vh, are shown in Fig. 3.25 and are compared with results obtained using the BEMT. Because data were acquired at a constant collective pitch, increasing climb velocity reduces the blade element angles of attack resulting in a decrease in rotor thrust. Notice that although the BEMT predicts the thrust behavior well, it tends to underpredict the thrust somewhat at the higher climb velocities. For the lower collective pitch, the maximum underprediction is about 7%; and at the higher collective pitch it is about 4%. Because estimated uncertainties in the measurements are about 5%, the agreement of the BEMT with the measurements can be considered good. The corresponding predictions of power

Подпись: Figure 3.25 Comparison of the BEMT with measured thrust and power data for a climbing rotor, (a) Thrust versus climb ratio, (b) Power versus climb ratio. Data source: Felker & McKillip (1994).

are shown in Fig. 3.25(b), where the climbing work done by the rotor, CtK, has been added to the measurements. Again the agreement between the BEMT and experiment is good, except at the higher climb velocities where there is a maximum underprediction of no more than 10%.