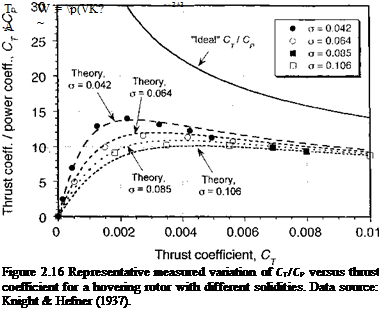
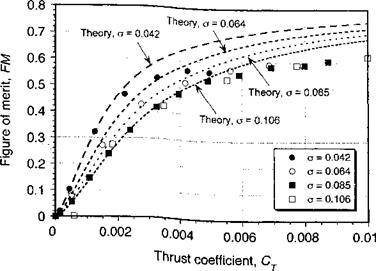
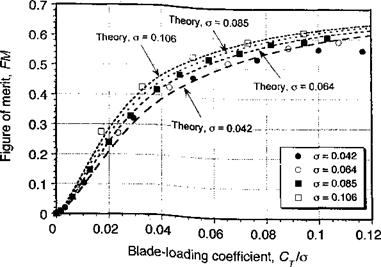
It is often necessary to estimate values for the induced power factor, к, and the average profile drag coefficients of the blades, Cdo, from rotor thrust and power measurements. These values are then used in various performance estimations. This can be done given measurements of CT and C pin sufficient quality and quantity, these normally being made by testing an isolated rotor (i. e., without the airframe) on a hover tower when the rotor is high enough off the ground to be free of ground interference effects. It has been shown that the result in Eq. 2.43 gives a good representation of hover performance, that is,
A tilt-rotor aircraft has a gross weight of 45,000 lb (20,400 kg). The rotor diameter is 38 ft (11.58 m). On the basis of the momentum theory, estimate the power required for the aircraft to hover at sea level on a standard day where the density of air is 0.002378 slugs ft-3 or 1.225 kg m~3. Assume that the figure of merit of the rotors is 0.75 and transmission losses amount to 5%.
A tilt-rotor has two rotors, which are each assumed to carry half of the total aircraft weight, that is, T = 22,500 lb. For each of the rotors, the disk area is, A = 7t(38/2)2 = 1134.12 ft2. The induced velocity in the plane of the rotor is
The ideal power per rotor will be Tvt — 22,500 x 64.56 = 1,452,600 lb ft s-1. This result is converted into horsepower (hp) by dividing by 550 to give 2,641 hp per rotor. Remember that the figure of merit accounts for the aerodynamic efficiency of the rotors. Therefore, the actual power required per rotor to overcome induced and profile losses will be 2,641/0.75 = 3,521.5 hp, followed by multiplying the result by two to account for both rotors, that is, 2 x 3,521 = 7,043 hp. Transmission losses account for another 5%, so that the total power required to hover is 1.05 x 7, 043 = 7,395 hp.
The problem can also be worked in SI units. In this case, Г = 10,200×9.81 = 100,062N. The disk area is, A = тг(11.58/2)2 = 105.32 m2. The induced velocity in the plane of the rotor is
The ideal power per rotor will be Tvi — 100,062 x 19.69 = 1,970.2 kW. The actual power required per rotor to overcome induced and profile losses will be 1, 970.2/0.75 = 2,626.9 kW followed by multiplying the result by two to account for both rotors, that is, 5,253.8 kW. Transmission losses mean that the total power required to hover will be 5,515.7 kW.

|
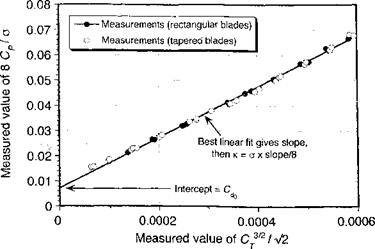
Figure 2.10 Method used to determine the induced power factor and average profile drag coefficient from rotor thrust and power measurements. Data source: Althoff & Noonan (1990).
|
|
In Chapter 1, the primitive helicopter built by Paul Cornu has been described. Each rotor of his machine was approximately 19.7 ft in diameter and the machine had a net gross weight (with pilot) of about 575 lb. Cornu claimed from experiments that 13 hp was required for the rotors to lift this weight. Use momentum theory to verify the power requirements for flight free of the ground.
Assuming each rotor lifted half of the total aircraft weight, then the momentum theory gives a result for net minimum possible power (or ideal power) required to drive both rotors using
0 
2((W/2)W
ideal_4 -ДрА )’
where the total take-off weight W — 575 lb and where each rotor had a swept disk area, A = 304 ft2. Assuming sea level air density, this gives the ideal shaft power (in horsepower) required to drive both rotors of Cornu’s machine as
Therefore, an installed power of at least 14.7 hp would be required for free flight, but only if the rotors were aerodynamically 100% efficient and there were no transmission
losses. Realistically, with the primitive types of rotors used by Cornu, we could expect the aerodynamic efficiency of the rotors to be no more than 50% (a figure of merit of 0.5) and so leading to a power required of about 30 hp. Remember that Cornu also used an inefficient belt and pulley system to drive the rotors from an engine that produced only 24 hp. Therefore, taking into account the aerodynamic efficiency of the rotors and with a conservative estimate of transmission losses, for Cornu to hover his machine free of the ground the installed power required would need to have been about 40 hp. Using an engine with a power output of only 24 hp it is highly unlikely that Paul Cornu’s machine ever flew freely in sustained flight, even when accounting for the benefits of ground effect (see Section 5.8) and discounting the losses in efficiency that would be encountered with the slippage of the belt transmission.
There are several difficulties in defining an efficiency factor for a helicopter rotor because many parameters are involved, such as disk area, solidity, blade aspect ratio, airfoil section characteristics, and tip speed. The power loading parameter discussed previously is one measure of rotor efficiency because a helicopter of a given weight should be designed to hover with the minimum power requirements; that is, the ratio T/P should be made as large as possible. However, the power loading is a dimensional quantity and so a standard nondimensional measure of hovering thrust efficiency called the figure of merit has been’ adopted. This quantity is calculated using the simple momentum theory as a reference. The ideas of a figure of merit were first introduced by Renard (1903) and Glauert (1935), but it was introduced in its present form during the 1940s by Richard H. Prewitt of Kellett Aircraft. The figure of merit is equivalent to a static thrust efficiency and defined as the ratio of the ideal power required to hover to the actual power required, that is,
Ideal power required to hover
FM = ——– f^—— ———————— <1- (2.44)
Actual power required to hover
The ideal power is given by the simple momentum result in Eq. 2.34. For the ideal case, the figure of merit must always be unity because the momentum theory assumes no viscous losses; hence the ideal power is entirely induced in origin. In reality, viscous effects manifest as both induced and profile contributions, and these are always present in actual power measurements. Therefore, for a real rotor the figure of merit must always be less than unity.
The figure of merit or FM can be used as a gauge as to how efficient a given hovering rotor is in terms of generating thrust for a given power. However, to qualify this, it should only be used as a comparative measure between two rotors when the rotors are also compared at the same disk loading, a point made again later. The figure of merit can also be written as
where the measured value of power coefficient, C/>meas, will include both induced effects and all of the other “nonideal” physical effects that have their origin from viscosity.
A representative plot of measured figure of merit versus rotor thrust is shown in Fig. 2.8. It will be apparent that the FM reaches a maximum and then remains constant or drops off slightly. This is because of the higher profile drag coefficients (> C^) obtained at higher rotor thrust and higher blade section AoA. For some rotors, especially those with less efficient airfoils, the curve can exhibit a peak in FM, followed by either a progressive or abrupt decrease thereafter. Therefore, the FM behavior in the high thrust range will, to some extent, be a function of airfoil shape and airfoil stall type (i. e., gradual or abrupt – see Section 7.9). In practice, FM values between 0.7 and 0.8 represent a good hovering performance for a helicopter rotor. State-of-the-art rotors may have figures of merit approaching 0.82 (see Fig. 6.2), although this probably represents the upper limit for a helicopter rotor with conventional technology.
Using the modified form of the momentum theory with the nonideal approximation for the power, the figure of merit can be written as
c3/2
 
kC3t/2 oCb
V2 8
(2.46)
with the results being shown in Fig. 2.8. Notice that at low operating thrusts the figure of merit is small. This is because in Eq. 2.46 the profile drag term in the denominator is large compared to the numerator. As the value of CT increases, however, the importance of the profile power term decreases relative to the induced term and FM increases. This continues until the induced power dominates the profile term and the figure of merit will begin to approach a value of 1/k, which is shown more clearly in Fig. 2.9. In practice, however, the profile drag contribution decreases this value somewhat. Therefore, the FM curve reaches a firm plateau region, which represents the maximum attainable FM of the rotor. In practice, at higher values of rotor thrust the profile drag (and power) increases quickly as the blade begin to stall, which will again cause a reduction in FM.
It has been mentioned that to be meaningful the figure of merit must only be used as a gauge of rotor efficiency when two or more rotors are compared at the same disk loading. This is because increasing the disk loading, DL (= T/ A) will increase the induced power relative to the profile power, producing a higher figure of merit and a potentially misleading comparison between two different rotors. This can be seen if the figure of merit is written dimensionally as
Therefore, it would be considered inappropriate to compare the values of the figure of merit of two rotors with substantially different disk loadings because the rotor with the higher disk loading will generally always give the higher figure of merit, all other factors being equal (i. e., it would not be meaningful to compare the values of FM of a helicopter rotor with its relatively low disk loading to a tilt-rotor with its much higher disk loading). Therefore, caution should always be exercised in the use of FM as a means of comparing the efficiency of different rotor systems.
In terms of coefficients it is apparent that the ideal power according to the simple momentum theory can be written as
 
/ґ 0^74
Figure 2.7 shows a comparison of the simple momentum theory with thrust and power measurements made for a hovering rotor using Eq. 2.37. Notice that the momentum theory underpredicts the actual power required, but the predicted trend that Cp ос Сът/2 is essentially correct. These differences between the momentum theory and experiment occur because viscous effects (i. e., nonideal effects) have been totally neglected so far.
2.4 Nonideal Effects on Rotor Performance
In hovering flight the induced power predicted by the simple momentum theory can be approximately described by an empirical modification to the momentum result in Eq. 2.34, namely
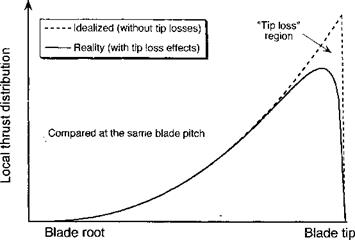
where к is called an induced power correction factor or just an induced power factor. This coefficient is derived from rotor measurements (see Section 2.9) or flight tests and it encompasses a number of nonideal, but physical effects, such as nonuniform inflow, tip losses, wake swirl, less than ideal wake contraction, finite number of blades, and so on. For preliminary design, most helicopter manufacturers use their own measurements and experience to estimate values of к, a typical average value being about 1.15. Values of к can also be computed directly using more advanced blade element methods (see Chapters 3 and 10), where the effects of the actual flight condition can be more accurately represented. This is
   particularly important for high-speed forward flight, where the increasing nonuniformity of the inflow from reverse flow on the retreating blade must be accounted for. particularly important for high-speed forward flight, where the increasing nonuniformity of the inflow from reverse flow on the retreating blade must be accounted for.
Wake swirl effects serve to reduce the net change of the fluid momentum in the vertical direction and they will decrease the rotor thrust for a given shaft torque (power supplied) or will increase the rotor power required to produce a given thrust. Johnson (1980) shows that as a result of wake swirl the induced power is increased by a factor [1-f Ct ln(Cy /2) – b CV/2]-1; this is less than 1% at the values of Су typically found on helicopters and can be neglected as a contributor to rotor power requirements. However, see also the discussion of wake swirl in Section 3.3.6.
Proper estimates for the profile power consumed by the rotor requires a knowledge of the drag coefficients of the airfoils that make up the rotor blades; that is, a strip or blade element analysis is required. The airfoil drag coefficient will be a function of both Reynolds number, Re, and Mach number, M, which obviously vary along the span of the blade. A result for the profile power, Pq, can be obtained from an element-by-element analysis of sectional drag forces (i. e., the blade element method – see Chapter 3) and by radially integrating the sectional drag force along the length of the blade using
P0 = QNb f Dydy, (2.39)
Jo
where Nb is the number of blades and D is the drag force per unit span at a section on the blade at a distance у from the rotational axis. The drag force can be expressed conventionally as
D = f>U2cCa = ір(ад2сС,, (2.40)
where c is the blade chord.. If the section profile drag coefficient, Q, is assumed to be constant (= Cdf) and independent oiRe and M (which is not an unrealistic first assumption), and the blade is not tapered in planform (i. e., a rectangular blade), then the profile power integrates out to be
P0 = – pNbtfcC^R4.
Converting to a standard power coefficient by dividing through by pA(QR)3 gives
(Nbcr _ 1
7TR)Cdo 8
The grouping NbcR/A (or Nbc/nR) is known as the rotor solidity, which is the ratio of blade area to rotor disk area and is represented by the symbol a. Typical values of a for a helicopter rotor range between 0.05 and 0.12, and much use of this solidity parameter is made throughout this book.
Armed with these estimates of the induced and profile power losses, it is possible to recalculate the rotor power requirements by using the modified momentum theory result that
r3/2 r
Cp = CPi + CPo = K-±- + (2.43)
These alternative results are also shown in Fig. 2.7, as denoted by the “modified theory,” which has been calculated by assuming Cd0 = 0.01. In the first case, it has been assumed that к = 1.0 (ideal induced losses), and in the second case, к = 1.15 (nonideal losses).
The value of cr for this particular rotor is 0.1. Notice the need to account for nonideal induced losses to give agreement with the measured data. The overall level of correlation thus obtained gives considerable confidence in the modified momentum theory approach for basic rotor performance studies, at least in hover.
| | | |
![]()
![]()
![]()


