Category Propellor Aerodynamics

Centreline Thrust

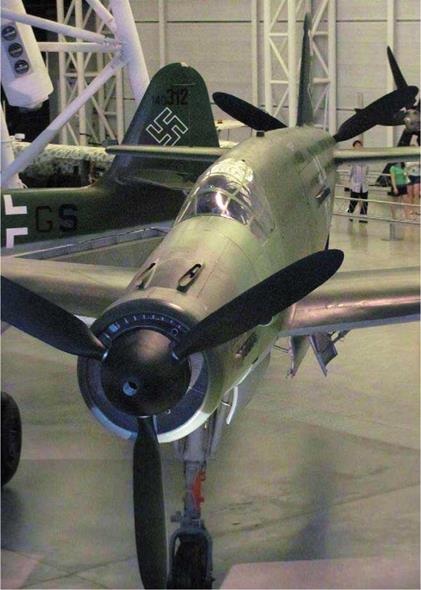
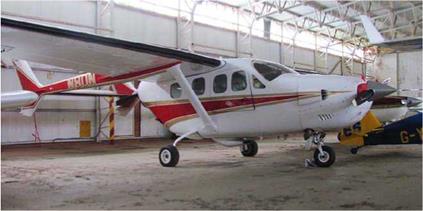
Aircraft with centreline thrust have two piston-engines mounted in tandem on the aircraft’s centreline. The loss of one engine alleviates the asymmetric thrust condition associated with twin-engine aircraft with wing-mounted engines. Cessna used the push/pull configuration on their twin-engine Cessna 336/337 Skymaster, with an engine mounted at each end of the fuselage pod. It is more commonly known as a centreline thrust configuration. The first aircraft with centreline thrust was designed and patented by Claudius Honore Dornier (1884-1969) a German airplane designer and manufacturer. One of his more famous designs, in the 1940s was the Dornier Do 335 Pheil (Arrow) heavy fighter with two piston-engines mounted at each end of the fuselage in the centreline thrust configuration. The aircraft arrived too late in WW II to see active service.

Minimum Control Speed (Vmc)

The minimum control speed (VMC) is the speed at which a multi-engine aircraft can fly with a failed engine and still maintain directional control.

The VMC speed is determined by the force from the rudder required to maintain directional control to counteract the yaw force caused by an engine failure. Below the VMC speed, rudder authority is reduced and the aircraft will yaw and diverge from the required heading. It was mentioned above: a twin-engine aircraft with both propellers rotating in the same direction has the greatest yaw force with the critical engine failed. To be precise, there are two different air speeds at which the rudder fails to maintain directional control: there is a VMC for each engine. However, the higher of the two air speeds is taken as the operational VMC. Aircraft with counter-rotating propellers have the same amount of yaw force with either engine failed, therefore, the VMC is the same when either engine is failed.

The term VMCA applies to the minimum engine failure control speed when the aircraft is airborne. The VMCA should be no higher than 1.2 times the stalling speed. The term VMCG defines the minimum control speed on the ground, and it must be lower than the take-off decision speed (V1) to ensure directional control can be maintained following an engine failure.

Gyroscopic Effect

Any spinning mass, the propeller included will be affected by gyroscopic rigidity and precession. Rigidity is the tendency of the spinning mass to remain with its axis in a fixed position relative to space and to resist any force that tries to move it.

If an applied force succeeds in displacing the spinning mass, the resulting movement is known as gyroscopic precession, which acts as if the force was applied at a position 90° around the plane of rotation from the applied force. Tail-wheel aircraft are more prone to instability problems on take-off or landing than a nose-wheel aircraft due to the gyroscopic effect caused by the inclined prop shaft.

Consider a tail-wheel aircraft with a right-hand propeller, as the tail is raised during the take-off run, it acts as if a force is being applied to the top rear of the propeller causing it to tilt forward. However, because of precession, the propeller acts as if the force had been applied to the rear right-hand rear side of the propeller disc, causing the aircraft to turn to the left. The gyroscope force affects all propeller-driven aircraft whenever the propeller axis is forced to tilt. An increase in propeller weight, RPM, diameter, and the rate of pitch, roll and yaw movements will cause greater gyroscopic effect, which can be quite noticeable during in-flight maneuvers. During a steep turn to the left, a right-handed propeller will cause the plane’s nose to initially rise, and a steep turn to the right will cause the nose to drop. Therefore, pitching the nose up produces a right

Gyroscopic Effect

The Dornier Do-335 Pheil is a WW II centre-line thrust
aircraft. Two Daimler-Benz V-12 piston engines of 1750 BHP
each drive three-blade feathering props. This sole example is
located in the Udvar-Hazy Centre, Chantilly, Virginia, USA.

yaw, whilst a nose-down pitch will cause a left yaw. Hence, the need to apply rudder to maintain balance during maneuvers.

In a sideslip maneuver, ‘P’ factor causes a pitching moment and the nose may rise or drop depending on prop RPM, direction of rotation and direction of yaw.

Spinning maneuvers can be adversely affected due to the greater rate of pitch, roll and yaw. The nose attitude in the spin can be either flattened or pitched down further. This will depend on the aircraft type, the control surface movements and if the aircraft is in an inverted spin, or not. Other factors such as the aircraft weight, centre of gravity location, aerodynamic or centrifugal forces, can all affect the spin behavior. The pitch – up during a spin to the right will intensify the right yawing and rolling moments, resulting in a faster rate of spin with a steeper nose attitude. Conversely, a spin to the left will be flatter due to the nose being raised by the prop’s precession force associated with left yaw. A flat spin with its greater angle of attack is always harder to recover from than a steep, nose-down spin. Getting the nose down to reduce the angle of attack and throttling back the engine are prerequisites to spin recovery. Having the power on during the spin can cause adverse affects, due to the uneven alignment of the propwash flowing over the outer wing (due to yaw) creating greater lift and less drag than the inner wing, this will cause an increase in roll and yaw

In conclusion, the effect on the aircraft’s stability and its tendency to yaw to the left on take-off with a right-handed prop will depend on the propeller’s torque, ‘P’ factor, prop location and gyroscopic effect. In addition to this left yaw, the propwash could cause an opposing rolling moment to the right. On some aircraft types where the above effects can be too great a problem, the aircraft may have a contra-rotating propeller installed to eliminate, or at least, reduce some of theses undesirable effects.

Gyroscopic Effect

The Cessna 336/337 Skymaster has centreline mounted engines mounted at each end of the fuselage.

‘P’ Factor

The term P-factor (or in full, the propeller factor) is familiar to most pilots, although the term fails to explain the actual problem. The more descriptive term is asymmetric blade effect, associated to the blade element theory, which deals with the difference in thrust on the up-going and down-going prop blades . Closely related, is the asymmetric disc loading, which is associated to the axial momentum theory, and deals with the air mass flowing through the prop disc.

Due to the propeller axis being inclined to the direction of flight, one half of the propeller disc produces more thrust than the other half. Tail-dragger aircraft during take-off are more prone to P-factor than nose-wheel aircraft, due to the fact propeller thrust is greatest at high power settings and low air speed

Assuming a two-blade propeller, P-factor is caused by the difference in angle of attack and the velocity between the up – going and down-going blades, with velocity being the major factor. In straight and level flight, the propeller axis is parallel to the airflow through the propeller disc, and the angle of attack of each propeller blades remains the same. Increasing the angle of inclination of the propeller axis increases the difference in each blade’s angle of attack up to a maximum inclination of 45° . Between 45° and 90° inclination, the difference in angle of attack reduces to zero degrees. A tail-wheel aircraft sitting on the ground has its prop axis inclined to the horizontal and the

‘P' Factor

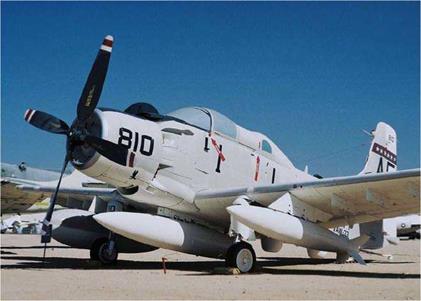
The Douglas EA-1F Skyraider with its powerful radial piston-engine driving a four-blade propeller is a prime candidate for P-factor. This Skyraider is located at the Pima Air & Space Museum, Tucson, Ar.

difference in angle of attack is relatively small at approximately V° to 1°, producing a six percent difference in lift coefficient. The up-going and down-going blades meet the airflow with a difference in velocity of around seven percent. Because the velocity is squared in the thrust (lift) formula, it has greater effect than the angle of attack, and when the propeller axis inclined, the speed ratio of both blades is different, although the forward speed and RPM, are both constant To explain this anomaly, consider the propeller axis inclined 90° to the direction of airflow, as found on helicopter main rotor blades. The helicopter’s advancing rotor blade has a constant rotational speed (RPM) plus the helicopter’s forward speed. The retreating blade has the same constant RPM minus the helicopter’s forward speed producing a difference in speed between the advancing and retreating blades. The aircraft propeller axis inclined just a few degrees, experiences a more subtle effect, but the velocity difference is still there. The down-going propeller blade having greater velocity and increased angle of attack produces more thrust on that half of the propeller disc, and is the major contributor to asymmetric disc loading, or P-factor.

Helical Propwash

As the propeller rotates, it produces thrust, drag and torque. It is the propeller’s drag component that causes the propwash vortex sheet emanating from each prop blade to be whirled around on a helical path, or corkscrew fashion. This leads to a loss in propeller efficiency of just under two percent. The slipstream, due to the aircraft’s motion through the air, will be flowing straight back over the fuselage. In effect, it can be considered as sliding over the tailplane unnoticed, whereas the helical vortex propwash will strike the tailplane in a series of pulsations. At a low air speed, the tail will experience more pulsations per unit time than at a high speed due to the vortex coils being closer together. This results in the propwash vortex sheets striking the fin and rudder at a greater angle of attack causing an increase in yaw to the left. At high air speeds the coils will be relatively elongated and the angle of attack on the tail and fin will be reduced resulting in less yaw. The rotating propwash will also strike the underside of the port main wing and stabiliser at an increased angle of attack causing an increase in lift. At the same time, the rotating propwash will strike the top surface of the starboard wing and stabiliser at a reduced angle of attack, resulting in less lift. The net result is a rolling moment, this time to the right, which under some conditions could counteract the induced yaw to the left, caused by the propwash striking the fin and rudder, thus aiding stability.

Prop Location

The decision on where to place the propeller and engine unit on the aircraft is a complex and important choice for the aircraft designer. For a single-engine aircraft should it be a tractor or pusher prop? There are many arguments for and against either layout. The Wright brothers chose pusher props on their Wright Flyer 1, and this arrangement was popular

Prop Location

The Beech 2000 Starship with twin five-blade pusher props, located at the Pima Air & Space Museum, Tucson, Ar.

with other aircraft designers that followed. One reason early types of pushers were designed as such was to keep the propeller clear of forward firing guns. The prop’s location can also affect the aircraft’s stability, which will be covered shortly. The centre of gravity range on other types determined the prop’s location and again on other types, maybe it was just the designer’s choice. Since the WW 1 era, the trend had been more towards the tractor arrangement, with a few exceptions along the way

The USAF’s Convair B36 long-range bomber must be the world’s largest pusher aircraft ever built. It is powered by six Pratt & Whitney Wasp Major R-4360 piston-engines of 3500 BHP each, driving 19-ft. pusher props. Later models had the addition of four turbojet engines to cope with an all up weight of approximately 310,000 pounds With a wingspan of 230 feet, (larger than the Boeing 747B’s span of 195 feet 8 inches) it was at the time of its introduction the world’s largest aircraft with a first flight on 8 August 1946. The futuristic looking Beech Starship 2000 introduced in 1986 as a business aircraft, is one more relatively recent pusher type. The twin Pratt & Whitney PT-6A turboprops powered pusher props are ideally located on the trailing edge of the wing, to help place the centre of gravity well aft. The Italian Piaggio P.180 Avanti is a similar aircraft in layout to the Starship and commercially, a greater success. It was introduced in the same year as the Starship – 1986 – and is still in production at the time of this writing in 2014.

The Lake Buccaneer amphibian is another pusher type of unusual design. The single pylon mounted engine above the fuselage could well have been installed as a tractor unit. Why did the designer choose a pusher arrangement? Was it for aerodynamic reasons, or maybe to keep the prop away from spray during water take-offs and landings? The majority of prop powered aircraft, with the exceptions mentioned above, are now designed and built as tractor prop aircraft, with the

Prop Location

The Convair B-36J Peacemaker, the world s largest aircraft with pusher props. It has six P&W piston engines and four jet engines! The B-36 in this photo was the last one built, in 1956. It is on show at the Pima Air & Space Museum, Tucson, Ar.

pusher design being an exception to the rule. However, I have digressed, so to continue…

The location of the propeller/engine affects the plane’s stability due to its position and the presence of the propwash. Although tractor props are more common, rear mounted pusher props enhance the stability. If the aircraft experiences a yaw for any reason or other, say to the left, the propwash will be deflected the opposite way to the right, and will pull the aircraft’s nose back to the right aiding directional stability. [Imagine the propwash acting in the same sense as the rudder]. The same effect occurs in the pitching plane with the propwash bending in the appropriate direction to raise or lower the nose, acting like the elevator. Both actions stabilise the aircraft. Conversely, the tractor prop may aid the stability but is mainly de-stabilising. If a tractor prop aircraft is induced to yaw to the left (as in the example above) the propwash will deflect to the right pulling the nose further to the left, resulting in a de-stabilising moment. Again, the same de-stabilising factor is present in the pitching plane.

Another de-stabilising condition is a combination of up – elevator and an increase in engine power. Consider an aircraft in the flare, about to touch down with the engine throttled back to idle power and up-elevator applied to hold off. The pilot then decides to make a late go-around and applies full power. The increase of propwash over the elevators causes an increase in elevator effectiveness that in turn, causing the nose to pitch up further, the result is a de-stabilising motion. On some high performance single-engine aircraft, the engine and propeller are not aligned with the aircraft’s axis but are tilted downwards two or three degrees and to the right by

Prop Location

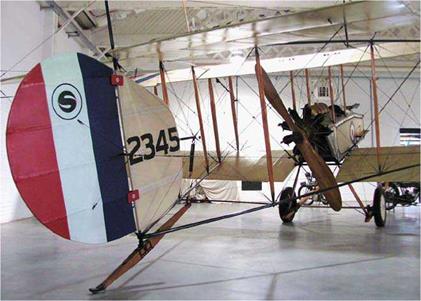
Aircraft from the WW I era used pusher props to leave the front end of the fuselage open for the gunner. This Vickers F. B.5 Gunbus is located in the RAF Hendon Museum, London.

a like amount. The degree of nose down tilt depends on the aircraft’s power loading (weight/power). When the aircraft is flying level with a nose-high attitude, as in the landing flare, the propwash inflow to the prop disc will be parallel to the direction of flight. However, on passing through the prop disc which is tilted rearwards, the propwash will be deflected downwards and in compliance with Newton’s Third Law, this reacts on the prop disc as a nose pitch-up, combined with the thrust/drag vector, all part of the four forces acting on the aircraft. By tilting the engine and prop downwards, this places the prop disc closer to being at right angles to the propwash inflow, and therefore, reduces the downward deflection of the propwash and hence, the nose pitch-up. The outcome of this is an improvement in pitch stability.

– Effect on the Aircraft’s Stability

The previous section covered propeller drag and introduced prop torque. Propeller torque is now covered in greater detail, along with its associated propwash force, precession, asymmetric disc loading, ‘P’ factor and the effect these have on the aircraft’s stability. These factors are mostly de-stabilising, however in some cases they can enhance the stability of the aircraft

Prop Torque Force

The engine torque will produce an equal and opposite torque reaction at the propeller creating a turning moment, which will tend to rotate the aircraft around its longitudinal axis in the opposite direction to the prop’s rotation. With a ‘right-handed’ prop, this will cause the aircraft to rotate or roll to the left, in accordance with Newton’s Third Law of equal and opposite reaction. This can present as a problem during take-off due to asymmetric loading on the undercarriage, where the left-hand wheel is pressed down on the runway more so than the right – hand wheel. This excess pressure results in wheel drag and in turn, causes the plane to yaw to the left. For most modern aircraft types, the effect of torque and the accompanying roll and yaw in flight can be considered negligible and is easily corrected by use of the controls. Pilots of tail-wheel aircraft, especially World War II fighters with their greater power/ weight ratios, have considerably higher torque forces to contend with. A pilot who is not ‘ahead’ of his/her aircraft with a high power/weight ratio, could experience a torque roll on take-off, or during a go-around that could end with catastrophic results. The earlier versions of the Supermarine spitfire were equipped with the Rolls Royce Merlin engine that rotated the prop clockwise, while the later versions of the

Spitfire from the Mark 12 onwards were equipped with Rolls Royce Griffon engines, which rotated the prop anti-clockwise. Pilots converting from the earlier ‘mark’ of Spitfire to the later models had to be ready to counteract opposite torque forces with the rudder pedals. The torque forces are at a maximum during full power operations such as during take-off and climb out, but the force can be considered as zero during a descent with the engine throttled back to idle setting.

Propeller Icing

Propeller icing will form on the airframe or propeller when flying in cloud or rain with ambient temperatures below 0 degrees Celsius (32 °F) down to temperatures around minus 40 degrees Celsius. Between 0 °C and minus 20 °C, icing will be most severe with glaze type of icing. From -20 °C to -40 °C rime ice will be more prevalent and below -40 °C icing is less likely to occur, but is still a possibility. Icing will form on those parts of the aircraft with relatively sharp or protruding items such as the wing’s leading edge, aerials, struts and of course, the leading edge of the propeller blades. The weight of the accumulated ice is less of a hazard than the adversely modified airflow over the prop blade. It only takes a small amount of ice to modify the shape of the blade’s leading edge and degrade performance thus causing a reduction in prop thrust and efficiency. The associated drag will reduce the rate of climb and cruise speed. In addition, if the prop has icing problems, then the wings are sure to be iced up as well. In theory, the aircraft structure should ice up before the prop blades. This is due to the blade tip’s high speed causing kinetic heating,

Propeller Icing

A USAF Convair T-29B Flying Classroom with square prop tips and de-icing boots on the props leading edges. This aircraft is stored at the Pima Air & Space Museum, Tucson, Ar.

which increases the temperature of the blades: the heat rise being approximately proportional to the square of the speed (prop RPM). The blade’s inner portions will be rotating at a slower speed than the tips and therefore, will experience less of a temperature rise due to less kinetic heating. This accounts for the electric de-icing heater mats being positioned on the inner leading edge of the blade only and not extending to the tips

Uneven accumulation or shedding of the ice will put the blades out of balance causing severe vibrations, as opposed to a rough running engine. An ‘ice plate’ may be mounted on the side of the fuselage on twin-engine aircraft in the prop’s plane of rotation, for reinforcement of the fuselage skin against shedding ice strikes. In 1934, B. F. Goodrich pioneered the system of pulsating rubber de-ice boots on the wing’s leading edge Ice protection for the prop blades followed later in the form of electric heater mats, deice boots and a chemical system. If the blade’s leading edge is rebated to take the heating element, it is then known as a ‘rebated blade’. Propellers with the electro-thermal system installed are commonly referred to as ‘hot props’. The chemical system uses Ethylene Glycol, or similar fluid, which is also used in the cooling systems of liquid-cooled engines. The de-ice fluid is dispersed via a slinger ring mounted around the prop hub inside the spinner and centrifugal force carries the fluid along the blade via the ridges in the rubber boots.

As far as the electrical and chemical systems are concerned, there is no difference between anti-ice and de-ice systems. It is all a matter of timing, anti-ice prevents and de-ice cures. If icing is expected, prevention is better than a cure, so turn on the anti-ice system early before the ice has a chance to buildup to a dangerous level. If you have the misfortune to experience

Propeller Icing

The Short Belfast T1 turboprop transport with de-iced props. This Belfast is on show in the RAF Cosford Museum, England.

prop icing with no anti-ice system on board, it maybe possible to remove the prop ice by flexing the blades using centrifugal force. This can be achieved by reducing the engine speed to around 2200 RPM with the propeller pitch control, then quickly move the prop control to fine/flat pitch. Several cycles maybe required to restore the prop to smooth running. After clearing the ice, or if icing is expected, run the engine at a higher RPM than normal to reduce the chance of ice forming. Finally, one last word on prop icing: keep the prop blades smooth and clean and apply a coating of silicone spray, it just makes it that little bit harder for the ice to cling to the blades.

Prop Blade Drag

The propeller acts like any airfoil moving through the air, it produces an aerodynamic reaction due to its shape, angle of attack and velocity. The total reaction can be divided into vector components of lift and drag. It is the drag component of interest here.

Examination of Diagram 16, Forces in Cruise Flight, shows when the prop is operating at its maximum lift/drag ratio it is producing the most lift for the least drag. It follows, the

most thrust for the least amount of engine power used (the maximum thrust/torque ratio) will also be achieved at the maximum lift/drag ratio condition. Therefore, the prop will be operating at its maximum efficiency.

With the prop advancing through the air on its helical flight path, there is an upwash of air in front of the blade and a downwash behind, the same effect that occurs on an aircraft wing. The net result of this upwash and downwash is a general downwash of the relative air flow over the blade. Because the total reaction is at right angles to the relative air flow, it will be tilted rearwards from the vertical relative to the blade element. The horizontal component of the total reaction represents the propeller’s induced drag, or to use the modern terminology, trailing vortex drag. [See Diagram 1, Airfoil Terminology].

Prop Blade Drag

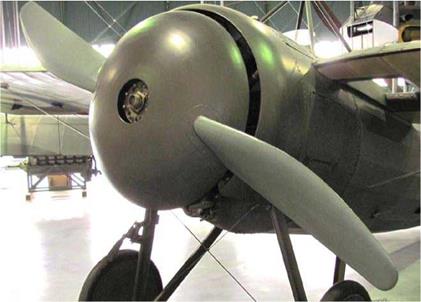
The Bristol M1c Bullet has a giant-size prop spinner looking very much like a doorbell. This aircraft is located in the RAF Hendon Museum, London.

The pressure differential between the propeller blade’s top and bottom surfaces causes the air flowing over and under the blade to meet at the trailing edge at an angle to each other known as the ‘rake angle’. This causes a vortex sheet to emanate from each prop blade. High aspect ratio blades produce a smaller rake angle and therefore less induced drag than low aspect ratio blades. This again, reflects the superior efficiency of high aspect ratio blades. The flow around the blade from high to low pressure (rear to the front surfaces) causes the tip vortex to be stronger and cause more drag than the trailing vortex sheet. A similar vortex emanates from the blade root and this rotates in the same direction as the prop, while the tip vortex rotates in the opposite direction. The helical vortex sheet flowing off each blade affects the following blade by causing a disturbance in the air flow pattern resulting in a loss in efficiency: the greater the number of blades, the greater the disturbance. Using more blades negates the advantage of greater solidity, due to the increased flow disturbance.

On an aircraft wing, the vortex drag can be reduced by using an elliptical wing planform or by using wing taper, which has the same effect. However, the planform of a propeller blade has to be designed by calculation and is not necessarily elliptical. This is due to the difference in speed between the blade’s root and tip affecting a different amount of air mass in a given time. This problem is partly alleviated by using scimitar shaped blades as found on new generation turboprop aircraft. Scimitar blades are designed with extra chord width around the 50% prop radius station. At low speed during take­off, more of the thrust is produced in this area of the blade. As the aircraft’s speed increases the major part of the thrust is produced further outboard along the curved span of the blade providing better efficiency at higher speeds where the effects of compressibility are delayed reducing drag and noise. This effect is akin to a swing-wing fighter aircraft.

Prop Blade Drag

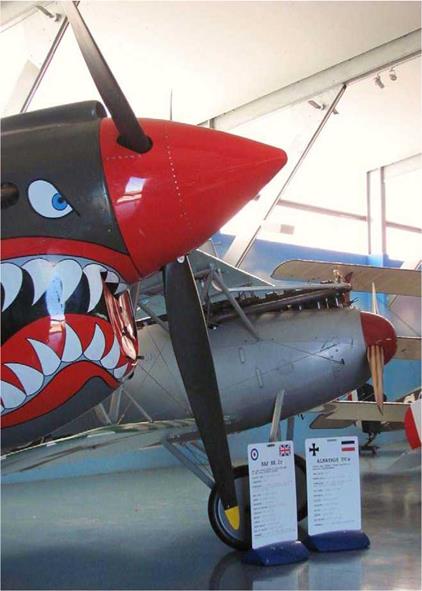
The pointed spinner of the Curtiss P-40 Kittyhawk contrasts
with the blunt spinner on the Albatross DV. a.


The propeller drag is caused not only by the blades, but also to a lesser degree, by the prop boss or shank. The blade roots, boss or shank cause profile drag due their inherent thickness. This is one reason for installing a prop spinner, to smooth the air flow over the drag producing area of the prop. At low speed ratios, the loss in efficiency caused by drag is around 10% rising to about 29% at higher speed ratios. The power required to overcome the profile drag is known as the ‘profile drag power loss’. Because aerodynamic forces are proportional to the square of the speed, it would appear obvious the thrust and torque would be at a maximum at the propeller tips where the rotational velocity is the greatest. However, this is not so. Due to tip losses caused by the spanwise flow along the blade towards the tips and also the effects of compressibility, thrust and torque values reach a maximum around the 75% prop radius station and decrease towards the tip. The blade chord is at a maximum around the 75% station for this reason, and this is the location of the minimum drag coefficient, as opposed to the maximum drag coefficient, which occurs at the blade tip due to induced drag and also at the blade root due to form drag, as mentioned above. The overall drag coefficient will remain approximately constant if the prop tips are not affected by compressibility

Sir Isaac Newton’s Third Law of motion states, “For every action there is an equal and opposite reaction”. In providing power to turn the propeller, the engine produces a torque component, which is a force acting in the same plane and direction as the propeller rotation. At a constant power setting, the engine torque is balanced by the equal and opposite force of propeller torque, in accordance with Newton’s third law. On an aircraft with a fixed-pitch propeller, the engine RPM will remain constant as long as these two forces remain in balance. A change of power setting or aircraft speed will change the value of the engine torque or propeller torque respectively. This will cause a change in the engine RPM. The same applies to a constant-speed prop but the CSU works to maintain a constant RPM masking the changes in prop or engine torque, which varies as the RPM squared. The total drag forces or torque of the propeller act through the centre of pressure of each prop blade. The prop torque can be found from the following formula:

Prop torque = kQpN2D5

Where kQ = torque

p = air density N = RPM D = Diameter

Propwash Thrust

Throughout this book we have followed along the lines of the ‘blade element theory’. At this point we diverge briefly to consider the ‘Rankine-Froude axial momentum theory’; this theory gives a clearer explanation of the energy change in the propeller’s propwash.

The marine engineer, R. E. Froude (1846-1924), introduced the idea of the prop disc, which became known as Froude’s Actuator Disc where the air mass on passing through the prop disc experiences a sudden rise in pressure without affecting the increasing the propwash velocity. The axial momentum theory assumes the prop thrust to be evenly distributed through the propeller disc, which just isn’t true. In fact the thrust varies from zero at the hub to a maximum at the 0.75 radius station and reduces again to zero at the prop tips. It must also be realised no propeller achieves the efficiency an actuator disc implies. This fact will be disregarded for the present time and it will be assumed the thrust to be evenly distributed across the prop disc, while discussing the axial momentum theory.

As the propeller rotates under normal operating conditions, it sucks air from in front of the prop disc causing a low pressure area. The air mass, known as the ‘inflow velocity’ (V1) accelerates through the prop disc into an area of increasing velocity behind the prop and experiences a rapid rise in pressure as it does so. It is the difference in pressure between the front and rear of the prop disc, caused by the change in the air mass momentum that produces thrust. The air mass now called the ‘outflow velocity’ (Vo) continues to accelerate reaching its maximum velocity some distance behind the propeller. The final maximum velocity is equal to the aircraft’s rue air speed plus double the propwash velocity (aircraft speed + 2V). It should now be obvious from the above, half of the propwash velocity increase occurs in front of the prop while the other half of the speed increase occurs behind the propeller As the speed of the propwash increases to its maximum value, the propwash also contracts to a smaller diameter than the prop disc itself, in compliance with Bernoulli’s Theorem. The point of constriction is known as the ‘Vena Contracta’. The air mass flowing through the prop disc should be considered as a three-dimensional stream tube.

The propwash velocity/aircraft velocity ratio (v/V) is known as the ‘inflow factor’ (a), which increases with an increase of propwash velocity. Propeller efficiency will be greatest when the propwash velocity is close to the aircraft’s true air speed (V), that is, the greatest efficiency is achieved at a small value of v/V. When the propwash velocity equals the aircraft velocity, the value of the inflow factor (a) is equal to one. At other speeds, where the propwash velocity is less than the aircraft’s velocity (which is the usual case) the value of the inflow factor will be less than one, which ties in with the ‘ideal efficiency’ of
the prop, where the thrust is related to aircraft’s speed and the inflow factor. The ideal efficiency, or Froude’s Efficiency, can be calculated from the formula known as the Froude’s Equation:

T x V

Ideal efficiency =

T x (V + v)

Where T = thrust factor

V = aircraft velocity v = propwash velocity

Propwash Thrust

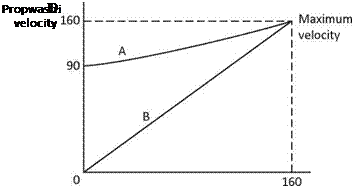
The propwash velocity (curve A) is plotted against the aircraft’s true air speed (curve B) in Diagram 15, Propwash Velocity v. KTAS. This shows the static prop thrust to be 90 knots at full throttle while the aircraft is stationary. As the aircraft accelerates, the propwash will also accelerate but not as quickly, until a point is reached where the aircraft’s velocity and propwash velocity coincide. This occurs at the maximum level flight speed of the aircraft. Stated simply, the thrust equals the mass of the air multiplied by the propwash velocity minus the aircraft velocity.

It was stated earlier, “It is the difference in air pressure between the front and rear of the prop disc that produces thrust”. However, this is only part of the story. As the aircraft travels forward, the air mass well ahead of the prop disc is assumed to be stationary; on approaching the prop disc and passing through it, the air mass accelerates and gains momentum. Thrust is a result of this change in momentum and the greater the change, the greater the thrust. Momentum is the product of mass multiplied by velocity (MV). A large mass of air flowing at a small velocity can produce the same amount of thrust as a small mass of air flowing at a high velocity. The former is the better of the two options because it requires less work to produce the same amount of prop thrust. The following can show this. The propwash gains kinetic energy (%MV2) due to the increase in momentum (MV) as it passes through the prop disc. The kinetic energy represents the work done by the prop in accelerating the air mass from zero velocity. The kinetic energy of ‘M’ slugs moving at a velocity of V feet/second is equal to %MV2 ft. lb. It can be seen the same thrust and momentum can be achieved from either one slug given 10 ft/second acceleration or, ten slugs an acceleration of one feet/second. Using the above formula (%MV2) it is shown:

1 . One slug given 10 ft/sec = % x 1 x 102 = 50 ft. lbs

2 . Ten slugs given 1 ft/sec = % x 10 x 12 = 5 ft. lbs.

Alternately, the metric formula can be used using kilojoules where:

M = mass, kilograms (kg)

V = velocity, metres/second (m/s).

Therefore, the second line (2) is more efficient because it wastes less energy and produces the same momentum by accelerating a large mass of air at a low velocity. From this result it is proven a large propeller is more efficient at the relatively lower aircraft speeds than a jet engine, which accelerates a relatively small volume of air at a much higher velocity. The reverse becomes true at higher aircraft speeds where the jet engine has superior efficiency, due to other factors not related to propellers. [See Diagram 11, Propulsive Efficiency v. True Air Speed].

The static prop thrust produced when the aircraft is stationary can be calculated from the following formula:

Static prop thrust = PDA x V1 x p x Vo The cruise thrust can be calculated from a similar formula:

Cruise thrust = PDA x (V + V1) x p x Vo

Where PDA = prop disc area, sq. ft (or sq. m)

V = aircraft velocity, FPS (or M/s)

V1 = inflow velocity, FPS (or M/s)

Vo = outflow velocity, FPS (or M/s) p = air density, slugs/cu. ft (or kg/m3)

Note, when using Imperial units the answer is in pounds of thrust and for SI units the answer is in Kilogram force. The difference in the formulas between the static prop thrust and cruise thrust is the addition of the aircraft velocity (V) in the cruise formula. When referring to the propwash velocity, unless otherwise stated the velocity in the axial direction only is considered. The helical velocity (or race rotation) as it is known, is ignored

The location of the propeller on the aircraft is an important consideration for the aircraft designer If it is placed too close to the airframe or engine nacelle, thrust and efficiency can be reduced and also, the propwash velocity will reduce and its pressure will rise. This fact becomes relevant when debating the advantages and disadvantages between pusher and tractor propellers: some people claim pushers have greater efficiency. But do they? The air mass flowing through the prop disc is accelerating causing a pressure differential, by lowering the pressure in front of the prop and raising it behind, as mentioned previously. The propwash from a single-engine tractor prop flows over the entire fuselage increasing the parasite drag in proportion to the greater pressure gradient created by the propeller. This can amount to a 5% increase of fuselage drag equating to prop efficiency about 4% lower than a pusher prop, thus favouring a pusher as being slightly more efficient. If the prop is now placed at the far end of the fuselage as a pusher, the 5% increase in parasite drag mentioned above, is now cancelled. However, it is not all good news! The decrease of air pressure in front of the pusher prop’s disc has the effect of lowering the pressure gradient on the aft portion of the fuselage resulting in an increase of drag in that area. This is equivalent to a loss in prop thrust of about 5% and a loss in propeller efficiency of 2-3%. The net result is, tractor and pusher props come out about even as far as efficiency is concerned.

What has been said above regards fuselage mounted tractor and pusher props, also applies to wing mounted engines on multi-engine aircraft. The engine cowling causes a disturbance to the passing propwash, which reacts back on the propeller as interference, which reducing the prop’s apparent pitch and efficiency. Pusher props are affected by the reduced propwash velocity and interference caused by the engine cowling in front of the prop. The reduced propwash mainly affects the inner portion of the propeller blades, leaving the outer portion unaffected as it operates at a higher rate of advance than the inner portions of the blades.

With the exception of the above paragraph, it has been assumed the propeller to be ‘free standing’, and unaffected by the presence of the fuselage or engine nacelle behind the prop: the thrust is then referred to as ‘free thrust’. However, if we take into consideration the presence of the fuselage or nacelle and its affect on the propeller propwash, we then refer to the disturbed propwash as ‘apparent’ or ‘gross thrust’. Going one step further, if the drag is subtracted from the gross thrust (caused by the propwash flowing over the fuselage or nacelle) the term is ‘propulsive’ or ‘net thrust’. Propulsive thrust is always a constant fraction less than the apparent thrust due to the drag being proportional to the ‘propwash velocity squared’. That is the theory according to R. E. Froude… we now resume with the blade element theory.

One advantage a propeller has over a jet engine is the addition of the propwash flowing over the parts of the wing and empennage (tailplane). The total lift produced by the wings is influenced by the total slipstream over the whole aircraft plus the wing lift enclosed within the propwash. The total amount of lift can be varied within limits, by variation in engine power settings and thus changes in propwash thrust with the aircraft at constant speed. [The jet aircraft must increase air speed to increase lift, and due to the aircraft’s inertia, this takes time]. Variations in propwash and wing lift can be used to advantage during the approach to land when the aircraft may experience a rapid sink. An increase in engine power will increase the propwash-flow over the wing lift and thus, increase lift to stop the sink. With power on, another advantage is the additional lift that lowers the stalling speed by 5-10 knots, depending on the aircraft type

Prop Disc Loading

Prop disc loading is defined as the engine’s ‘BHP divided by the prop disc area’. If the propeller’s diameter is increased, it will lead to an increase in the prop disc area, which will reduce the prop disc loading and in turn, increase the propeller efficiency. The prop disc loading can be reduced by either increasing the prop diameter or by reducing the engine’s BHP. If the BHP is increased and a prop of the same diameter is used, it follows the prop disc loading will be increased. However, if the increase in prop disc loading is too great, a loss in efficiency will result. This is due to the increased air pressure at the rear of the prop disc leaking around the propeller tips causing an increase in prop tip vortices and induced drag. The same affect occurs on a wing that is too short for the aircraft. In fact, the prop disc loading has the same affect as the aircraft’s wing loading.

The value of the prop disc loading can be found given the engine’s BHP and the prop’s diameter, or better still, its prop disc area, which for a 74 inch diameter prop is found to be 29.86 square feet. The prop disc loading is then found from the formula:

„ Brake horsepower

Prop disc loading = ————– —– ——-

Prop disc area

Подпись: 200 BHP 29.86 sq . ft
Подпись: 6.7 HP/sq.ft

The power absorbed by a fixed-pitch propeller will vary as the cube of the RPM change (RPM3) depending on the air density and RPM. A given engine power is produced by any one given RPM, air density being constant. The maximum RPM of a modern light aircraft piston-engine is usually limited to around 2700 RPM, mainly due to the noise and compressibility caused by the high propeller tip speed. Some relatively recent production models run even slower usually around 2500 RPM maximum. Most engines could run up to about 3600 RPM before destruction occurs, but it is the prop tip speed that determines the maximum allowable engine RPM, indicated by the red line on the engine’s tachometer. A propeller reduction gear with a fixed gear ratio will then be incorporated in the drive between the engine and propeller As far as the engine is concerned, running at higher RPM is advantageous because the greater number of power strokes per minutes produces greater power. The Lycoming TIO-540 engine is a good example here; this is a direct drive engine producing 380 BHP at a red line of 2900 RPM. The geared version of this engine, the TIGO – 541, produces its maximum power of 425 BHP at 3200 RPM. Both engines are identical except for the reduction gear on the TIGO-541 engine. The propeller on the geared engine can absorb the greater horsepower and therefore, produce greater thrust while maintaining the prop tip speed within acceptable limits

With the prop of a geared engine turning at a lower RPM than a direct drive prop, the blades will meet the airflow into the prop disc at a much lower speed. They would therefore do less work in producing thrust, resulting in a loss in efficiency. To overcome this loss, the prop’s solidity is increased by using more blades or wider chord blades, or by increasing the prop’s diameter. However, increasing the diameter too much results in
too a high tip speed, which was the reason for using reduction gear in the first instance. This emphasises the need to match the prop to the engine’s BHP and the aircraft design air speed. On a piston engine, the reduction gear will have a ratio of around 3:2, but for turboprop engines due to their inherent design, have an operating speed of 10,000-15,000 RPM (or even higher depending on the engine design) require a much greater reduction gear ratio. The Rolls Royce Dart engine for example, has ratio of 10.75:1. It must now be emphasised here, it is the engine that is geared, not the propeller. A geared piston engine can be recognised by its designation. For example, the letter ‘G’ in Lycoming’s TIGO-541 engine indicates the engine is geared

It has been determined thus far that the maximum propeller efficiency occurs when the prop produces the maximum thrust/torque ratio. Also considered were the factors, which determine how much engine power, or torque, the prop absorbs and transmits as thrust energy to the propwash.